Burnham Holdings, Inc.
Burnham Holdings, Inc.
Burnham Holdings, Inc.

Create successful ePaper yourself
Turn your PDF publications into a flip-book with our unique Google optimized e-Paper software.
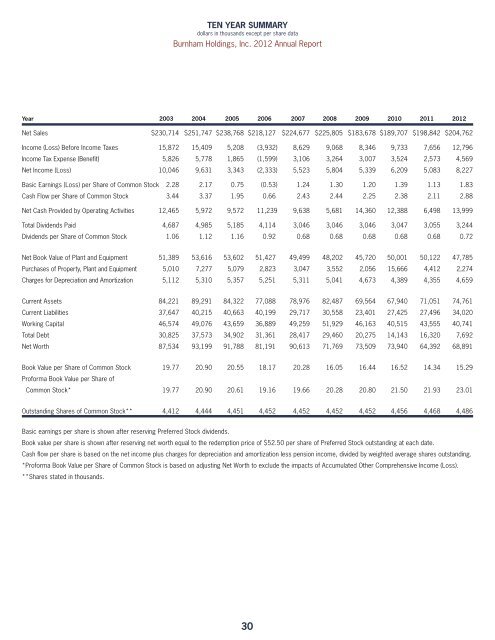
TEN YEAR SUMMARY<br />
dollars in thousands except per share data<br />
<strong>Burnham</strong> <strong>Holdings</strong>, <strong>Inc</strong>. 2012 Annual Report<br />
Year 2003 2004 2005 2006 2007 2008 2009 2010 2011 2012<br />
Net Sales $230,714 $251,747 $238,768 $218,127) $224,677 $225,805 $183,678 $189,707 $198,842 $204,762<br />
<strong>Inc</strong>ome (Loss) Before <strong>Inc</strong>ome Taxes 15,872 15,409 5,208 (3,932) 8,629 9,068 8,346 9,733 7,656 12,796<br />
<strong>Inc</strong>ome Tax Expense (Benefit) 5,826 5,778 1,865 (1,599) 3,106 3,264 3,007 3,524 2,573 4,569<br />
Net <strong>Inc</strong>ome (Loss) 10,046 9,631 3,343 (2,333) 5,523 5,804 5,339 6,209 5,083 8,227<br />
Basic Earnings (Loss) per Share of Common Stock 2.28 2.17 0.75 (0.53) 1.24 1.30 1.20 1.39 1.13 1.83<br />
Cash Flow per Share of Common Stock 3.44 3.37 1.95 0.66) 2.43 2.44 2.25 2.38 2.11 2.88<br />
Net Cash Provided by Operating Activities 12,465 5,972 9,572 11,239 9,638 5,681 14,360 12,388 6,498 13,999<br />
Total Dividends Paid 4,687 4,985 5,185 4,114) 3,046 3,046 3,046 3,047 3,055 3,244<br />
Dividends per Share of Common Stock 1.06 1.12 1.16 0.92) 0.68 0.68 0.68 0.68 0.68 0.72<br />
Net Book Value of Plant and Equipment 51,389 53,616 53,602 51,427) 49,499 48,202 45,720 50,001 50,122 47,785<br />
Purchases of Property, Plant and Equipment 5,010 7,277 5,079 2,823) 3,047 3,552 2,056 15,666 4,412 2,274<br />
Charges for Depreciation and Amortization 5,112 5,310 5,357 5,251) 5,311 5,041 4,673 4,389 4,355 4,659<br />
Current Assets 84,221 89,291 84,322 77,088) 78,976 82,487 69,564 67,940 71,051 74,761<br />
Current Liabilities 37,647 40,215 40,663 40,199) 29,717 30,558 23,401 27,425 27,496 34,020<br />
Working Capital 46,574 49,076 43,659 36,889) 49,259 51,929 46,163 40,515 43,555 40,741<br />
Total Debt 30,825 37,573 34,902 31,361) 28,417 29,460 20,275 14,143 16,320 7,692<br />
Net Worth 87,534 93,199 91,788 81,191) 90,613 71,769 73,509 73,940 64,392 68,891<br />
Book Value per Share of Common Stock<br />
Proforma Book Value per Share of<br />
19.77 20.90 20.55 18.17) 20.28 16.05 16.44 16.52 14.34 15.29<br />
Common Stock* 19.77 20.90 20.61 19.16) 19.66 20.28 20.80 21.50 21.93 23.01<br />
Outstanding Shares of Common Stock** 4,412 4,444 4,451 4,452) 4,452 4,452 4,452 4,456 4,468 4,486<br />
Basic earnings per share is shown after reserving Preferred Stock dividends.<br />
Book value per share is shown after reserving net worth equal to the redemption price of $52.50 per share of Preferred Stock outstanding at each date.<br />
Cash flow per share is based on the net income plus charges for depreciation and amortization less pension income, divided by weighted average shares outstanding.<br />
*Proforma Book Value per Share of Common Stock is based on adjusting Net Worth to exclude the impacts of Accumulated Other Comprehensive <strong>Inc</strong>ome (Loss).<br />
**Shares stated in thousands.<br />
30