Intraspecific Variation in Viola suavis in Europe ... - Annals of Botany
Intraspecific Variation in Viola suavis in Europe ... - Annals of Botany
Intraspecific Variation in Viola suavis in Europe ... - Annals of Botany

You also want an ePaper? Increase the reach of your titles
YUMPU automatically turns print PDFs into web optimized ePapers that Google loves.
452<br />
PC3<br />
0·172<br />
0·068<br />
–0·035<br />
–0·139<br />
0·098<br />
<strong>suavis</strong> – white<br />
C & SE<br />
<strong>Europe</strong><br />
<strong>suavis</strong> – blue<br />
C & SE <strong>Europe</strong><br />
PC1<br />
runs provided stable results only at K ¼ 2. The means <strong>of</strong><br />
the estimated posterior log probability <strong>of</strong> the data over ten<br />
run replicates for each K value [mean L(K)] <strong>in</strong>creased<br />
with <strong>in</strong>creas<strong>in</strong>g values <strong>of</strong> K up to K ¼ 4, but decreased at<br />
K ¼ 5. At K ¼ 4 and 5 some replicate runs also <strong>in</strong>ferred<br />
empty clusters. At K ¼ 2 the two groups resolved corresponded<br />
to the Iberian and C & SE <strong>Europe</strong>an accessions,<br />
respectively. At K ¼ 3, seven replicate runs <strong>in</strong>ferred the<br />
clusters <strong>of</strong> (a) all Iberian populations, (b) the C & SE<br />
<strong>Europe</strong>an white-flowered populations, and (c) the C & SE<br />
<strong>Europe</strong>an blue-flowered populations; three replicate runs<br />
<strong>in</strong>ferred the clusters <strong>of</strong> (a) the Iberian white-flowered populations,<br />
(b) the Iberian blue-flowered populations, and (c)<br />
all C & SE <strong>Europe</strong>an populations.<br />
Results <strong>of</strong> the analysis <strong>of</strong> molecular variance (AMOVA)<br />
are summarized <strong>in</strong> Table 3. The analysis revealed significant<br />
differentiation between Spa<strong>in</strong> and C & SE <strong>Europe</strong><br />
(51 % <strong>of</strong> total variance). Only 16 % <strong>of</strong> total variance was<br />
attributed to the differentiation between the white- and<br />
blue-flowered morphotypes. The highest differentiation<br />
(58 % <strong>of</strong> total variance) was achieved when consider<strong>in</strong>g<br />
Mered’a et al. — <strong>Intraspecific</strong> <strong>Variation</strong> <strong>in</strong> <strong>Viola</strong> <strong>suavis</strong><br />
–0·009<br />
–0·116<br />
<strong>suavis</strong> – blue<br />
Spa<strong>in</strong><br />
<strong>suavis</strong> – white<br />
Spa<strong>in</strong><br />
–0·097<br />
–0·223<br />
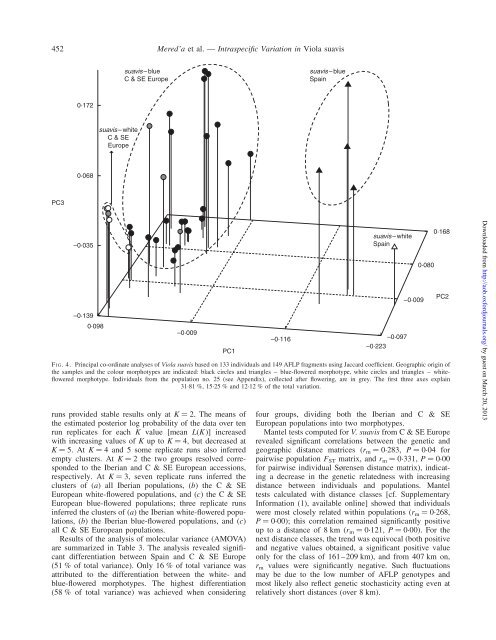
F IG. 4. Pr<strong>in</strong>cipal co-ord<strong>in</strong>ate analyses <strong>of</strong> <strong>Viola</strong> <strong>suavis</strong> based on 133 <strong>in</strong>dividuals and 149 AFLP fragments us<strong>in</strong>g Jaccard coefficient. Geographic orig<strong>in</strong> <strong>of</strong><br />
the samples and the colour morphotypes are <strong>in</strong>dicated: black circles and triangles – blue-flowered morphotype, white circles and triangles – whiteflowered<br />
morphotype. Individuals from the population no. 25 (see Appendix), collected after flower<strong>in</strong>g, are <strong>in</strong> grey. The first three axes expla<strong>in</strong><br />
31.81 %, 15.25 % and 12.12 % <strong>of</strong> the total variation.<br />
–0·009<br />
0·080<br />
0·168<br />
PC2<br />
four groups, divid<strong>in</strong>g both the Iberian and C & SE<br />
<strong>Europe</strong>an populations <strong>in</strong>to two morphotypes.<br />
Mantel tests computed for V. <strong>suavis</strong> from C & SE <strong>Europe</strong><br />
revealed significant correlations between the genetic and<br />
geographic distance matrices (rm ¼ 0.283, P ¼ 0.04 for<br />
pairwise population FST matrix, and rm ¼ 0.331, P ¼ 0.00<br />
for pairwise <strong>in</strong>dividual Sørensen distance matrix), <strong>in</strong>dicat<strong>in</strong>g<br />
a decrease <strong>in</strong> the genetic relatedness with <strong>in</strong>creas<strong>in</strong>g<br />
distance between <strong>in</strong>dividuals and populations. Mantel<br />
tests calculated with distance classes [cf. Supplementary<br />
Information (1), available onl<strong>in</strong>e] showed that <strong>in</strong>dividuals<br />
were most closely related with<strong>in</strong> populations (rm ¼ 0.268,<br />
P ¼ 0.00); this correlation rema<strong>in</strong>ed significantly positive<br />
up to a distance <strong>of</strong> 8 km (rm ¼ 0.121, P ¼ 0.00). For the<br />
next distance classes, the trend was equivocal (both positive<br />
and negative values obta<strong>in</strong>ed, a significant positive value<br />
only for the class <strong>of</strong> 161–209 km), and from 407 km on,<br />
r m values were significantly negative. Such fluctuations<br />
may be due to the low number <strong>of</strong> AFLP genotypes and<br />
most likely also reflect genetic stochasticity act<strong>in</strong>g even at<br />
relatively short distances (over 8 km).<br />
Downloaded from<br />
http://aob.oxfordjournals.org/ by guest on March 20, 2013