Intraspecific Variation in Viola suavis in Europe ... - Annals of Botany
Intraspecific Variation in Viola suavis in Europe ... - Annals of Botany
Intraspecific Variation in Viola suavis in Europe ... - Annals of Botany

You also want an ePaper? Increase the reach of your titles
YUMPU automatically turns print PDFs into web optimized ePapers that Google loves.
V. <strong>suavis</strong> – blue<br />
(211, 212)<br />
V. <strong>suavis</strong> – blue + white<br />
(4, 22, 143, 165, 170, 174, 175, 208)<br />
0·001<br />
(156, 198, 221)<br />
V. hirta<br />
was used to test for morphological differentiation among the<br />
groups, as suggested by AFLP analyses.<br />
Prior to multivariate analyses, a non-parametric Spearman<br />
correlation coefficient was calculated <strong>in</strong> order to elim<strong>in</strong>ate<br />
pairs <strong>of</strong> highly correlated characters that might distort<br />
further analyses (cf. Legendre and Legendre, 1998).<br />
Pr<strong>in</strong>cipal component analysis (PCA) and cluster analysis<br />
were performed on matrix A, with the populations def<strong>in</strong>ed<br />
by the mean values <strong>of</strong> the characters measured. PCA<br />
(Sneath and Sokal, 1973), based on a correlation matrix<br />
between the characters, was used to recover the nonhierarchical<br />
structure <strong>in</strong> the dataset. Two different PCAs<br />
were run; one <strong>in</strong>clud<strong>in</strong>g all 20 characters and the other with<br />
only 15 characters, exclud<strong>in</strong>g the five characters that<br />
express pigmentation (i.e. LP, PP, KP, CP and CPSP; see<br />
Table 1). In the cluster analysis the UPGMA (unweighted<br />
pair-group method us<strong>in</strong>g arithmetic averages) and MISSQ<br />
(<strong>in</strong>cremental sum <strong>of</strong> squares method – Ward’s method)<br />
algorithms were employed (Everitt, 1986). The primary<br />
data were standardized by zero mean and unit standard deviation,<br />
and the Euclidean coefficient was used to compute the<br />
secondary distance matrix.<br />
To exam<strong>in</strong>e the extent <strong>of</strong> morphological separation <strong>of</strong> the<br />
groups suggested by AFLP data, canonical discrim<strong>in</strong>ant<br />
analyses (CDA; Klecka, 1980) were computed on matrix<br />
B, with <strong>in</strong>dividual plants treated as objects. Discrim<strong>in</strong>ant<br />
analyses generally require multivariate normal distribution<br />
<strong>of</strong> the characters, but they were shown to be considerably<br />
robust aga<strong>in</strong>st deviations <strong>in</strong> this respect (Thorpe, 1976;<br />
Klecka, 1980).<br />
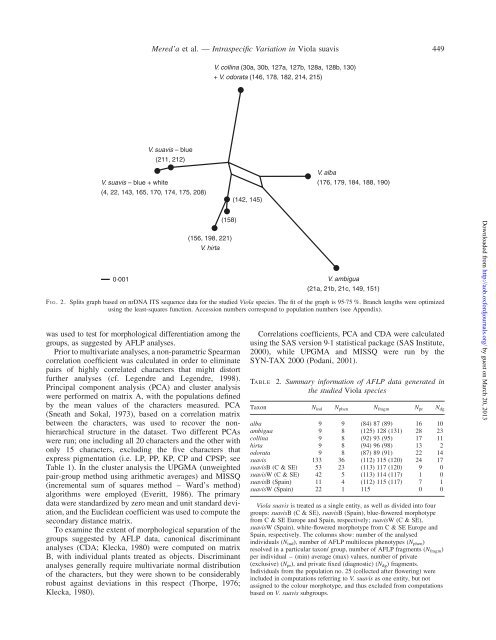
Mered’a et al. — <strong>Intraspecific</strong> <strong>Variation</strong> <strong>in</strong> <strong>Viola</strong> <strong>suavis</strong> 449<br />
V. coll<strong>in</strong>a (30a, 30b, 127a, 127b, 128a, 128b, 130)<br />
+ V. odorata (146, 178, 182, 214, 215)<br />
(158)<br />
(142, 145)<br />
V. alba<br />
(176, 179, 184, 188, 190)<br />
V. ambigua<br />
(21a, 21b, 21c, 149, 151)<br />
F IG. 2. Splits graph based on nrDNA ITS sequence data for the studied <strong>Viola</strong> species. The fit <strong>of</strong> the graph is 95.75 %. Branch lengths were optimized<br />
us<strong>in</strong>g the least-squares function. Accession numbers correspond to population numbers (see Appendix).<br />
Correlations coefficients, PCA and CDA were calculated<br />
us<strong>in</strong>g the SAS version 9.1 statistical package (SAS Institute,<br />
2000), while UPGMA and MISSQ were run by the<br />
SYN-TAX 2000 (Podani, 2001).<br />
TABLE 2. Summary <strong>in</strong>formation <strong>of</strong> AFLP data generated <strong>in</strong><br />
the studied <strong>Viola</strong> species<br />
Taxon N<strong>in</strong>d Nphen Nfragm Npr Ndg<br />
alba 9 9 (84) 87 (89) 16 10<br />
ambigua 9 8 (125) 128 (131) 28 23<br />
coll<strong>in</strong>a 9 8 (92) 93 (95) 17 11<br />
hirta 9 8 (94) 96 (98) 13 2<br />
odorata 9 8 (87) 89 (91) 22 14<br />
<strong>suavis</strong> 133 36 (112) 115 (120) 24 17<br />
<strong>suavis</strong>B (C & SE) 53 23 (113) 117 (120) 9 0<br />
<strong>suavis</strong>W (C & SE) 42 5 (113) 114 (117) 1 0<br />
<strong>suavis</strong>B (Spa<strong>in</strong>) 11 4 (112) 115 (117) 7 1<br />
<strong>suavis</strong>W (Spa<strong>in</strong>) 22 1 115 0 0<br />
<strong>Viola</strong> <strong>suavis</strong> is treated as a s<strong>in</strong>gle entity, as well as divided <strong>in</strong>to four<br />
groups: <strong>suavis</strong>B (C & SE), <strong>suavis</strong>B (Spa<strong>in</strong>), blue-flowered morphotype<br />
from C & SE <strong>Europe</strong> and Spa<strong>in</strong>, respectively; <strong>suavis</strong>W (C & SE),<br />
<strong>suavis</strong>W (Spa<strong>in</strong>), white-flowered morphotype from C & SE <strong>Europe</strong> and<br />
Spa<strong>in</strong>, respectively. The columns show: number <strong>of</strong> the analysed<br />
<strong>in</strong>dividuals (N<strong>in</strong>d), number <strong>of</strong> AFLP multilocus phenotypes (Nphen)<br />
resolved <strong>in</strong> a particular taxon/ group, number <strong>of</strong> AFLP fragments (N fragm)<br />
per <strong>in</strong>dividual – (m<strong>in</strong>) average (max) values, number <strong>of</strong> private<br />
(exclusive) (Npr), and private fixed (diagnostic) (Ndg) fragments.<br />
Individuals from the population no. 25 (collected after flower<strong>in</strong>g) were<br />
<strong>in</strong>cluded <strong>in</strong> computations referr<strong>in</strong>g to V. <strong>suavis</strong> as one entity, but not<br />
assigned to the colour morphotype, and thus excluded from computations<br />
based on V. <strong>suavis</strong> subgroups.<br />
Downloaded from<br />
http://aob.oxfordjournals.org/ by guest on March 20, 2013