PLANTING DATES OATS - Auburn University Repository
PLANTING DATES OATS - Auburn University Repository
PLANTING DATES OATS - Auburn University Repository

Create successful ePaper yourself
Turn your PDF publications into a flip-book with our unique Google optimized e-Paper software.
BULLETIN 329<br />
SEPTEMBER 1960<br />
<strong>PLANTING</strong><br />
<strong>DATES</strong><br />
for<br />
<strong>OATS</strong><br />
for forage and grain<br />
AGRICULFURAL EXPERIMENT STATION<br />
~-'E. V.<br />
AUBURN<br />
SMITH, Director<br />
UNIVERS ITY<br />
<strong>Auburn</strong>,<br />
Alabama
EXPERIMENTAL PROCEDURE<br />
CONTENTS<br />
R E SU L T S . .. . . . . . . . . . . . . . . . . . . .<br />
Oats For Forage ........ .<br />
Oats For Grain After Clipping<br />
Oats For Forage And Grain<br />
Oats For Grain Only<br />
SUMMARY - -<br />
ACKNOWLEDGMENTS -<br />
FIRST PRINTING 4M SEPTEMBER 1960<br />
Page<br />
4<br />
-- 5<br />
6<br />
7<br />
8<br />
9<br />
10<br />
11
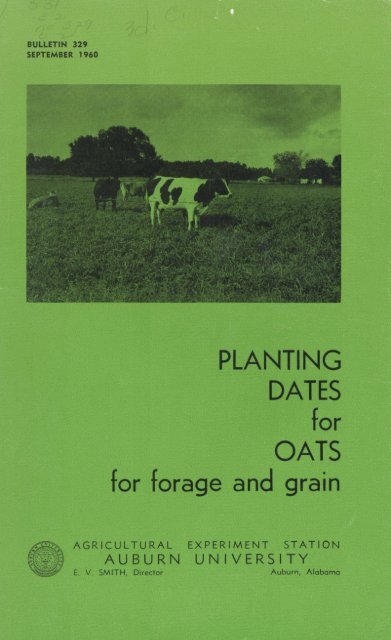
<strong>PLANTING</strong> <strong>DATES</strong> for <strong>OATS</strong><br />
for forage and grain<br />
F. S. McCAIN, Plant Breeder<br />
COOPER KING, JR., Assistant Agronomist<br />
<strong>OATS</strong> HAVE been grown in Alabama for many years. Only in<br />
recent years has this crop become one of importance.<br />
Before the livestock industry grew to its present size in Alabama,<br />
there was little interest in oat production. Limited markets<br />
for the grain, poor varieties, and a general lack of knowledge<br />
of how to produce oats were some major causes for lack of<br />
interest. Immediately after World War II cattle numbers in<br />
Alabama began to increase and with this came an increase in oat<br />
production, Table 1.<br />
From 1950 until 1956 oat acreages doubled and leveled off<br />
at about one-half million acres. A sharp decrease in acreage<br />
occurred in 1958. In 1959 total acreage again approached the<br />
one-half million mark.<br />
Approximately one-fourth the total oat acreage is harvested<br />
for grain and most of this is harvested after cattle are grazed on<br />
TABLE 1. <strong>OATS</strong>-ACREAGE, YIELD, PRODUCTION, 1950-591<br />
Total Total Average Total<br />
Year planted harvested yield per production<br />
planted for grain acre<br />
Acres Acres Bu. Bu.<br />
1950 277,000 72,000 26.0 1,872,000<br />
1951 219,000 42,000 27.0 1,184,000<br />
1952 272,000 85,000 28.5 2,422,000<br />
1953 373,000 188,000 32.0 4,416,000<br />
1954 545,000 185,000 29.5 5,458,000<br />
1955 649,000 170,000 26.0 4,420,000<br />
1956 519,000 165,000 34.0 5,610,000<br />
1957 503,000 170,000 25.0 3,000,000<br />
1958 402,000 96,000 31.0 2,976.000<br />
1959 481,000 112,000 80.0 83.860.000<br />
1 These data were taken from reports compiled by the Alabama Cooperative<br />
Crop Reporting Service.
4 ALABAMA AGRICULTURAL EXPERIMENT STATION<br />
the crop. The remaining three-fourths is either grazed completely<br />
or harvested for hay or silage.<br />
Oats produced at the <strong>Auburn</strong> <strong>University</strong> Agricultural Experiment<br />
Station and at six of its Substations averaged 55 to 60<br />
bushels of oats per acre for many years. This is in contrast to<br />
the highest average production in the State of 34 bushels per<br />
acre in 1956. The Station's Department of Agricultural Economics<br />
has determined that the cost of growing oats in the<br />
Tennessee Valley using average cultural practices is approximately<br />
$33 per acre. This does not include land cost.<br />
It is estimated that 20 to 25 million bushels of oats are required<br />
to meet current annual needs in Alabama. This is 4<br />
to 5 times the production of 1956. Based on 1959 figures the<br />
amount of oat grain needed is 7 to 8 times the amount produced.<br />
Oats furnish two, sources of feed for livestock, grazing and<br />
grain. The value of forage often exceeds the value of grain.<br />
To use the full potential of oats, a farmer must produce high<br />
yields. First, a good soil for oat production is needed. Most<br />
well-drained soils are suitable. Satisfactory grain yields may<br />
be obtained when oats are planted on a prepared seedbed or<br />
in corn, cotton, and grain sorghum middles or in sods. For fall<br />
grazing, oats need to be planted on a well-prepared seedbed.<br />
Lime, phosphorus, and potash needs are determined by soil tests,<br />
and applications made before or at the time of planting. Results of<br />
experiments show that satisfactory yields of oat forage may be<br />
obtained from an application of 50 pounds of nitrogen per acre<br />
as a topdressing in the fall after the crop is up to a stand. If<br />
a grain crop is to be harvested, it is advisable to discontinue<br />
grazing about February 15 to March 1 and apply an additional<br />
50 pounds of nitrogen per acre. It is recommended that oats<br />
grown only for grain be given a spring application of nitrogen<br />
but none in the fall.<br />
The Small Grain Variety Report published by this Station<br />
serves as a guide for selecting varieties.<br />
The purpose of this bulletin is to report results of experiments<br />
conducted to determine the best seeding dates for oats,<br />
for grain, and for forage and grain.<br />
EXPERIMENTAL PROCEDURE<br />
The experiments were conducted at the following seven locations:<br />
Tennessee Valley Substation, Sand Mountain Substation,
<strong>PLANTING</strong> <strong>DATES</strong> FOR <strong>OATS</strong> 5<br />
Piedmont Substation, Main Station, Black Belt Substation, Lower<br />
Coastal Plain Substation, and Gulf Coast Substation. The tests<br />
consisted of two varieties of oats (Nortex 107 and Victorgrain<br />
48-93) planted at four different dates in northern and southern<br />
Alabama and at five different dates in central Alabama. Planting<br />
dates for northern Alabama were August 20, September 10,<br />
September 30, and October 20. In central Alabama planting<br />
dates were August 20, September 10, September 30, October 20,<br />
and November 10. In southern Alabama oats were planted on<br />
September 10, September 30, October 20, and November 10.<br />
Oats were seeded at the rate of three bushels per acre. Two<br />
series of plots were used at each location with one managed for<br />
grain production only. At planting these plots received adequate<br />
rates of phosphate and potash fertilizers based on previous experiments.<br />
Fifty pounds of nitrogen per acre was applied as a<br />
topdressing on or about March 1. The other series of plots was<br />
managed for the production of forage (grazing) and grain. These<br />
plots received the same phosphate and potash applications at<br />
planting as those managed for grain only. In addition, these plots<br />
received 50 pounds per acre of nitrogen as a topdressing when<br />
oats were up to a stand. Forage and grain yields were determined<br />
by conventional experimental methods. Clipping was discontinued<br />
on or about March 1 and an additional 50 pounds of<br />
nitrogen per acre was applied.<br />
According to the Station's Department of Animal Husbandry<br />
and Nutrition, a pound of dry matter from oats, if consumed as<br />
green pasturage by animals, is equivalent in feed value to a<br />
pound of oat grain. This factor was used to convert forage yields<br />
to grain equivalents.<br />
Information was obtained at seven locations over a 6-year<br />
period with some exceptions. Because of adverse weather and<br />
damage by animals, all tests at all locations did not yield reliable<br />
data each year. For these reasons results obtained represent 26<br />
location-years. Data reported include 9 location years from northern,<br />
10 from central, and 7 from southern Alabama.<br />
RESULTS<br />
The varieties responded similarly to the different planting<br />
dates in northern and central Alabama. However, Victorgrain<br />
48-93 was superior to Nortex 107 with respect to yield of forage<br />
and grain in these regions. In southern Alabama there was no
6 ALABAMA AGRICULTURAL EXPERIMENT STATION<br />
difference between varieties. Since varietal responses were similar,<br />
data for both varieties have been combined. Detailed data<br />
are given in the Appendix.<br />
Average yields of forage, grain from clipped plots, combined<br />
yields of forage and grain, and grain from unclipped plots are<br />
given in Figures 1, 2, 3, and 4, respectively.<br />
Oats for Forage<br />
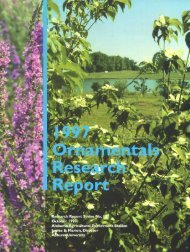
Figure 1 shows that maximum forage yields were obtained<br />
from September 10 plantings in both northern and central sections.<br />
September 30th plantings in southern Alabama gave the<br />
highest forage yields. Yields of forage in northern and central<br />
Alabama were about the same for comparable dates of planting.<br />
Maximum yields were about 1,600 pounds of dry forage per<br />
acre. In southern Alabama forage yields from the different<br />
dates of planting exceeded those from comparable dates in the<br />
other two regions, with maximum yields being approximately<br />
2,300 pounds of dry matter per acre for the September 30 planting<br />
date. Total forage production was not determined, since<br />
clipping was discontinued by mid-February in southern Alabama<br />
and by March 1 in northern and central Alabama.<br />
Yield,<br />
pounds per acre<br />
2,400<br />
2,000,<br />
1,600<br />
1,200<br />
800<br />
400<br />
0-<br />
Aug. Sept. Sept. Oct Aug. Sept Sept. Oct Nov. Sept Sept Oct. Nov.<br />
20 10 30 20 20 10 30 20 10 10 30 20 10<br />
Northern Central Southern<br />
FIG. 1. The graph above shows oat forage yields from different dates of planting,<br />
1952-57. LSD .05 for northern, central, and southern Alabama was 348, 350,<br />
and 442 pounds per acre, respectively.
<strong>PLANTING</strong> <strong>DATES</strong> FOR <strong>OATS</strong> 7<br />
Oats for Grain after Clipping<br />
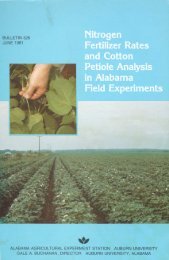
Highest yields of grain from clipped plots were obtained in<br />
northern Alabama and lowest yields in southern Alabama, Figure<br />
2, whereas forage yields were the reverse. Under clipped conditions,<br />
grain yields increased with each successive date of<br />
planting in northern Alabama. This was true, even though forage<br />
yields dropped significantly for the September 30 and October<br />
20 planting dates. Practically no forage was obtained from<br />
the October 20 plantings. A comparison of the grain yield for<br />
the October 20 plantings under clipped conditions, Figure 2,<br />
and the yield of grain for the same date under non-clipped conditions,<br />
Figure 4, reveals that there is no difference between the<br />
two. Clipping reduced the yield of grain from the August 20,<br />
September 10, and September 30 plantings by approximately 200<br />
pounds per acre when compared to unclipped plots, Figure 4.<br />
However, the 1,100 to 1,600 pounds of forage obtained more than<br />
offset this 200 pound loss of grain.<br />
In central Alabama clipping did not materially affect grain<br />
yields for any date of planting.<br />
Yield,<br />
pounds per acre<br />
2,400<br />
1,600<br />
I, 200<br />
800<br />
400<br />
0-<br />
Aug. Sept.<br />
20 10<br />
Sept.<br />
30<br />
Oct.<br />
20<br />
Aug. Sept. Sept<br />
20 1030 IO<br />
Oct<br />
20<br />
Nov.<br />
10<br />
Sept. Sept.<br />
10 30<br />
Oct.<br />
20<br />
Nov.<br />
10<br />
Northern Central Southern<br />
FIG. 2. Grain yields from clipped oats are shown above from different dates of<br />
planting, 1952-57. LSD .05 for northern, central, and southern Alabama was<br />
218, 192, and 160 pounds per acre, respectively.
8 ALABAMA AGRICULTURAL EXPERIMENT STATION<br />
Yields of grain were decreased approximately 200 pounds per<br />
acre for all planting dates in southern Alabama as a result of<br />
clipping. Because grain yields are almost always low in southern<br />
Alabama, this loss from clipping amounts to approximately 20<br />
per cent. However, this loss is not excessive since forage yields<br />
were high enough to more than offset the lower yield of grain.<br />
It is doubtful if farmers in southern Alabama should grow oats<br />
only for grain in view of the low yields usually obtained.<br />
Oats for Forage and Grain<br />
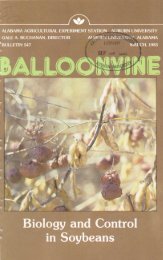
By combining forage and grain yields by the method described,<br />
there is little difference in maximum yields on a feed value basis<br />
for the three regions of the State, Figure 3. Maximum yields for<br />
northern and central Alabama were obtained from the Septem-<br />
Yield,<br />
pounds per acre<br />
3,200<br />
2 800<br />
2 400<br />
2 000<br />
1,600<br />
1200<br />
800<br />
400-<br />
0-<br />
Aug. Sept. Sept. Oct. Aug. Sept. Sept Oct. Nov Sept Sept Oct Nov<br />
20 1030 20 20 10 30 20 10 10 30 20 10<br />
Northern Central Southern<br />
2:Forage and grain Grin only<br />
FIG. 3. The above graph shows combined yields of forage and grain from different<br />
dates of planting, 1 952-57. LSD .05 for northern, central, and southern<br />
Alabama was 292, 275, and 371 pounds per acre, respectively.
<strong>PLANTING</strong> <strong>DATES</strong> FOR <strong>OATS</strong> 9<br />
ber 10 planting date, whereas the September 30 planting date<br />
in southern Alabama gave the highest yield. The similarity of<br />
yield curves for the three regions is striking if the 20-day delay<br />
in planting interval between southern Alabama and the other<br />
two regions is taken into consideration.<br />
The best planting dates for combined forage and grain production<br />
were September 10 in northern and central Alabama<br />
and September 30 in southern Alabama, Figure 3.<br />
Oats for Grain Only<br />
Grain yields on unclipped plots were approximately 2,000,<br />
1,500, and 900 pounds per acre in northern, central and southern<br />
Alabama, respectively, Figure 4. It apparently makes little difference<br />
when oats are planted if harvested for grain only. There<br />
were minor yield advantages for September 30 and October 20<br />
planting dates for all regions. In general, these dates are 20 to<br />
30 days later than those recommended for planting for forage<br />
and grain in northern and central Alabama. However, they coincide<br />
rather closely with the recommended date for forage and<br />
grain production in southern Alabama.<br />
Yield,<br />
pounds per acre<br />
2,400<br />
2,000-<br />
1,600 .<br />
1,200<br />
800-<br />
400 -<br />
Aug. Sept Sept. Oct. Aug. Sept Sept. Oct. Nov. Sept. Sept Oct. Nov.<br />
20 10 30 20 20 10 30 20 10 10 30 20 10<br />
Northern Centrol Southern<br />
FIG. 4. Yields from oats managed for grain only in northern, central, and southern<br />
Alabama from different dates of planting 1952-57, are given in the graph.
10<br />
ALABAMA AGRICULTURAL EXPERIMENT STATION<br />
SUMMARY<br />
Experiments were conducted from 1952 through 1957 to determine<br />
the best dates of planting oats for grain only and for<br />
forage and grain combined. There were seven test locations<br />
with two, three, and two locations representing northern, central<br />
and southern Alabama, respectively. Four dates of planting were<br />
used in northern and southern Alabama and five dates in central<br />
Alabama. One series of plots at each location was managed<br />
to determine grain yields only and another series was managed<br />
to determine grain and forage yields. Total yields were calculated<br />
by considering that a pound of dry forage, if consumed as<br />
green pasturage, is equivalent to a pound of grain.<br />
Forage yields for comparable dates of planting were highest<br />
in southern Alabama. There was relatively little difference between<br />
forage yields for comparable dates in central and northern<br />
Alabama. Northern Alabama produced the highest grain yields<br />
followed in order by the central and southern regions. This was<br />
true for all planting dates. Yields of grain were decreased somewhat<br />
by clipping but the forage obtained more than compensated<br />
for this loss. When forage and grain yields were combined, there<br />
was relatively little difference in maximum per acre production<br />
of feed in the regions. There was, however, a difference in the<br />
best date to plant for maximum yields. The recommended planting<br />
dates for forage and grain production in the three regions<br />
are: northern Alabama, September 1 to September 20; central<br />
Alabama, September 1 to September 30; and southern Alabama,<br />
September 20 to October 20.<br />
Planting dates did not materially affect yield of oats grown<br />
for grain only in any of the regions. The maximum difference<br />
(8 bushels per acre) occurred between the September 10 and<br />
October 20 planting dates in central Alabama. This indicates<br />
that most any of the planting dates in any of the regions would<br />
be satisfactory for grain production only.
<strong>PLANTING</strong> <strong>DATES</strong> FOR <strong>OATS</strong> 11<br />
ACKNOWLEDGMENTS<br />
The experiments reported herein were conducted by many<br />
workers of this Station. Credit is due E. F. Schultz', Foy Campbell',<br />
F. L. Selman', L. J. Chapman, and D. G. Sturkie of the<br />
Main Station, <strong>Auburn</strong>, Alabama. Personnel who cooperated at<br />
Substations were J. K. Boseck, W. W. Cotney, E. L. Mayton,<br />
L. A. Smith, V. L. Brown, and Otto Brown 2 .<br />
Resigned<br />
2 Retired
APPENDIX TABLE 1. FORAGE YIELDS FROM NORTEX 107 AND VICTORGRAIN 48-93 <strong>OATS</strong> SEEDED AT DIFFERENT <strong>DATES</strong>, AUGUST 20 TO<br />
OCTOBER 20 IN NORTHERN ALABAMA, 1952-1957<br />
Average yield dry matter per acre<br />
Variety Date of Belle Mina Winfield Regional<br />
seedingg<br />
1952 1953 1954 1955 1957 1952 1953 1955 1957 average<br />
Lb. Lb. Lb. Lb. Lb. Lb. Lb. Lb. Lb. Lb.<br />
Nortex 107 Aug. 20 1,022 1,664 1,614 0 2,702 1,724 769 55 1,874 1,269<br />
Sept. 10 1,603 1,631 2,804 130 2,761 1,603 718 174 1,549 1,441<br />
Sept. 30 343 937 1,461 178 1,821 1,364 616 368 1,633 969<br />
Oct. 20 0 110 0 0 0 617 110 83 785 189<br />
Victorgrain 48-93 Aug. 20 654 3,431 2,453 39 2,223 2,504 994 77 1,772 1,572<br />
Sept. 10 2,280 2,461 2,088 295 2,845 2,323 1,402 428 1,693 1,757<br />
Sept. 30 682 1,354 1,623 273 1,991 2,190 926 532 1,487 1,229<br />
Oct. 20 166 360 0 39 0 969 301 215 1,158 356<br />
APPENDIX TABLE 2. FORAGE YIELDS FROM NORTEX 107 AND VICTORGRAIN 48-93 <strong>OATS</strong> SEEDED AT DIFFERENT <strong>DATES</strong>, AUGUST 20 TO<br />
NOVEMBER 10 IN CENTRAL ALABAMA, 1952-1957<br />
Average yield dry matter per acre<br />
Variety Date of Camp Hill <strong>Auburn</strong> MarionRegional<br />
Variety seeding Junction<br />
1952 1953 1954 1955 1952 1953 1954 1955 1957 1954 average<br />
Lb. Lb. Lb. Lb. Lb. Lb. Lb. Lb. Lb. Lb. Lb.<br />
Nortex 107 Aug. 20 1 2,455 1,644 108 1 3,034 702 1,272 2,237 1,020 1,525<br />
Sept. 10 885 3,139 2,523 113 1,9638 2,239 257 944 1,927 863 1,485<br />
Sept. 30 370 2,488 1,379 34 955 1,165 926 1,038 2,246 894 1,150<br />
Oct. 20 299 519 329 210 633 666 181 565 563 1,051 502<br />
Nov. 10 66 112 269 82 214 122 70 302 175 454 187<br />
Victorgrain48-93 Aug. 20 1 2,437 1,711 324 1 3,070 732 792 948 1,176 1,363<br />
Sept. 10 928 3,176 2,314 174 1,825 3,664 418 756 2,033 1,308 1,660<br />
Sept. 30 538 3,177 1,774 175 1,031 1,742 1,288 1,474 2,006 1,311 1,452<br />
Oct. 20 507 775 575 244 1,398 436 418 1,010 596 1,254 721<br />
Nov. 10 221 202 438 256 578 388 223 636 224 614 373<br />
'Yields not obtained.<br />
w<br />
0<br />
m<br />
z<br />
-I<br />
-0<br />
-o<br />
z
APPENDIX TABLE 3. FORAGE YIELDS FROM NORTEX 107 AND VICTORGRAIN 48-93 <strong>OATS</strong> SEEDED AT DIFFERENT <strong>DATES</strong>, SEPTEMBER 10<br />
TO NOVEMBER 10 IN SOUTHERN ALABAMA, 1953-1957<br />
Average yield dry matter per acre<br />
Variety Date of Camden Fairhope<br />
seeding<br />
1953 1954 1955 1957 1954 1955 1957 average<br />
Lb. Lb. Lb. Lb. Lb. Lb. Lb. Lb.<br />
Nortex 107 Sept. 10 1,519 1,491 199 1,983 3,253 4,311 2,144 2,129<br />
Sept. 30 2,150 1,516 762 2,175 2,643 3,822 1,662 2,104<br />
Oct. 20 1,178 2,014 1,688 1,768 2,457 3,839 1,396 2,049<br />
Nov. 10 710 110 321 1,107 2,238 1,995 1,913 1,199<br />
Victorgrain 48-93 Sept. 10 2,537 596 1,001 1,173 3,268 4,299 1,288 2,023<br />
Sept. 30 2,578 1,550 1,895 2,147 2,642 5,478 1,433 2,532<br />
Oct. 20 1,104 2,576 1,975 1,695 2,846 3,612 1,000 2,115<br />
Nov. 10 1,170 248 810 1,140 2,303 2,911 1,276 1,408<br />
z<br />
0<br />
0<br />
0<br />
w
APPENDIX TABLE 4. TOTAL PRODUCTION FROM CLIPPED AND UNCLIPPED NORTEX 107 AND VICTORGRAIN 48-93 <strong>OATS</strong> SEEDED AT<br />
DIFFERENT <strong>DATES</strong>, AUGUST 20 TO OCTOBER 20 IN NORTHERN ALABAMA, 1952-1957<br />
Average yield per acre<br />
Variety Date of Treatment Belle Mina Winfield Regional<br />
seeding<br />
1952 1953 1954 1955 1957 1952 1953 1955 1957 average<br />
Lb. Lb. Lb. Lb. Lb. Lb. Lb. Lb. Lb. Lb.<br />
Nortex 107 Aug. 20 Clipped 3,393 4,058 2,840 1,062 3,710 3,654 2,414 1,700 3,048 2,875<br />
Unclipped 2,326 2,752 899 1,632 1,728 2,448 1,296 1,693 2,189 1,885<br />
Sept. 10 Clipped 4,182 3,740 4,289 1,125 3,849 3,283 2,228 2,001 2,794 3,055<br />
Unclipped 2,211 2,330 1,267 1,062 2,070 1,690 2,054 1,875 2,010 1,841<br />
Sept. 30 Clipped 1,905 3,023 2,891 1,109 2,992 4,129 2,062 2,422 2,807 2,593<br />
Unclipped 1,478 2,637 1,296 1,037 1,824 2,931 1,386 1,850 1,379 1,758<br />
Oct. 20 Clipped 1,446 2,107 1,539 1,632 1,552 3,372 2,411 1,846 2,731 2,071<br />
Unclipped 1,021 2,710 1,480 1,594 1,715 2,771 1,926 1,766 2,349 1,920<br />
Victorgrain 48-93 Aug. 20 Clipped 3,025 6,055 3,272 1,469 3,817 4,226 3,253 1,248 2,860 3,247<br />
Unclipped 2,768 2,445 1,078 1,146 2,163 3,133 2,387 1,066 2,045 2,026<br />
Sept. 10 Clipped 5,211 4,397 3,394 1,085 4,355 3,910 4,052 2,412 2,672 3,499<br />
Unclipped 3,270 2,227 682 723 2,272 2,179 1,994 1,606 2,154 1,901<br />
Sept. O30 Clipped 3,846 3,808 2,346 1,105 3,732 5,438 3,400 2,311 2,831 3,202<br />
Unclipped 2,675 3,238 1,485 682 2,473 3,757 2,400 1,645 2,250 2,289<br />
Oct. 20 Clipped 2,748 3,509 2,112 1,386 2,176 4,329 2,426 2,039 3,398 2,680<br />
Unclipped 870 2,490 2,083 1,405 2,150 2,989 2,221 1,862 2,806 2,097<br />
rwvo<br />
r Cc<br />
Cm<br />
7v r*<br />
x<br />
m<br />
z--<br />
-I<br />
-<br />
o<br />
z
APPENDIX TABLE 5. TOTAL PRODUCTION FROM CLIPPED AND UNCLIPPED NORTEX 107 AND VICTORGRAIN 48-93 <strong>OATS</strong> SEEDED AT<br />
DIFFERENT <strong>DATES</strong>, AUGUST 20 TO NOVEMBER 10 IN CENTRAL ALABAMA, 1952-1957<br />
Average yield per acre<br />
Variety Date of o Treatment<br />
Camp Hill <strong>Auburn</strong> Marion Rieseeding<br />
June- gional<br />
1952 1953 1954 1955 1952 1953 1954 1955 1957 ton aver-<br />
1954 age<br />
Lb. Lb. Lb. Lb. Lb. Lb. Lb. Lb. Lb. Lb. Lb.<br />
Nortex 107 Aug. 20 Clipped 1 3,777 4,063 1,087 1 3,908 1,608 1,794 2,445 2,358 2,715<br />
Unclipped 1 1,549 1,549 1,472 ' 1,130 627 280 1,789 1,619 1,357<br />
Sept. 10 Clipped 2,834 4,272 4,533 971 4,398 3,100 1,307 1,453 2,253 2,527 2,765<br />
Unclipped 1,510 1,376 1,030 1,184 1,651 1,430 662 474 480 2,365 1,216<br />
Sept. 30 Clipped 3,202 3,564 4,041 837 2,597 2,698 2,280 1,678 2,736 2,897 2,653<br />
Unclipped 1,859 1,222 1,779 982 2,035 1,510 1,014 413 595 2,512 1,392<br />
Oct. 20 Clipped 2,654 2,564 2,470 1,519 2,799 2,100 1,611 1,039 1,059 2,181 2,000<br />
Unclipped 1,648 1,798 2,336 995 1,709 1,482 1,376 400 522 1,277 1,354<br />
Nov. 10 Clipped 2,092 2,499 2,675 898 1,900 1,325 1,433 884 841 2,150 1,670<br />
Unclipped 1,350 1,286 2,925 1,117 1,651 1,171 851 314 448 2,287 1,3385<br />
Victorgrain 48-93 Aug. 20 Clipped 1 5,170 4,713 1,428 i 5,105 1,033 1,323 1,076 2,709 2,916<br />
Unclipped 1 2,518 2,490 1,288 1 1,869 378 522 208 2,547 1,573<br />
Sept. 10 Clipped 2,320 5,954 4,576 1,224 3,537 5,728 1,167 1,700 2,292 2,726 3,124<br />
Unclipped 1,184 1,795 1,984 1,037 1,626 1,904 650 362 1,197 2,595 1,433<br />
Sept. 30 Clipped 3,152 5,449 3,976 882 2,653 3,704 2,619 1,740 2,236 3,052 2,946<br />
Unclipped 1,942 1,782 2,432 1,254 2,333 2,861 1,037 256 1,114 2,128 1,714<br />
Oct. 20 Clipped 2,805 2,391 2,946 1,226 2,819 8,236 1,756 1,410 1,028 2,172 2,179<br />
Unclipped 1,830 2,026 3,037 1,117 3,219 2,890 1,242 400 771 1,533 1,807<br />
Nov. 10 Clipped 1,872 2,480 2,505 1,168 2,354 2,220 1,260 1,241 915 2,150 1,817<br />
Unclipped 1,686 1,498 3,059 1,021 2,102 1,395 1,008 544 554 1,923 1,479<br />
Yields not obtained.<br />
r-<br />
z<br />
z<br />
-a<br />
m<br />
0<br />
-I<br />
m<br />
0-I<br />
NMI
APPENDIX TABLE 6. TOTAL PRODUCTION FROM CLIPPED AND UNCLIPPED NORTEX 107 AND VICTOEGRAIN 48-93 <strong>OATS</strong> SEEDED AT<br />
DIFFERENT <strong>DATES</strong>, SEPTEMBER 10 TO NOVEMBER 10 IN SOUTHERN ALABAMA, 1953-1957<br />
Average yield per acre<br />
Variety Date of Treatment Camden Fairhope<br />
seeding<br />
Rgoa<br />
1953 1954 1955 1957 1954 1955 157 average<br />
Lb. Lb. Lb. Lb. Lb. Lb. Lb. Lb.<br />
Nortex 107 Sept. 10 Clipped 3,087 2,704 1,466 2,185 3,349 4,884 2,307 2,855<br />
Unclipped 1,293 2,083 1,142 362 518 723 230 907<br />
Sept. 30 Clipped 3,648 2,754 1,620 2,857 2,713 5,265 1,771 2,947<br />
Unclipped 1,920 1,798 1,050 115 163 1,142 141 904<br />
Oct. 20 Clipped 2,157 3,784 2,955 2,478 2,716 4,969 1,527 2,941<br />
Uncipped 1,075 2,259 1,226 435 736 762 186 954<br />
Nov. 10 Clipped 1,280 1,416 1,601 2,166 2,443 3,262 2,086 2,036<br />
Unclipped 973 2,016 995 406 339 506 163 771<br />
Victorgrain 48-93 Sept. 10 Clipped 4,003 1,646 2,281 1,173 3,326 4,449 1,288 2,595<br />
Unclipped 2,080 1,184 982° 202 1,075 163 0 812<br />
Sept. 30 Clipped 4,120 2,964 2,836 2,320 2,725 5,696 1,433 3,156<br />
Uncdipped 1,862 2,083 886 550 896 736 0 1,002<br />
Oct. 20 Clipped 2,346 4,086 2,970 2,073 2,942 4,034 1,000 2,779<br />
Unclipped 1,530 1,798 1,075 230 637 915 0. 884<br />
Nov. 10 Clipped 2,248 1,992 1,847 1,575 2,361 3,266 1,276 2,081<br />
Unclipped 1,510 1,837 790 550 544 995 0 889<br />
U'I-<br />
w<br />
II-<br />
2r<br />
C<br />
2r<br />
C<br />
m<br />
x<br />
m<br />
m<br />
z HI
APPENDIX TABLE 7. GRAIN YIELDS FROM CLIPPED AND UNCLIPPED NORTEX 107 AND VICTORGRAIN 48-93 <strong>OATS</strong> SEEDED AT DIFFERENT<br />
<strong>DATES</strong>, AUGUST 20 TO OCTOBER 20 IN NORTHERN ALABAMA, 1952-1957<br />
. r<br />
Average yield per acre<br />
Variety<br />
Variety<br />
Date of Trm<br />
seeding ramn<br />
Belle Mina<br />
-- o<br />
Winfield Regional<br />
~IC~ T I\II -II~I 1952 /1 1958 111 \~1 1 1~~ 1954 ~ /1 IIU 1955 IU ~I~- ~.~1Y<br />
1957<br />
r\<br />
1952 1953 1955 :1957 average<br />
Bu. Bu. Bu. Bu. Bu. Bu. Bu. By. Bu. Bu.<br />
Nortex 107 Aug. 20 Clipped<br />
Uncipped<br />
Sept. 10 Clipped<br />
Unclipped<br />
Sept. 30 Clipped<br />
Unclipped<br />
Oct. 20 Clipped<br />
Unclipped<br />
74.1<br />
72.7<br />
80.6<br />
69.1<br />
48.8<br />
46.2<br />
45.2<br />
31.9<br />
74.8<br />
86.0<br />
65.9<br />
72.8<br />
65.2<br />
82.4<br />
62.4<br />
84.7<br />
38.3<br />
28.1<br />
46.4<br />
39.6<br />
44.7<br />
40.5<br />
48.1<br />
44.7<br />
33.2<br />
51.0<br />
31.1<br />
33.2<br />
29.1<br />
32.4<br />
51.0<br />
49.8<br />
31.5<br />
54.0<br />
34.0<br />
64.7<br />
36.6<br />
57.0<br />
48.5<br />
53.6<br />
60.3<br />
76.5<br />
52.5<br />
52.8<br />
86.4<br />
91.6<br />
86.1<br />
86.6<br />
51.4<br />
40.5<br />
47.2<br />
64.2<br />
45.2<br />
43.3.<br />
71.9<br />
60.2<br />
51.4<br />
52.9<br />
57.1<br />
58.6<br />
64.2<br />
57.8<br />
55.1<br />
55.2<br />
36.7<br />
68.4<br />
38.9<br />
62.8<br />
36.7<br />
43.1<br />
60.8<br />
73.4<br />
50.2<br />
58.9<br />
50.4<br />
57.5<br />
50.8<br />
54.9<br />
58.8<br />
60.0<br />
Victorgrain 48-93 Aug. 20 Clipped<br />
Uncdipped<br />
Sept. 10 Clipped<br />
Undlipped<br />
Sept. 30 Clipped<br />
Undlipped<br />
Oct. 20 Clipped<br />
Unclipped<br />
74.1<br />
86.5<br />
91.6<br />
102.2<br />
98.9<br />
83.6<br />
80.7<br />
27.2<br />
82.0<br />
76.4<br />
60.5<br />
69.6<br />
76.7<br />
101.2<br />
98.4<br />
77.8<br />
25.6<br />
33.7<br />
40.8<br />
21.3<br />
22.6<br />
46.4<br />
66.0<br />
65.1<br />
44.7<br />
35.8<br />
24.7<br />
22.6<br />
26.0<br />
21.3<br />
42.1<br />
43.9<br />
49.8<br />
67.6<br />
47.2<br />
71.0<br />
54.4<br />
77.3<br />
68.0<br />
67.2<br />
53.8<br />
97.9<br />
49.6<br />
68.1<br />
101.5<br />
117.4<br />
105.0<br />
93.4<br />
70.6<br />
74.6<br />
82.8<br />
62.3<br />
77.3<br />
75.0<br />
66.4<br />
69.4<br />
36.6<br />
33.3<br />
62.0<br />
50.2<br />
55.6<br />
51.4<br />
57.0<br />
58.2<br />
34.0<br />
63.9<br />
30.6<br />
67.3<br />
42.0<br />
70.3<br />
70.0<br />
87.7<br />
52.4<br />
63.3<br />
54.4<br />
59.4<br />
61.7<br />
71.5<br />
72.6<br />
65.5<br />
Mz<br />
z<br />
G)<br />
-I<br />
m<br />
0<br />
0<br />
Mr
APPENDIX TABLE 8. GRAIN YIELDS FROM CLIPPED AND UNCLIPPED NORTEX 107 AND VICTORGRAIN 48-93 <strong>OATS</strong> SEEDED AT DIFFERENT<br />
<strong>DATES</strong>, AUGUST 20 TO NOVEMBER 10 IN CENTRAL ALABAMA, 1952-1957<br />
Average yield per acre<br />
Variety Date seeding of Treatment Camp Hill <strong>Auburn</strong> Junction Marion Regional<br />
1952 1953 1954 1955 1952 1953 1954 1955 1957 1954 average<br />
Bu. Bu. Bu. Bu. Bu. Bu. Bu. Bu. Bu. Bu. Bu.<br />
Nortex 107 Aug. 20 Clipped 1 41.3 75.6 30.6 1 27.3 28.3 16.3 6.4 41.8 37.2<br />
Unclipped 1 48.4 48.4 46.0 1 35.3 19.6 7.2 55.9 50.6 42.4<br />
Sept. 10 Clipped 60.9 35.4 62.8 26.8 76.1 26.9 32.8 15.9 10.2 52.0 40.0<br />
Unclipped 47.2 43.0 32.2 37.0 51.6 44.7 20.7 14.8 15.0 73.9 38.0<br />
Sept. 30 Clipped 88.5 33.6 83.2 25.1 51.3 47.9 42.3 20.0 15.3 62.6 47.0<br />
Unclipped 58.1 38.2 55.6 30.7 63.6 47.2 31.7 12.9 18.6 78.5 43.5<br />
Oct. 20 Clipped 73.6 63.9 66.9 40.9 67.7 44.8 44.7 14.8 15.5 35.3 46.8<br />
Unclipped 51.5 56.2 73.0 31.1 53.4 46.3 43.0 12.5 16.3 39.9 42.8<br />
Nov. 10 Clipped 63.3 74.6 75.2 25.5 52.7 37.6 42.6 18.2 20.8 53.0 46.4<br />
Unclipped 42.2 40.2 91.4 34.9 51.6 36.6 26.6 9.8 14.0 69.9 41.7<br />
Victorgrain 48-93 Aug. 20 Clipped 1 85.4 93.8 34.5 1 63.6 9.4 16.6 4.0 47.9 48.5<br />
Unclipped 1 78.7 77.8 38.7 1 58.4 11.8 16.3 6.5 79.6 49.2<br />
Sept. 10 Clipped 43.5 86.8 70.7 32.8 53.5 64.5 23.4 29.5 8.1 44.3 45.7<br />
Unclipped 37.0 56.1 62.0 32.4 50.8 59.5 20.3 11.3 37.4 81.1 44.8<br />
Sept. 30 Clipped 81.7 71.0 68.8 22.1 50.7 61.3 41.6 8.3 7.2 54.4 46.7<br />
Unclipped 60.7 55.7 76.0 39.2 72.9 89.4 32.4 8.0 34.8 66.5 58.6<br />
Oct. 20 Clipped 71.8 50.5 74.1 80.7 44.4 87.5 41.8 12.5 13.5 28.7 45.6<br />
Unclipped 57.2 63.3 94.9 34.9 100.6 90.3 38.8 12.5 24.1 47.9 56.4<br />
Nov. 10 Clipped 51.6 71.2 64.6 28.5 55.5 58.8 32.4 18.9 21.6 48.0 45.1<br />
Unclipped 52.7 46.8 95.6 31.9 65.7 43.6 31.5 17.0 17.3 60.1 46.2<br />
1 Yields not obtained.<br />
r-<br />
w<br />
0<br />
M<br />
C<br />
r-<br />
c<br />
I-<br />
m<br />
x<br />
"o<br />
m<br />
m<br />
z<br />
-<br />
-I<br />
-I<br />
z
APPENDIX TABLE 9. GRAIN YIELDS FROM CLIPPED AND UNCLIPPED NORTEX 107 AND VICTOEGRAIN 48-93 <strong>OATS</strong> SEEDED AT DIFFERENT<br />
<strong>DATES</strong>, SEPTEMBER 10 TO NOVEMBER 10 IN SOUTHERN ALABAMA, 1953-1957<br />
Average yield per acre<br />
Variety<br />
Date of<br />
seeding<br />
Treatment Camden<br />
YIII~YUI V-~- ~YII-YYIL -V 1_V ~ VIY~~~Y-UIC 1953 ~-V 1954 LI1 VVI- 1955 1957 1954<br />
Fairhope<br />
1955 1957<br />
Regional<br />
average<br />
Nortex 107<br />
Sept. 10<br />
Sept. 30<br />
Oct. 20<br />
Nov. 10<br />
Clipped<br />
Unclipped<br />
Clipped<br />
Uncipped<br />
Clipped<br />
Uncipped<br />
Clipped<br />
Unclipped<br />
Bu.<br />
49.0<br />
40.4<br />
46.8<br />
60.0<br />
30.6<br />
33.6<br />
17.8<br />
30.4<br />
Bu.<br />
37.9<br />
65.1<br />
38.7<br />
56.2<br />
55.3<br />
70.6<br />
40.8<br />
63.0<br />
Bu.<br />
39.6<br />
35.7<br />
26.8<br />
32.8<br />
39.6<br />
38.3<br />
40.0<br />
31.1<br />
Bu.<br />
6.3<br />
11.3<br />
21.3<br />
3.6<br />
22.2<br />
13.6<br />
33.1<br />
12.7<br />
Bu.<br />
3.0<br />
16.2<br />
2.2<br />
5.1<br />
8.1<br />
23.0<br />
6.4<br />
10.6<br />
Bu.<br />
17.9<br />
22.6<br />
45.1<br />
35.7<br />
35.3<br />
23.8<br />
39.6<br />
15.8<br />
Ru.<br />
5.1<br />
7.2<br />
3.4<br />
4.4<br />
4.1<br />
5.8<br />
5.4<br />
5.1<br />
Bu.<br />
22.7<br />
28.4<br />
26.3<br />
28.3<br />
27.9<br />
29.8<br />
26.2<br />
24.1<br />
Victorgrain 48-93 Sept. 10<br />
Sept. 30<br />
Oct. 20<br />
Nov. 10<br />
Clipped<br />
Unclipped<br />
Clipped<br />
Unclipped<br />
Clipped<br />
Unclipped<br />
Clipped<br />
Unclipped__<br />
TT I I<br />
45.8<br />
65.0<br />
48.2<br />
58.2<br />
38.8<br />
47.8<br />
33.7<br />
47.2<br />
Lli~ I~<br />
32.8<br />
37.0<br />
44.2<br />
65.1<br />
47.2<br />
56.2<br />
54.5<br />
57.4<br />
~II II<br />
40.0<br />
30.7<br />
29.4<br />
27.7<br />
31.1<br />
33.6<br />
32.4<br />
24.7<br />
L~L) L.1<br />
.0<br />
6.3<br />
5.4<br />
17.2<br />
11.8<br />
7.2<br />
13.6<br />
17.2<br />
1.8<br />
33.6<br />
2.6<br />
28.0<br />
3.0<br />
19.9<br />
1.8<br />
17.0<br />
4.7<br />
5.1<br />
6.8<br />
23.0<br />
13.2<br />
28.6<br />
11.1<br />
31.1<br />
.0<br />
.0<br />
.0.<br />
.0<br />
.0<br />
.0<br />
.0<br />
.0<br />
17.9<br />
25.4<br />
19.5<br />
31.3<br />
20.7<br />
27.6<br />
21.0<br />
27.8<br />
nz<br />
-I<br />
0<br />
m<br />
0