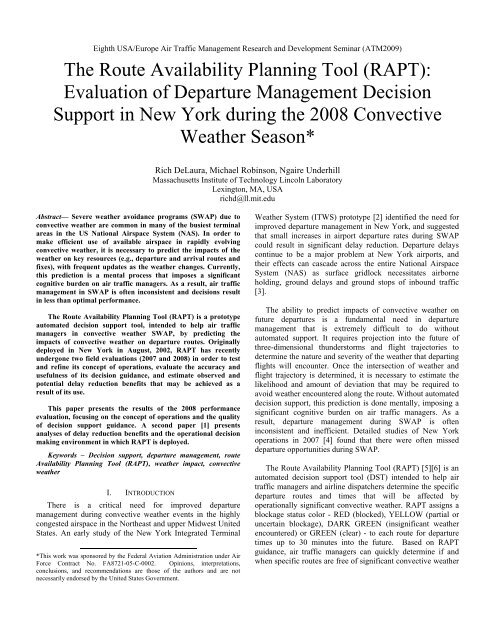
The Route Availability Planning Tool (RAPT) - MIT Lincoln Laboratory
The Route Availability Planning Tool (RAPT) - MIT Lincoln Laboratory
The Route Availability Planning Tool (RAPT) - MIT Lincoln Laboratory

You also want an ePaper? Increase the reach of your titles
YUMPU automatically turns print PDFs into web optimized ePapers that Google loves.
Eighth USA/Europe Air Traffic Management Research and Development Seminar (ATM2009)<br />
<strong>The</strong> <strong>Route</strong> <strong>Availability</strong> <strong>Planning</strong> <strong>Tool</strong> (<strong>RAPT</strong>):<br />
Evaluation of Departure Management Decision<br />
Support in New York during the 2008 Convective<br />
Weather Season*<br />
Abstract— Severe weather avoidance programs (SWAP) due to<br />
convective weather are common in many of the busiest terminal<br />
areas in the US National Airspace System (NAS). In order to<br />
make efficient use of available airspace in rapidly evolving<br />
convective weather, it is necessary to predict the impacts of the<br />
weather on key resources (e.g., departure and arrival routes and<br />
fixes), with frequent updates as the weather changes. Currently,<br />
this prediction is a mental process that imposes a significant<br />
cognitive burden on air traffic managers. As a result, air traffic<br />
management in SWAP is often inconsistent and decisions result<br />
in less than optimal performance.<br />
<strong>The</strong> <strong>Route</strong> <strong>Availability</strong> <strong>Planning</strong> <strong>Tool</strong> (<strong>RAPT</strong>) is a prototype<br />
automated decision support tool, intended to help air traffic<br />
managers in convective weather SWAP, by predicting the<br />
impacts of convective weather on departure routes. Originally<br />
deployed in New York in August, 2002, <strong>RAPT</strong> has recently<br />
undergone two field evaluations (2007 and 2008) in order to test<br />
and refine its concept of operations, evaluate the accuracy and<br />
usefulness of its decision guidance, and estimate observed and<br />
potential delay reduction benefits that may be achieved as a<br />
result of its use.<br />
This paper presents the results of the 2008 performance<br />
evaluation, focusing on the concept of operations and the quality<br />
of decision support guidance. A second paper [1] presents<br />
analyses of delay reduction benefits and the operational decision<br />
making environment in which <strong>RAPT</strong> is deployed.<br />
Keywords – Decision support, departure management, route<br />
<strong>Availability</strong> <strong>Planning</strong> <strong>Tool</strong> (<strong>RAPT</strong>), weather impact, convective<br />
weather<br />
I. INTRODUCTION<br />
<strong>The</strong>re is a critical need for improved departure<br />
management during convective weather events in the highly<br />
congested airspace in the Northeast and upper Midwest United<br />
States. An early study of the New York Integrated Terminal<br />
*This work was sponsored by the Federal Aviation Administration under Air<br />
Force Contract No. FA8721-05-C-0002. Opinions, interpretations,<br />
conclusions, and recommendations are those of the authors and are not<br />
necessarily endorsed by the United States Government.<br />
Rich DeLaura, Michael Robinson, Ngaire Underhill<br />
Massachusetts Institute of Technology <strong>Lincoln</strong> <strong>Laboratory</strong><br />
Lexington, MA, USA<br />
richd@ll.mit.edu<br />
Weather System (ITWS) prototype [2] identified the need for<br />
improved departure management in New York, and suggested<br />
that small increases in airport departure rates during SWAP<br />
could result in significant delay reduction. Departure delays<br />
continue to be a major problem at New York airports, and<br />
their effects can cascade across the entire National Airspace<br />
System (NAS) as surface gridlock necessitates airborne<br />
holding, ground delays and ground stops of inbound traffic<br />
[3].<br />
<strong>The</strong> ability to predict impacts of convective weather on<br />
future departures is a fundamental need in departure<br />
management that is extremely difficult to do without<br />
automated support. It requires projection into the future of<br />
three-dimensional thunderstorms and flight trajectories to<br />
determine the nature and severity of the weather that departing<br />
flights will encounter. Once the intersection of weather and<br />
flight trajectory is determined, it is necessary to estimate the<br />
likelihood and amount of deviation that may be required to<br />
avoid weather encountered along the route. Without automated<br />
decision support, this prediction is done mentally, imposing a<br />
significant cognitive burden on air traffic managers. As a<br />
result, departure management during SWAP is often<br />
inconsistent and inefficient. Detailed studies of New York<br />
operations in 2007 [4] found that there were often missed<br />
departure opportunities during SWAP.<br />
<strong>The</strong> <strong>Route</strong> <strong>Availability</strong> <strong>Planning</strong> <strong>Tool</strong> (<strong>RAPT</strong>) [5][6] is an<br />
automated decision support tool (DST) intended to help air<br />
traffic managers and airline dispatchers determine the specific<br />
departure routes and times that will be affected by<br />
operationally significant convective weather. <strong>RAPT</strong> assigns a<br />
blockage status color - RED (blocked), YELLOW (partial or<br />
uncertain blockage), DARK GREEN (insignificant weather<br />
encountered) or GREEN (clear) - to each route for departure<br />
times up to 30 minutes into the future. Based on <strong>RAPT</strong><br />
guidance, air traffic managers can quickly determine if and<br />
when specific routes are free of significant convective weather
impacts and available for use. To our knowledge, it is the only<br />
tool of its kind currently in operational use.<br />
In the summer of 2007, a comprehensive field evaluation<br />
of <strong>RAPT</strong> performance found that <strong>RAPT</strong> guidance provided a<br />
generally accurate assessment of route availability [6], and<br />
that significant delay reduction benefits could be achieved as a<br />
result of <strong>RAPT</strong> usage [4]. <strong>The</strong>se studies also found that oversensitivity<br />
to small-scale features of the input weather<br />
forecasts occasionally resulted in poor or unstable <strong>RAPT</strong><br />
guidance, which, in turn, reduced user confidence and<br />
realization of potential benefits. In order to improve the<br />
robustness of <strong>RAPT</strong> guidance, the <strong>RAPT</strong> route blockage<br />
algorithm was significantly redesigned, and a new version was<br />
deployed operationally in July, 2008.<br />
A second field study was performed in 2008 to evaluate the<br />
<strong>RAPT</strong> concept of operations, the quality of <strong>RAPT</strong> guidance,<br />
and the observed and potential delay reductions achievable as<br />
a result of <strong>RAPT</strong> usage. This paper presents an analysis of the<br />
accuracy of <strong>RAPT</strong> guidance and its ability to support the<br />
operational concept. <strong>RAPT</strong>, its operational concept and route<br />
blockage algorithm are described. <strong>The</strong> accuracy and<br />
operational relevance of <strong>RAPT</strong> guidance is evaluated, based<br />
on an analysis of several case days from the summer of 2008.<br />
Finally, enhancements planned for deployment in 2009 are<br />
presented. A second paper [1], also based on the field<br />
evaluation, presents an analysis of observed benefits, missed<br />
a.<br />
700 km.<br />
500 km.<br />
O climb<br />
O transition<br />
O near en route<br />
O en route<br />
opportunities and the operational decision making<br />
environment in which <strong>RAPT</strong> is deployed.<br />
II. <strong>RAPT</strong> DESCRIPTION<br />
<strong>RAPT</strong> is intended to reduce departure delays by<br />
automatically identifying opportunities for efficient, proactive<br />
and consistent use of available departure routes. <strong>RAPT</strong><br />
calculates route blockage along departure routes that are<br />
defined by four-dimensional, modeled flight trajectories that<br />
extend out to 60 minutes flight time. Trajectory points are<br />
calculated at one minute intervals.<br />
Flight trajectories have four phases – climb, transition, near<br />
en route and en route – that reflect flight altitude and airspace<br />
complexity. <strong>Route</strong>s are defined by ‘blockage boxes’ centered<br />
on the trajectory points, and box length and width are<br />
functions of the flight phase. <strong>The</strong> lengths are set to<br />
approximately two minutes flight distance, and the widths<br />
reflect the route density and the ability of air traffic control to<br />
maneuver flights around convective weather in the region<br />
traversed during the flight phase. Typically, routes are wide<br />
during the climb and transition phases (inside the TRACON),<br />
become narrower in the near en route phase where departure<br />
and arrival routes are densely packed (ZNY and northern<br />
ZDC), and widen again in the en route phase where routes are<br />
not so densely packed (ZOB and southern ZDC). Figure 1<br />
illustrates <strong>RAPT</strong> departure routes.<br />
b. route bounds<br />
en route<br />
near en route<br />
Figure 1. <strong>RAPT</strong> departure routes (a) and inset showing different route widths in near en route and en route airspace.<br />
Figure 2 illustrates the <strong>RAPT</strong> algorithm. Vertically<br />
integrated liquid (VIL) and echo tops forecasts from the<br />
Corridor Integrated Weather System (CIWS) [7] are input to a<br />
Weather Avoidance Field (WAF) generator that estimates the<br />
probability of pilot deviation at each pixel in the <strong>RAPT</strong><br />
domain. VIL provides a measure of precipitation intensity and<br />
the echo tops give an estimate of storm height, both of which<br />
are important factors in determining the severity of convective<br />
weather. <strong>The</strong> WAF in the TRACON is based on a heuristic<br />
convective weather avoidance model (CWAM), in which VIL<br />
intensity is the dominant factor. In en route airspace, the WAF<br />
is based on an en route CWAM [8], in which echo top height<br />
is dominant. Transition between TRACON and en route WAF<br />
occurs over a 20 km range (between 80 and 100 km from<br />
Newark International airport), in which WAF deviation<br />
probabilities are a range-weighted average between TRACON<br />
and en route WAF. WAF predictions are generated at five<br />
minute intervals, in synchronization with the CIWS forecast<br />
updates.<br />
<strong>The</strong> route blockage algorithm [9][10] calculates a route<br />
blockage at each trajectory point as a function of the WAF
deviation probabilities inside the blockage box for the point.<br />
<strong>The</strong> route blockage, a number between 0 and 1, is converted to<br />
a blockage status - RED (blocked), YELLOW (partial or<br />
uncertain blockage), DARK GREEN (insignificant weather<br />
encountered) and GREEN (clear) - using thresholds from a<br />
two dimensional ‘deviation sensitivity field’. <strong>The</strong> deviation<br />
sensitivity field reflects the disruption to air traffic in different<br />
regions of the <strong>RAPT</strong> domain that could result from an<br />
unexpected pilot deviation outside the blockage box. It<br />
provides a rudimentary estimate of decision risk. Deviation<br />
sensitivity is highest (i.e., blockage thresholds are lowest) near<br />
highly congested regions of the <strong>RAPT</strong> domain (e.g., near<br />
departure fixes) and lowest in far en route space where<br />
airspace is less congested.<br />
CIWS echo top<br />
forecast<br />
T0<br />
T0+ 5<br />
T0+10<br />
…<br />
T0+90<br />
WAF generator<br />
CIWS VIL<br />
forecast<br />
T0<br />
T0+ 5<br />
T0+10<br />
…<br />
T0+90<br />
<strong>The</strong> <strong>RAPT</strong> user interface (figure 3) displays the <strong>RAPT</strong><br />
timelines and a weather animation window. Each row of the<br />
timeline display corresponds to a departure route. Each<br />
column corresponds to a future departure time, starting at the<br />
current time and extending up to 30 minutes into the future in<br />
five minute intervals. <strong>The</strong> color of each timeline bin represents<br />
the departure status for the route and departure time.<br />
WAF forecast<br />
<strong>The</strong> departure status assigned to a particular route and<br />
departure time is the worst blockage status encountered along<br />
the departure trajectory. <strong>The</strong> blockage location is the trajectory<br />
phase where the worst blockage status on the departure<br />
trajectory first occurs (the ‘first worst’ blockage encountered).<br />
<strong>The</strong> departure status timeline for a route (the ‘<strong>RAPT</strong> timeline’)<br />
is the sequence of status triplets [route blockage status,<br />
blockage location, echo top height at the blockage location]<br />
for each departure time from T0 (the current time) to T0 + 30<br />
minutes, in one minute intervals. <strong>RAPT</strong> combines departure<br />
statuses into 5 minute ‘bins’ for the operational display, where<br />
the status of the bin is set to the worst (most restrictive)<br />
blockage in the bin. Note that weather forecasts are needed<br />
out to 90 minutes to support <strong>RAPT</strong> timeline generation (30<br />
minute departure time look-ahead + 60 minute departure flight<br />
trajectories).<br />
T0<br />
T0+ 5<br />
T0+10<br />
…<br />
T0+90<br />
<strong>Route</strong>s<br />
Deviation<br />
sensitivity field<br />
Blockage and<br />
timeline calculator<br />
<strong>RAPT</strong> timelines: route status + blockage location + echo tops<br />
Figure 2. <strong>RAPT</strong> algorithm overview.<br />
YELLOW and RED bins have text annotations giving the<br />
trajectory phase and the echo top height of the blockage<br />
location. <strong>The</strong> animation window overlays predicted locations<br />
of departing aircraft on forecasts of VIL or echo tops. Other<br />
CIWS product information, such as observed cloud-to-ground<br />
lightning strikes, can also be displayed.
departure routes<br />
departure locations<br />
(number indicates departure time in minutes<br />
after the hour; color indicates departure status)<br />
animation time<br />
departure routes<br />
(counter-clockwise from NE)<br />
<strong>RAPT</strong> Display (current time: 2330Z)<br />
<strong>RAPT</strong> usage is intended to improve departure efficiency by<br />
supporting more proactive decision making. <strong>The</strong> <strong>RAPT</strong><br />
concept of operations can be summarized as follows:<br />
• GREEN means GO! When weather impacts clear<br />
from a route and <strong>RAPT</strong> departure status goes from<br />
RED to GREEN (‘post impact GREEN’ or PIG),<br />
reopen the route with no weather-related restrictions.<br />
<strong>The</strong> <strong>RAPT</strong> concept of operations generally considers<br />
both GREEN and DARK GREEN as opportunities to<br />
go. However, since DARK GREEN implies the<br />
presence of some weather along the route, it is<br />
anticipated that users may wish to use their judgment<br />
in deciding whether to open the route with or without<br />
restrictions. As users gain confidence and experience<br />
with <strong>RAPT</strong> guidance, this portion of the concept of<br />
operations will be expanded to “GREEN and DARK<br />
GREEN mean GO!”<br />
• RED means STOP! When a departure status turns<br />
RED, severely restrict the route and begin planning<br />
reroutes for the affected departures.<br />
• YELLOW with improving trend or low echo top<br />
means RELEASE UNDER GUIDANCE. If the route<br />
is already open, consider increasing flow. If the route<br />
is currently closed, reopen with restrictions.<br />
• YELLOW with deteriorating trend means<br />
INCREASE RESTRICTIONS. If traffic is flowing,<br />
consider imposing restrictions begin planning<br />
reroutes.<br />
weather forecast animation window<br />
departure status<br />
(annotations give echo top and location of blockage)<br />
Figure 3. <strong>RAPT</strong> user interface.<br />
CIWS products<br />
for display<br />
departure times<br />
In order to implement the <strong>RAPT</strong> concept of operations,<br />
traffic managers must be confident that <strong>RAPT</strong> guidance<br />
accurately reflects operational reality. <strong>RAPT</strong> must reliably<br />
identify PIGs and REDs. <strong>RAPT</strong> should identify trends needed<br />
to support decision making under YELLOW conditions,<br />
particularly when weather is evolving. <strong>The</strong> distribution of<br />
<strong>RAPT</strong> to all participants in the departure management process<br />
should reduce the effort needed to coordinate departure<br />
management decisions and enable initiation of proactive<br />
decision making by any participant in the decision making<br />
chain.<br />
III. PERFORMANCE EVALUATION FROM 2008<br />
In order to determine the operational accuracy of <strong>RAPT</strong><br />
guidance, plots of observed traffic were compared to <strong>RAPT</strong><br />
departure status. <strong>The</strong>se comparisons confirmed the accuracy of<br />
the <strong>RAPT</strong> blockage model in most instances and identified<br />
circumstances where <strong>RAPT</strong> performed poorly. Figures 4-7<br />
illustrate several comparisons.<br />
Figure 4 shows the impacts of scattered thunderstorms on<br />
several <strong>RAPT</strong> departure routes. Departure traffic is unimpeded<br />
on GREEN routes (J95, J36 and J80) through clear air or over<br />
very weak, low-topped convective storms. YELLOW routes<br />
(J6, J48) are impacted by more vigorous convection (echo tops<br />
to 25-30 kft), and traffic is running “2-as-1” (reduced<br />
departure streams for both routes are merged to avoid weather<br />
impacts near the TRACON, then separated onto the individual<br />
routes once the weather is cleared). Traffic is also running on<br />
J60 (YELLOW). <strong>The</strong> RED route (J75) is blocked by vigorous
level 5 convection with echo tops up to 40 kft., and no traffic<br />
is observed on the route. Overall, <strong>RAPT</strong> guidance appears to<br />
match departure operations well.<br />
Figure 5 presents an illustration of the impacts of two<br />
thunderstorm cells as the storms grow. <strong>RAPT</strong> initially assigns<br />
a status of DARK GREEN to J48, where there is sufficient<br />
space to accommodate weather-avoiding maneuvers. J75,<br />
which passes through the gap between the cells, is marked<br />
YELLOW. Observed traffic appears to confirm the accuracy<br />
of the guidance. As the cells grow, the maneuvering room on<br />
J48 is decreased, turning its status YELLOW, and the gap<br />
between the cells closes, turning J75 RED. Observed traffic<br />
validates the <strong>RAPT</strong> guidance; although a flight is passing<br />
through the remaining gap on J75, the next departure is<br />
beginning to circle and hold, potentially disrupting departure<br />
traffic on several routes.<br />
<strong>RAPT</strong> at 2330Z (14 August) Traffic and Weather at 0000Z (15 August)<br />
J60<br />
J80<br />
J95<br />
J36<br />
J6<br />
J48<br />
J75<br />
NY departures NY arrivals<br />
PHL departures PHL arrivals<br />
DC, BOS traffic<br />
Figure 4. Illustration of <strong>RAPT</strong> guidance, compared to observed departure traffic. Overall, <strong>RAPT</strong> guidance appears to match<br />
departure operations well.<br />
J48 traffic<br />
Traffic at 1421Z<br />
J75 traffic<br />
23 July, 2008<br />
J48, J75 traffic<br />
(2 as 1)<br />
Traffic at 1457Z<br />
J75 traffic<br />
<strong>RAPT</strong> at 1415Z<br />
<strong>RAPT</strong> at 1445Z<br />
Figure 5. Illustration of <strong>RAPT</strong> guidance on growing isolated cells. As cells grow larger and stronger, closing down available<br />
maneuvering space, <strong>RAPT</strong> guidance deteriorates (from GREEN to YELLOW to RED), reflecting decreases in departure traffic.<br />
Note departures beginning t o hold on the illustration at right.<br />
VIL
<strong>RAPT</strong> over-warned in circumstances where its route<br />
blockage model failed to capture the full range of operational<br />
flexibility in vectoring aircraft around weather. Figure 6 shows<br />
traffic in far en route airspace deviating far outside the <strong>RAPT</strong><br />
route boundary to avoid convective weather. In figure 7, four<br />
different traffic streams are merged in the TRACON to avoid<br />
intense convection before splitting onto different airways in en<br />
route airspace. Departure status on all four routes is RED.<br />
Traffic at 2215Z (23 July, 2008)<br />
J79<br />
J174<br />
Deviating J174 traffic<br />
<strong>RAPT</strong> at 2145Z<br />
Figure 6. <strong>RAPT</strong> over-warning in far en route airspace, where<br />
aircraft have significant room to deviate to avoid weather.<br />
Traffic from 2015Z to 2045Z<br />
Merged departure<br />
streams<br />
NY departures<br />
NY arrivals<br />
<strong>RAPT</strong> at 2030Z<br />
Figure 7. <strong>RAPT</strong> over-warning near TRACON boundary.<br />
TRACON air traffic control has considerable flexibility in<br />
vectoring aircraft to avoid weather. In this example, several<br />
departure streams are merged into a single stream to avoid<br />
weather impacts on the nominal departure routes.<br />
In order to gain a more comprehensive view of <strong>RAPT</strong><br />
performance, day-long summaries of <strong>RAPT</strong> guidance and<br />
departure traffic were analyzed for four SWAP days (20 July,<br />
23 July, 10 August and 15 August). Figure 8 shows the history<br />
of <strong>RAPT</strong> departure status and departure counts through the<br />
BIGGY departure fix onto airway J75 for 10 August, 2008.<br />
Departures stop around 1430Z, as weather impacts turn the<br />
<strong>RAPT</strong> guidance RED. Departures begin in earnest around<br />
1830Z, during a prolonged period of <strong>RAPT</strong> YELLOW,<br />
stopping again around 2100Z, when <strong>RAPT</strong> guidance turns<br />
RED. Finally, a steady stream of departures begins around<br />
2200Z as <strong>RAPT</strong> guidance turns YELLOW, and continues as<br />
<strong>RAPT</strong> turns GREEN around 2330Z. This correlation between<br />
<strong>RAPT</strong> guidance and departures was observed on several<br />
departure routes during the four case days.<br />
Departures<br />
(5 minute bin)<br />
4<br />
3<br />
2<br />
1<br />
0<br />
<strong>RAPT</strong> timelines for<br />
LGA-BIGGY-J75 departures<br />
Departures counts through BIGGY fix onto J75<br />
10 August 2008<br />
8 10 12 14 16 18 20 22 24<br />
Time (GMT)<br />
Figure 8. Day-long summary of departures through departure<br />
fix BIGGY onto airway J75 (upper panel). Lower panel shows<br />
<strong>RAPT</strong> timelines, as they were updated every five minutes<br />
during the day. Timelines are turned ‘sideways’; departure<br />
time T0 is at the top and departure times increase (T0+5,<br />
T0+10, etc.) as one moves downward.<br />
Figure 9 presents the cumulative departures from Newark<br />
International Airport (EWR) onto all <strong>RAPT</strong> departure routes<br />
for a fair weather day (20 August, 2008) and for the SWAP<br />
day on 10 August. <strong>The</strong> fair weather curve is colored sky blue;<br />
the curve for 10 August is colored by the average value of the<br />
status for all <strong>RAPT</strong> routes. During the period of highest<br />
weather impacts (reds, oranges and yellows between 1600 and<br />
2100Z), the departure rate for all EWR <strong>RAPT</strong> routes falls far<br />
short of fair weather operations and the departure backlog (the<br />
difference between the fair weather and weather-impacted<br />
curves) increases significantly. Departure rates begin to<br />
approach fair weather norms after 2200Z, when the <strong>RAPT</strong><br />
status turns green. <strong>RAPT</strong> accurately identifies both the onset<br />
and clearing of severe convective weather impacts, providing<br />
the information needed to support proactive decision making.<br />
Impact trends (improving and deteriorating conditions) are<br />
also apparent.
500<br />
400<br />
300<br />
200<br />
100<br />
Cumulative departures from Newark Int’l Airport<br />
Fair weather<br />
(20 August, 2008)<br />
0<br />
8 10 12 14 16 18 20 22 24<br />
Time (GMT)<br />
SWAP<br />
(10 August, 2008)<br />
Figure 9. Comparison of cumulative departure from Newark<br />
International Airport (EWR) on fair weather day (blue) with a<br />
day with significant convective impacts (colors). Impacted<br />
colors indicated average <strong>RAPT</strong> blockage status of all <strong>RAPT</strong><br />
departure routes for EWR.<br />
Figure 10 summarizes the correlation between <strong>RAPT</strong><br />
guidance and departure traffic for the three major New York<br />
airports for the four case days (three days for JFK). <strong>The</strong> figure<br />
shows histograms of departure counts per half-hour on all<br />
routes with blockage status RED, YELLOW, DARK GREEN,<br />
GREEN (excluding PIGs) and PIGs, normalized to the total<br />
number of half-hour periods of each route status (given in the<br />
number at the top of each distribution on the figure). <strong>The</strong> route<br />
status for a half-hour period was defined as the median<br />
departure status for that period. For example, to determine the<br />
status for departures from EWR through departure fix COATE<br />
onto airway J36 for the period from 1830Z to 1900Z, the route<br />
status for each minute (1830, 1831, 1832, …, 1859) in the<br />
interval are considered. If there were 3 GREEN, 4 DARK<br />
GREEN, 14 YELLOW and 9 RED, the median status for the<br />
half-hour block was YELLOW. <strong>The</strong> departure count for the<br />
period is simply the total number of departures on the route<br />
during the half-hour, determined using flight plan data from<br />
the Enhanced Traffic Management System (ETMS).<br />
For this statistical analysis, the definition of PIGs is<br />
somewhat different than that used in the detailed study of<br />
operations presented in [1]. Here, a PIG is defined as a<br />
GREEN status that follows a RED status (either directly or<br />
after some intervening period of YELLOW), where both the<br />
GREEN and RED status are determined from the half-hour<br />
median described in the previous paragraph. <strong>The</strong> differences<br />
are warranted by the requirements of the different analyses<br />
(coarse-grained statistical validation vs. fine-grained analysis<br />
of individual departure release decisions). In practice, both<br />
methods identified a similar set of PIGs.<br />
<strong>RAPT</strong> guidance correlates well with operational<br />
performance. No departures were released during 80% of all<br />
RED conditions observed on those four days; departure rates<br />
of two or more per half-hour were observed during only 10%<br />
of all RED conditions. <strong>The</strong> percentage of periods with higher<br />
departure rates – 2 or more per half-hour - steadily increases<br />
as conditions improve from RED (10%) to YELLOW (23%)<br />
to DARK GREEN (31%) to GREEN (37%).<br />
Normalized departure releases (per half-hour)<br />
partitioned by <strong>RAPT</strong> guidance<br />
(EWR, LGA, JFK airports, 4 SWAP days in 2008)<br />
Figure 10. Distributions of departure counts per half-hour as a<br />
function of <strong>RAPT</strong> status. Numbers at the top of each<br />
distribution give the total number of half-hour periods with the<br />
route status for which the distribution is calculated.<br />
A comparison of departure rates during non-PIG GREENs<br />
and PIGs shows that departure rates during PIGs are generally<br />
lower than during non-PIG GREEN operations. Departure<br />
counts of 2 or more flights were observed during<br />
approximately 37% of all GREEN periods, and only 25% of all<br />
PIGs. This result is not surprising – in fact, it is the one of the<br />
primary motivations for <strong>RAPT</strong>. Increasing departure rates<br />
during PIGs is a critical need of departure management during<br />
SWAP. After significant weather impacts clear, departure<br />
backlogs must be cleared as quickly as possible to avoid<br />
surface gridlock conditions that can cause disruption of air<br />
traffic to spread through the NAS. However, planning and<br />
staging the resumption of high volume operations after weather<br />
impacts pass can be difficult, and improving departure<br />
throughput by early identification of opportunities to reopen<br />
closed departure route is a major element of the <strong>RAPT</strong> concept<br />
of operations. A recent study [1] analyzed post-impact<br />
operations during the summer of 2008 in New York in detail,<br />
and found significant opportunities to improve departure<br />
throughput during PIGs that were clearly identified by <strong>RAPT</strong>.<br />
IV. PLANNED ENHANCEMENTS<br />
Post-event analysis of <strong>RAPT</strong> performance has<br />
demonstrated that <strong>RAPT</strong> guidance correlates well with<br />
operational reality. <strong>RAPT</strong> predictions of the onset and clearing<br />
of weather impacts (REDs, GREENs and Post-impact<br />
GREENS (PIGs)) provide useful information to air traffic<br />
managers that can support more proactive and consistent<br />
decision making. However, discussions with operational users<br />
suggest that <strong>RAPT</strong> usage would improve if <strong>RAPT</strong> provided<br />
explicit information about weather impact trends (particularly
during YELLOW periods), real time <strong>RAPT</strong> forecast scores<br />
and more clarity in the operational display.<br />
Figure 11 illustrates these enhancements on the planned<br />
2009 user interface, developed in discussions during a user<br />
focus group meeting in December, 2008. Weather impact<br />
trends for each departure route are identified as ‘improving’<br />
(upward arrow), ‘deteriorating’ (downward arrow) or ‘stable’<br />
(right-pointing arrow). Trends are based on the history of<br />
impacts over the previous half-hour. A ‘PIG timer’ gives the<br />
time, in minutes, since the weather impacts have cleared the<br />
route. Users can ‘drill down’ to see detailed trend information<br />
by clicking on the trend arrow. <strong>The</strong> trend information includes<br />
the previous 30 minute history of <strong>RAPT</strong> status and echo top<br />
EWR ELIOT J64 drilldown<br />
50<br />
Past 30 minute <strong>RAPT</strong> status trend<br />
40<br />
(height reflects echo top)<br />
30<br />
ConOps: Release Under Guidance<br />
CLOSE<br />
heights encountered along the departure route, and a text<br />
message that reminds the user of the action that is suggested<br />
by the <strong>RAPT</strong> concept of operations under the current<br />
conditions. An improved route timeline display filter enables<br />
users to display only the departure routes that are of interest.<br />
<strong>RAPT</strong> forecast scores, based on the route blockage scoring<br />
algorithm presented in [10], are calculated for each of the<br />
regions that include the major departure routes in the <strong>RAPT</strong><br />
domain. <strong>The</strong> blockage score takes into account the spatial scale<br />
and orientation of the routes and their geometric relationship to<br />
the weather. Both the trend and forecast algorithms are subjects<br />
of ongoing research and development.<br />
<strong>Route</strong> trend PIG 0610 0615 0620 0625 0630 0635 0640<br />
20<br />
Click on cell to see<br />
trend ‘drilldown’<br />
Timeline display filter allows user to focus only on specific routes of interest<br />
Figure 11. Proposed <strong>RAPT</strong> user interface for 2009.<br />
V. CONCLUSIONS<br />
<strong>The</strong> <strong>Route</strong> <strong>Availability</strong> <strong>Planning</strong> <strong>Tool</strong> (<strong>RAPT</strong>) is a<br />
prototype automated decision support tool that has been<br />
deployed in the New York area to help air traffic managers<br />
make departure decisions in convective weather SWAP. It<br />
predicts the impacts of convective weather on departure<br />
routes, providing a departure status (RED is blocked, GREEN<br />
is clear, DARK GREEN is insignificant impact and YELLOW<br />
is partially blocked or uncertain) for future departure times (up<br />
to 30 minutes) on specific departure routes. <strong>The</strong> <strong>RAPT</strong><br />
concept of operations is to enable proactive departure<br />
management decision making based on <strong>RAPT</strong> departure status<br />
predictions: plan reroutes for departure routes that are turning<br />
RED, reopen closed departure routes that are turning GREEN<br />
<strong>RAPT</strong> fc score<br />
North: 80%<br />
West: 60%<br />
South: 20%<br />
<strong>RAPT</strong> forecast<br />
score by<br />
departure group<br />
after weather impacts, and use trend information to support<br />
advanced planning when route impacts are YELLOW.<br />
<strong>The</strong> effectiveness of <strong>RAPT</strong> depends on the quality of its<br />
departure status predictions, which are based upon forecasts of<br />
precipitation intensity and echo top height, and an operational<br />
model that defines departure routes and route blockage. <strong>The</strong><br />
operational accuracy of <strong>RAPT</strong> guidance was evaluated over<br />
several convective weather SWAP days in the summer of<br />
2008. <strong>The</strong> evaluation was based on detailed analysis of<br />
observed departure traffic and <strong>RAPT</strong> guidance during several<br />
storm impacts, comprehensive timelines of weather impacts<br />
and departure counts on individual routes and complete<br />
airports, and a comparison of aggregate departure statistics<br />
over the four SWAP days studied, partitioned by <strong>RAPT</strong>
guidance (RED, YELLOW, DARK GREEN, GREEN<br />
(excluding Post-impact GREEN), post-impact GREEN (PIG)).<br />
<strong>RAPT</strong> guidance correlated well with observed departure<br />
rates on the four SWAP days studied. On RED routes,<br />
departures were completely shut down approximately 80% of<br />
the time, and rates greater than one departure per half-hour<br />
were observed only 10% of the time. Departure rates increased<br />
as <strong>RAPT</strong> status improved from RED to GREEN (excluding<br />
PIGs). Departure rates on PIG routes were generally lower<br />
than rates on GREEN (excluding PIGs) routes. A primary goal<br />
of <strong>RAPT</strong> is to improve departure throughput during these<br />
critical, post impact recovery periods, by helping air traffic<br />
managers to identify opportunities to plan, stage and execute<br />
the timely reopening of departure routes closed by convective<br />
weather impacts. <strong>RAPT</strong> identification of PIGs and trends<br />
leading to PIGs is sufficiently robust to support this goal.<br />
Several enhancements will be deployed in 2009 to improve<br />
the effectiveness of <strong>RAPT</strong>. Explicit identification of weather<br />
impact trends (improving, deteriorating or stable) will provide<br />
additional guidance to help air traffic managers begin planning<br />
traffic management initiatives (route reopening, proactive<br />
reroutes, etc.) in response to changing weather impacts.<br />
Improved <strong>RAPT</strong> timeline display filtering will allow users to<br />
focus only on the specific routes of interest at any given time.<br />
An explicit <strong>RAPT</strong> forecast score will enable traffic managers<br />
to evaluate the quality of <strong>RAPT</strong> guidance and manage risks<br />
associated with <strong>RAPT</strong>-based decisions. Finally, <strong>RAPT</strong><br />
guidance will be explicitly tied to specific operational actions<br />
suggested in the concept of operations.<br />
[1]<br />
REFERENCES<br />
Michael Robinson, Rich DeLaura and Ngaire Underhill, “<strong>The</strong><br />
operational effectiveness of the <strong>Route</strong> <strong>Availability</strong> <strong>Planning</strong> <strong>Tool</strong><br />
(<strong>RAPT</strong>) during the 2008 convective season,” unpublished.<br />
[2] Shawn Allan, S. G. Gaddy, J. E. Evans, “Delay causality and reduction<br />
at New York airports using terminal weather information systems,”<br />
Project Report ATC-291, <strong>MIT</strong> <strong>Lincoln</strong> <strong>Laboratory</strong>, 2001.<br />
[3] New York Aviation Rulemaking Committee Report,<br />
[4]<br />
http://www.faa.gov/library/reports/media/NY%20ARC%20Final%20Re<br />
port.pdf, 13 December, 2007.<br />
Michael Robinson, Rich DeLaura, James Evans and Starr McGettigan,<br />
“Operational usage of the <strong>Route</strong> <strong>Availability</strong> <strong>Planning</strong> <strong>Tool</strong> during the<br />
2007 convective weather season,” American Meteorological Society<br />
13th Conference on Aviation, Range and Aerospace Meteorology, 2008.<br />
[5] Rich DeLaura and Shawn Allan, “<strong>Route</strong> selection decision support in<br />
convective weather: case study of the effects of weather and operational<br />
assumptions on departure throughput”, 5th Eurocontrol/FAA ATM R&D<br />
Seminar, 2003.<br />
[6] Rich DeLaura, Michael Robinson, Russell Todd and Kirk MacKenzie,<br />
“Evaluation of weather impact models in departure management<br />
decision support: operational performance of the <strong>Route</strong> <strong>Availability</strong><br />
<strong>Planning</strong> <strong>Tool</strong> (<strong>RAPT</strong>) prototype,” American Meteorological Society<br />
13th Conference on Aviation, Range and Aerospace Meteorology, 2008.<br />
[7] M. Robinson, J. Evans, B. Crowe, D. Klingle-Wilson and S. Allan,<br />
2004, “Corridor Integrated Weather System operational benefits 2002-<br />
2003: initial estimates of convective weather delay reduction”, <strong>MIT</strong><br />
<strong>Lincoln</strong> <strong>Laboratory</strong> Project Report ATC-313.<br />
[8] Rich DeLaura and James Evans, “An exploratory study of modeling<br />
enroute pilot convective storm flight deviation behavior,” American<br />
Meteorological Society 12th Conference on Aviation, Range and<br />
Aerospace Meteorology, 2008.<br />
[9] Brian D. Martin, “Model estimates of traffic reduction in storm impacted<br />
en route airspace,” American Institute of Aeronautics and Astronautics<br />
7th Aviation Technology, Integration and Operations, 2007.<br />
[10] Michael P. Matthews, Marilyn Wolfson, Richard A. DeLaura, James E.<br />
Evans and Colleen K. Reiche, “Measuring the uncertainty of weather<br />
forecasts specific to air traffic management operations,” American<br />
Meteorological Society Special Symposium on Weather – Air Traffic<br />
Integration, 2009.<br />
AUTHOR BIOGRAPHY<br />
Rich DeLaura is a staff scientist at <strong>MIT</strong> <strong>Lincoln</strong> <strong>Laboratory</strong> in Lexington,<br />
MA. He holds an A.B degree in chemistry and physics from Harvard<br />
University in Cambridge, MA (1977). He has struggled mightily over the past<br />
decade to unravel the mysteries of pilot decision-making in convective<br />
weather, the impacts of convective weather on both en route and terminal area<br />
operations, and effective, weather-aware decision support for air traffic<br />
management.<br />
Michael Robinson received his B.S. and M.S. degrees in meteorology from<br />
the State University of New York, College at Oswego and Texas A&M<br />
University, respectively.<br />
He is a staff member at <strong>MIT</strong> <strong>Lincoln</strong> <strong>Laboratory</strong>. He is involved in research<br />
efforts to quantify the operational benefits of weather-ATM systems. He has<br />
led several field studies investigating the operational utility of convective<br />
weather decision support tools at air traffic management facilities. He is also<br />
investigating improved training techniques for weather-ATM systems.<br />
Ngaire Underhill received her B.A. in Computer Science and Economics<br />
from Smith College. She is a staff member at <strong>MIT</strong> <strong>Lincoln</strong> <strong>Laboratory</strong>,<br />
working to develop statistical analyses of the correlations between weather<br />
and commercial airline departures for the development and evaluation of<br />
decision support tools.