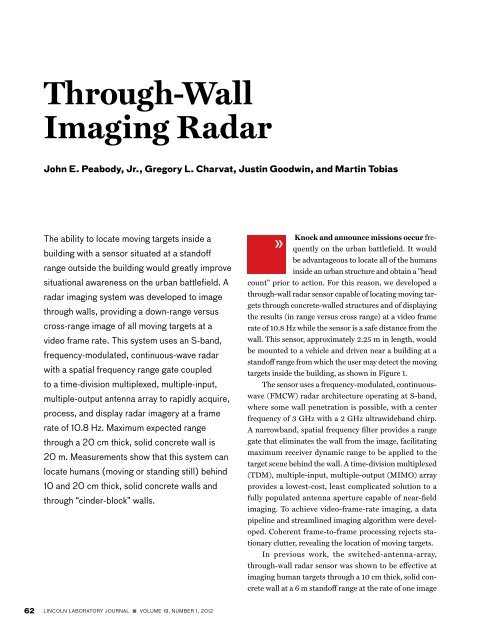
Through-Wall Imaging Radar - MIT Lincoln Laboratory
Through-Wall Imaging Radar - MIT Lincoln Laboratory
Through-Wall Imaging Radar - MIT Lincoln Laboratory

Create successful ePaper yourself
Turn your PDF publications into a flip-book with our unique Google optimized e-Paper software.
<strong>Through</strong>-<strong>Wall</strong><br />
<strong>Imaging</strong> <strong>Radar</strong><br />
John E. Peabody, Jr., Gregory L. Charvat, Justin Goodwin, and Martin Tobias<br />
The ability to locate moving targets inside a<br />
building with a sensor situated at a standoff<br />
range outside the building would greatly improve<br />
situational awareness on the urban battlefield. A<br />
radar imaging system was developed to image<br />
through walls, providing a down-range versus<br />
cross-range image of all moving targets at a<br />
video frame rate. This system uses an S-band,<br />
frequency-modulated, continuous-wave radar<br />
with a spatial frequency range gate coupled<br />
to a time-division multiplexed, multiple-input,<br />
multiple-output antenna array to rapidly acquire,<br />
process, and display radar imagery at a frame<br />
rate of 10.8 Hz. Maximum expected range<br />
through a 20 cm thick, solid concrete wall is<br />
20 m. Measurements show that this system can<br />
locate humans (moving or standing still) behind<br />
10 and 20 cm thick, solid concrete walls and<br />
through “cinder-block” walls.<br />
62 LINCOLN LABORATORY JOURNAL n VOLUME 19, NUMBER 1, 2012<br />
»<br />
Knock and announce missions occur frequently<br />
on the urban battlefield. It would<br />
be advantageous to locate all of the humans<br />
inside an urban structure and obtain a "head<br />
count" prior to action. For this reason, we developed a<br />
through-wall radar sensor capable of locating moving targets<br />
through concrete-walled structures and of displaying<br />
the results (in range versus cross range) at a video frame<br />
rate of 10.8 Hz while the sensor is a safe distance from the<br />
wall. This sensor, approximately 2.25 m in length, would<br />
be mounted to a vehicle and driven near a building at a<br />
standoff range from which the user may detect the moving<br />
targets inside the building, as shown in Figure 1.<br />
The sensor uses a frequency-modulated, continuouswave<br />
(FMCW) radar architecture operating at S-band,<br />
where some wall penetration is possible, with a center<br />
frequency of 3 GHz with a 2 GHz ultrawideband chirp.<br />
A narrowband, spatial frequency filter provides a range<br />
gate that eliminates the wall from the image, facilitating<br />
maximum receiver dynamic range to be applied to the<br />
target scene behind the wall. A time-division multiplexed<br />
(TDM), multiple-input, multiple-output (MIMO) array<br />
provides a lowest-cost, least complicated solution to a<br />
fully populated antenna aperture capable of near-field<br />
imaging. To achieve video-frame-rate imaging, a data<br />
pipeline and streamlined imaging algorithm were developed.<br />
Coherent frame-to-frame processing rejects stationary<br />
clutter, revealing the location of moving targets.<br />
In previous work, the switched-antenna-array,<br />
through-wall radar sensor was shown to be effective at<br />
imaging human targets through a 10 cm thick, solid concrete<br />
wall at a 6 m standoff range at the rate of one image
every 1.9 seconds [1, 2]. The imaging algorithm is a realtime<br />
implementation of the range migration algorithm<br />
(RMA) synthetic aperture radar (SAR) imaging algorithm<br />
based on work from a high-speed imaging architecture<br />
originally developed for real-time interferometric synthetic<br />
aperture microscopy [3].<br />
For the system shown in this article, the maximum<br />
range when imaging through a 20 cm thick, solid concrete<br />
wall is estimated to be 20 m. Free-space measurements<br />
will show that this system is capable of resolving rapidly<br />
moving human targets and low radar-cross-section (RCS)<br />
targets. <strong>Through</strong>-wall measurements will show that this<br />
system is capable of locating human targets that are either<br />
moving or standing still behind 10 cm and 20 cm thick,<br />
solid concrete walls and through cinder-block walls at a<br />
standoff range approximately 6 m from the wall and 10 m<br />
from the targets. Preliminary detection work demonstrates<br />
the feasibility of plotting detections and providing a head<br />
count in real time rather than displaying raw SAR imagery.<br />
Future work will include testing on an adobe structure and<br />
actual random buildings with diverse target scenes.<br />
system description<br />
The radar system can be described in four parts: the hardware,<br />
the antenna array, the imaging algorithm, and the<br />
data acquisition and graphical user interface (GUI). Photographs<br />
of the radar system are shown in Figure 2.<br />
<strong>Radar</strong> System<br />
The core of this system is a range-gated FMCW radar<br />
device that transmits linear frequency-modulated (LFM)<br />
chirps from 2–4 GHz in 1 ms with 1 W peak transmit<br />
John E. PEabody, Jr., GrEGory L. CharvaT, JusTin Goodwin, and MarTin Tobias<br />
FiGurE 1. The through-wall radar sensor would be<br />
mounted on a vehicle and would operate at standoff ranges,<br />
providing range and cross-range position of moving targets<br />
within an urban structure.<br />
power at 50% duty cycle. Figure 3 shows the transmit<br />
and receive ports are fed to fan-out switch matrices con-<br />
nected to the array elements. This radar architecture<br />
implements a range gate by using a high-Q intermediatefrequency<br />
(IF) filter FL1 [4]. This filter band-limits the<br />
decorrelated LFM prior to pulse compression, resulting<br />
in an effective range gate of the target by rejecting scattered<br />
returns from the air-wall boundary, thereby providing<br />
a spatial frequency range gate. This design provides<br />
maximum dynamic range and sensitivity for imaging<br />
targets behind a wall [5, 6].<br />
Antenna Array<br />
The antenna array is shown in Figure 2a. The transmit<br />
port of the FMCW radar is connected to a fan-out<br />
switch matrix made up of switches SW1–3 (shown in Fig-<br />
(a) (b)<br />
FiGurE 2. Photographs of the through-wall radar imaging system show (a) the antenna elements on the front of the system,<br />
and (b) the transmitter, receiver, power supplies, diagnostic oscilloscope, and computer on the back.<br />
VOLUME 19, NUMBER 1, 2012 n LINCOLN LABORATORY JOURNAL 63
ThrouGh-waLL iMaGinG radar<br />
OSC1<br />
Ramp<br />
generator<br />
Video<br />
amplifier<br />
MXR3<br />
FL1<br />
AMP1<br />
ADC FIFO<br />
Trig<br />
Digital control<br />
FiGurE 3. The radar block diagram depicts the range-gated, frequency-modulated,<br />
continuous-wave (FMCW) system, which facilitates through-wall imaging, connected<br />
to receive and transmit fan-out switch matrices that feed all antenna array elements.<br />
ure 3) where the transmit port is fed to only one antenna<br />
element (ANT9–21) at a time. Similarly, the receive<br />
port of the radar system is connected to an eight-port<br />
switch (SW4) that connects to one low-noise amplifier<br />
(LNA1–8) at a time. Each LNA is connected to and physically<br />
mounted to a receiver element (ANT1–8) to preserve<br />
the noise figure through feed line and system losses.<br />
The antenna element (the top layer is shown in Figure<br />
4) is based on a combination of a Vivaldi and linear<br />
tapered-slot design and is capable of supporting at least<br />
2–4 GHz of bandwidth with efficient radiation and useful<br />
E and H plane beamwidths.<br />
The radar uses only a subset of all possible antenna<br />
combinations, which consist of 44 bistatic antenna<br />
element combinations whose effective phase centers<br />
approximate a linear array evenly spaced λ/2 [2]. These<br />
64 LINCOLN LABORATORY JOURNAL n VOLUME 19, NUMBER 1, 2012<br />
PA1<br />
MXR1 LNA9<br />
Beamforming<br />
and processing<br />
computer<br />
COTS PC<br />
MXR2<br />
OSC2<br />
SW1<br />
SW4<br />
SW2<br />
SW3<br />
LNA1<br />
LNA2<br />
LNA3<br />
LNA4<br />
LNA5<br />
LNA6<br />
LNA7<br />
LNA8<br />
ANT9<br />
ANT10<br />
ANT11<br />
ANT12<br />
ANT13<br />
ANT14<br />
ANT15<br />
ANT16<br />
ANT17<br />
ANT18<br />
ANT19<br />
ANT20<br />
ANT21<br />
ANT1<br />
ANT2<br />
ANT3<br />
ANT4<br />
ANT5<br />
ANT6<br />
ANT7<br />
ANT8<br />
bistatic antenna combinations are shown in Figure 5;<br />
the large circles represent ANT1–21, the lines represent<br />
the bistatic baselines, and the small circles represent the<br />
effective phase centers.<br />
FiGurE 4. A single hybrid antenna using a combination of<br />
a Vivaldi and linear slot design is shown. An array of these<br />
populates the through-wall radar system.
5.75<br />
5.75<br />
8<br />
All antenna switches (SW1–4) are solid state and dig-<br />
itally controlled by the data-acquisition computer. The<br />
TDM MIMO radar system sequences through each of<br />
the 44 bistatic combinations, acquiring one range profile<br />
at each. The computer controls the switches, pulses the<br />
transmitter, and digitizes the video; executes these tasks<br />
in a continuous loop; and simultaneously computes and<br />
displays a SAR image at a rate of 10.8 Hz.<br />
<strong>Imaging</strong> Algorithm<br />
This radar resolves targets by using the RMA, which is a<br />
near-field SAR imaging algorithm [7]. Processing a single<br />
image with the RMA is computationally expensive. A<br />
careful implementation of the RMA was developed so that<br />
values are precomputed and preorganized in the memory<br />
whenever possible. A real-time beamforming algorithm in<br />
Data acquisition system<br />
GUI<br />
Data<br />
display<br />
System<br />
control<br />
External routing<br />
Internal routing<br />
John E. PEabody, Jr., GrEGory L. CharvaT, JusTin Goodwin, and MarTin Tobias<br />
12 4 20 4 20 4 20 4 8 Receive elements<br />
2<br />
Data<br />
processing<br />
algorithms<br />
Analog<br />
output<br />
86<br />
96<br />
a C++ class was designed to execute a high-speed, hardware-optimized<br />
RMA. A MATLAB executable (MEX)<br />
interface was designed to prototype the algorithm in a<br />
debug environment. This interface allows for continued<br />
development of processing routines. The combination of<br />
these streamlined processes provides real-time imaging<br />
at a rate of 10.8 Hz [5].<br />
Data Acquisition and Graphical User Interface<br />
The data-acquisition (DAQ) system acquires data from<br />
the radar and provides system control through a GUI that<br />
displays the processed data and establishes a pipeline to<br />
and from the data processing algorithms to facilitate realtime<br />
radar imaging frame rates. A block diagram of the<br />
DAQ system is shown in Figure 6. A screen shot of the<br />
GUI is shown in Figure 7 [5].<br />
Data ring buffers<br />
Analog input<br />
Sample clock<br />
generator<br />
Recorded data<br />
storage<br />
Digital<br />
outputs<br />
44 Evenly spaced<br />
phase centers<br />
13 Evenly spaced<br />
transmit elements<br />
FiGurE 5. In this cartoon of the time-division multiplexed (TDM), multiple-input, multiple-output (MIMO) array layout<br />
[compare to Figure 2(a)](units in inches), large circles represent the antenna elements. The lines between the elements<br />
show the bistatic baselines, and the smaller circles indicate the location of each phase center. With this array,<br />
44 virtual elements can be synthesized with just 21 actual antenna elements.<br />
Input from<br />
video amplifier<br />
Output digital<br />
control to SW1–4<br />
Output to ramp<br />
generator<br />
FiGurE 6. The data acquisition (DAQ) system facilitates real-time imaging by using a high-speed data pipeline<br />
and real-time implementation of a synthetic aperture radar (SAR) imaging algorithm.<br />
VOLUME 19, NUMBER 1, 2012 n LINCOLN LABORATORY JOURNAL 65
ThrouGh-waLL iMaGinG radar<br />
system Model<br />
Upper Threshold<br />
Lower Threshold<br />
Image<br />
FiGurE 7. The graphical user interface has controls for starting the radar, imaging mode, output file<br />
name, record (on or off), record background, apply background, apply calibration, calibration input file<br />
name, load calibration, and dynamic range vernier sliders for both the upper and lower threshold.<br />
A thermal-noise-limited, maximum-range model was<br />
developed by inputting the antenna gain estimate and the<br />
array factor into the radar range equation [6]. Although<br />
this model only accounts for thermal-noise-limited performance,<br />
it shows the potential for this technology in a<br />
through-wall application.<br />
In this model, the two-way wall attenuation was<br />
accounted for as a loss factor. Range resolution was estimated<br />
for every pixel inside of the radar field of view,<br />
where the single-image, signal-to-noise ratio (SNR) was<br />
greater than 13.66 dB. Figure 8 illustrates the return<br />
intensities expected for a human target (0 dBsm) through<br />
a 20 cm thick, solid concrete wall with a two-way loss of<br />
90 dB [8]. On the basis of these calculations, the estimated<br />
maximum range is 20 m with a down-range resolution<br />
of 7.5 cm and a worst-case, cross-range resolution of<br />
45 cm. At ranges less than 20 m, cross-range resolution<br />
is better than 45 cm.<br />
results<br />
<strong>Radar</strong> imagery was acquired at an imaging rate of 10.8 Hz.<br />
The system was demonstrated on rapidly moving targets<br />
in free space, humans behind concrete walls, and humans<br />
standing still behind concrete walls.<br />
66 LINCOLN LABORATORY JOURNAL n VOLUME 19, NUMBER 1, 2012<br />
3<br />
33<br />
SAR Mode<br />
Cal Input File:<br />
CalPole<br />
Start<br />
Output Data File:<br />
Subject with metal pole<br />
Record<br />
Acq Background<br />
Apply Background<br />
Apply Cal<br />
Load Cal<br />
Free-Space Imagery<br />
To show that this radar is capable of imaging in a highclutter<br />
environment with rapid target movements, a person<br />
swinging a metal rod was imaged in front of the radar<br />
about 5 m away and centered with respect to the array<br />
in free space. Range gating and frame-to-frame coherent<br />
change detection were used to eliminate clutter. Each data<br />
set was coherently subtracted from the previous one. Continuous,<br />
coherent, change detection of the target scene<br />
Cross range (m)<br />
–6<br />
–4<br />
–2<br />
0<br />
2<br />
4<br />
6<br />
Rmax (m) versus azimuth angle<br />
5<br />
10 15<br />
Down range (m)<br />
FiGurE 8. Estimated maximum range for imaging through<br />
a 20.3 cm thick, solid concrete wall. The white line indicates<br />
the maximum detection range for a 0 dBsm target with an<br />
SNR greater than 13.66 dB.<br />
20<br />
0.4<br />
0.3<br />
0.2<br />
0.1<br />
Azimuth resolution (m)
FiGurE 9. The metal rod being rotated by a human is<br />
clearly visible in these images. The imagery is in range vs.<br />
cross range with 20 dB of dynamic range shown.<br />
John E. PEabody, Jr., GrEGory L. CharvaT, JusTin Goodwin, and MarTin Tobias<br />
clearly shows the range versus cross-range imagery of a<br />
human target and the specular reflection of the rotating<br />
metal rod without noticeable blurring (every other frame<br />
is shown in Figure 9).<br />
Coherent background subtraction was used to image<br />
a pair of metal spheres with diameters of 2.5 cm located<br />
approximately 4 m down range from the array. One sphere<br />
remains stationary and the other rolls past, as shown in<br />
Figure 10. Multipath scattering from the spheres is noticeable<br />
as one sphere passes close to the other. The RCS of<br />
a 2.54 cm diameter sphere at the radar center frequency<br />
of 3 GHz is approximately –29 dBsm. The clear radar<br />
images of the stationary and moving spheres demonstrate<br />
the sensitivity of this real-time radar sensor.<br />
FiGurE 10. Here, one 2.5 cm diameter metal sphere is<br />
rolled past another in real time. The imagery is in range vs.<br />
cross range with 20 dB of dynamic range shown.<br />
VOLUME 19, NUMBER 1, 2012 n LINCOLN LABORATORY JOURNAL 67
ThrouGh-waLL iMaGinG radar<br />
FiGurE 11. The "test range" for through-wall measurements<br />
shows the 10 cm and 20 cm thick, solid concrete<br />
walls on the left and the cinder-block wall on the right.<br />
<strong>Through</strong>-<strong>Wall</strong> Imagery<br />
<strong>Through</strong>-wall imagery of two humans behind three types<br />
of walls and in free space (for reference) were acquired.<br />
Although the radar acquires data in real time, only one<br />
image frame is shown for each result. The walls, shown<br />
in Figure 11, were purpose-built for radar testing and<br />
included 10 cm and 20 cm thick, solid concrete walls and<br />
a cinder-block wall. The through-wall imaging geometry<br />
is shown in Figure 12. The radar is approximately<br />
6 m standoff distance from the wall, and the humans are<br />
approximately 10 m from the radar behind the wall. The<br />
Approximately 10 m<br />
Approximately 6 m<br />
<strong>Wall</strong><br />
<strong>Radar</strong><br />
FiGurE 12. This cartoon of the geometry of the throughwall<br />
imaging measurements shows two individuals behind<br />
the barrier wall.<br />
68 LINCOLN LABORATORY JOURNAL n VOLUME 19, NUMBER 1, 2012<br />
reference image in Figure 13 shows what two humans<br />
look like on the radar screen without a wall present.<br />
Down-range sidelobes are as expected, and cross-range<br />
sidelobes are elevated.<br />
Two humans were imaged through 10 cm and 20 cm<br />
thick, solid concrete walls and a cinder-block wall (Figure<br />
14). In each scenario, the signal-to-clutter ratio is sufficiently<br />
large to facilitate detection.<br />
• Humans behind the 10 cm thick wall (Figure 14a)<br />
appear similar to humans in free space, and their<br />
locations are clearly shown with a good signal-toclutter<br />
ratio.<br />
• Humans behind the 20 cm (Figure 14b) thick wall<br />
have a significantly lower scattered return. There appears<br />
to be more clutter, which is likely receiver noise,<br />
but each human's location is clearly shown and their<br />
relative magnitudes are greater than 15 dB above the<br />
clutter floor.<br />
• Human images viewed through the cinder-block wall<br />
(Figure 14c) appear to be strong but so is the clutter.<br />
This result is likely due to the air gaps within the cinder<br />
blocks, which cause additional propagation-path<br />
distortion.<br />
In at least half of the experiments imaged in real time,<br />
the location of each human is clear relative to the clutter.<br />
With the application of detection and tracking algorithms,<br />
it should be possible to provide a reliable detection.<br />
Down range (cm)<br />
Final image dB<br />
–1200<br />
82<br />
–1100<br />
84<br />
–1000<br />
86<br />
–900<br />
–800<br />
–700<br />
–600<br />
–500<br />
–400<br />
–300<br />
–200<br />
88<br />
90<br />
92<br />
94<br />
96<br />
98<br />
100<br />
–600 –400 –200 0 200 400 600<br />
Cross range (cm)<br />
FiGurE 13. For reference purposes for the following<br />
through-wall experiments, this is an image of two humans in<br />
free space (no wall).
Down range (cm)<br />
Down range (cm)<br />
Down range (cm)<br />
Final image dB<br />
–1200<br />
82<br />
–1100<br />
84<br />
–1000<br />
86<br />
–900<br />
88<br />
–800<br />
90<br />
–700<br />
92<br />
–600<br />
94<br />
–500<br />
96<br />
–400<br />
–300<br />
–200<br />
98<br />
100<br />
–600 –400 –200 0 200 400 600<br />
Cross range (cm)<br />
–1200<br />
–1100<br />
–1000<br />
–900<br />
–800<br />
–700<br />
–600<br />
–500<br />
–400<br />
–300<br />
–1200<br />
–1100<br />
–1000<br />
–900<br />
–800<br />
–700<br />
–600<br />
–500<br />
–400<br />
–300<br />
–200<br />
–600 –400<br />
(a)<br />
Final image dB<br />
–200<br />
–600 –400 –200 0 200 400<br />
Cross range (cm)<br />
(b)<br />
Final image dB<br />
82<br />
84<br />
86<br />
88<br />
90<br />
92<br />
94<br />
96<br />
98<br />
100<br />
–200 0 200 400<br />
Cross range (cm)<br />
FiGurE 14. Two humans are imaged through a 10 cm thick,<br />
solid concrete wall (a), through a 20 cm thick, solid concrete<br />
wall (b), and through a cinder-block wall (c).<br />
John E. PEabody, Jr., GrEGory L. CharvaT, JusTin Goodwin, and MarTin Tobias<br />
600<br />
600<br />
82<br />
84<br />
86<br />
88<br />
90<br />
92<br />
94<br />
96<br />
98<br />
100<br />
Down range (cm)<br />
Down range (cm)<br />
Down range (cm)<br />
Final image dB<br />
–1200<br />
–1100<br />
–1000<br />
–900<br />
–800<br />
–700<br />
–600<br />
–500<br />
–400<br />
–300<br />
82<br />
84<br />
86<br />
88<br />
90<br />
92<br />
94<br />
96<br />
98<br />
–200<br />
100<br />
–600 –400 –200 0 200 400 600<br />
Cross range (cm)<br />
Final image dB<br />
–1200<br />
82<br />
–1100<br />
84<br />
–1000<br />
86<br />
–900<br />
88<br />
–800<br />
90<br />
–700<br />
92<br />
–600<br />
94<br />
–500<br />
96<br />
–400<br />
–300<br />
–200<br />
98<br />
100<br />
–600 –400 –200 0 200 400 600<br />
Cross range (cm)<br />
–1200<br />
–1100<br />
–1000<br />
–900<br />
–800<br />
–700<br />
–600<br />
–500<br />
–400<br />
–300<br />
–200<br />
–600 –400<br />
(c) (c)<br />
(a)<br />
(b)<br />
Final image dB<br />
82<br />
84<br />
86<br />
88<br />
90<br />
92<br />
94<br />
96<br />
98<br />
100<br />
–200 0 200 400<br />
Cross range (cm)<br />
600<br />
FiGurE 15. A single human standing still can still be easily<br />
detected behind a 10 cm, solid concrete wall (a), behind a 20<br />
cm, solid concrete wall (b), and behind a cinder-block wall (c).<br />
VOLUME 19, NUMBER 1, 2012 n LINCOLN LABORATORY JOURNAL 69
ThrouGh-waLL iMaGinG radar<br />
<strong>Wall</strong> type<br />
20 cm concrete<br />
Cinder block<br />
10 cm concrete<br />
Free space<br />
One walking<br />
Two walking<br />
<strong>Through</strong>-<strong>Wall</strong> Imagery of Humans Standing Still<br />
Even when standing still, a human could be detected<br />
through the concrete walls because the human body<br />
moves slightly when breathing and while trying to remain<br />
upright. Results for one human standing still behind<br />
10 cm and 20 cm thick, solid concrete walls and a cinderblock<br />
wall are shown in Figure 15. The location of the<br />
human behind the 10 cm thick, solid concrete wall was<br />
clearly observed (Figure 15a). Similarly, the location of the<br />
human target through the cinder-block wall was clearly<br />
visible (Figure 15c) with a slight increase in clutter, probably<br />
caused by air gaps within the blocks.<br />
To reveal the location of the human behind the 20 cm<br />
thick, solid concrete wall, the frame-to-frame, coherent,<br />
change-detection algorithm had to subtract from the<br />
tenth frame back. The person's location is clearly shown<br />
after this analysis was applied (Figure 15b). For cases<br />
in which there is a weak return, an adaptive, frame-toframe,<br />
coherent subtraction algorithm that can decide if<br />
it is necessary to coherently subtract from one to many<br />
frames back should be developed.<br />
Performance summary<br />
A number of through-wall scenarios were tested and<br />
compared to the same scenario in free space. Results are<br />
summarized in Table 1. Green, yellow, and red indicate<br />
that the target is detectable in the vast majority of image<br />
frames, approximately half of the image frames, or none<br />
of the image frames, respectively. This table shows that a<br />
human target is detectable in all scenarios in free space.<br />
When the radar images through a 10 cm thick, solid concrete<br />
wall, human targets can be located even if they are<br />
standing still and holding their breath but not while sitting<br />
still and holding their breath. In the case of the cinder-block<br />
wall, human targets can be detected if standing<br />
still and holding their breath but not sitting still and holding<br />
their breath. Detection and location are sometimes<br />
difficult when two humans are walking because of the<br />
70 LINCOLN LABORATORY JOURNAL n VOLUME 19, NUMBER 1, 2012<br />
Standing<br />
still<br />
Sitting<br />
still<br />
Standing<br />
still holding<br />
breath<br />
Sitting<br />
still holding<br />
breath<br />
elevated clutter induced by air gaps in the blocks. A marginal<br />
image also occurs when the human is sitting still.<br />
Behind the 20 cm thick, solid concrete wall, a human can<br />
be detected only if he/she is walking around. The same<br />
human can be detected sometimes when standing still,<br />
but not standing still and holding his/her breath.<br />
In summary, this radar sensor can locate human targets<br />
most of the time through 10 cm and 20 cm thick,<br />
solid concrete and cinder-block walls even if the people<br />
are standing still but not if they are sitting or holding<br />
their breath.<br />
detection algorithm<br />
Although radar imagery, as shown in this paper, may provide<br />
actionable information to a radar engineer, the field<br />
operator prefers to view discrete detections rather than<br />
blobs on a radar screen. A radar display that provides<br />
detections is valuable because it reduces the observer/<br />
analyst training time and generally simplifies decision<br />
making. The signal-to-clutter ratio and the point-spread<br />
function for most through-wall imagery shown here is<br />
sufficient to merit the application of a detection algorithm,<br />
with the objective of locating and counting the<br />
individual moving targets behind the wall.<br />
A clustering technique that combines detections in<br />
adjacent range and cross-range bins into a single human<br />
detection is used to detect the number of humans present<br />
in an image. The number of bins that are clustered is<br />
chosen to correspond to the approximate size expected<br />
from a radar return on a human.<br />
Figure 16a shows the radar image of a scene containing<br />
two people. Figure 16b shows the range and crossrange<br />
bins that exceeded our detection threshold, which<br />
we set to 15 dB below the peak SNR in the image. Figure<br />
16c shows the result of clustering the detections, using<br />
a + to mark the center of each human detection.<br />
In order to maintain an estimate of the number of<br />
humans in a scene over time, we are currently performing
Down range (cm)<br />
Down range (cm)<br />
Down range (cm)<br />
12<br />
11<br />
10<br />
9<br />
8<br />
7<br />
6<br />
5<br />
4<br />
3<br />
2<br />
–5<br />
12<br />
11<br />
10<br />
9<br />
8<br />
7<br />
6<br />
5<br />
4<br />
3<br />
2<br />
–5<br />
12<br />
11<br />
10<br />
9<br />
8<br />
7<br />
6<br />
5<br />
4<br />
3<br />
2<br />
–5<br />
0<br />
Cross range (cm)<br />
(a)<br />
0<br />
Cross range (cm)<br />
(b)<br />
0<br />
Cross range (cm)<br />
(c)<br />
FiGurE 16. The raw data of a through-wall scene containing<br />
two humans are shown in (a), when range and crossrange<br />
bins exceeding detection threshold are selected (b),<br />
and the result of clustering detections into individual detections,<br />
which are marked with a + (c).<br />
John E. PEabody, Jr., GrEGory L. CharvaT, JusTin Goodwin, and MarTin Tobias<br />
5<br />
5<br />
5<br />
–85<br />
–90<br />
–95<br />
–100<br />
–105<br />
–110<br />
–82<br />
–84<br />
–86<br />
–88<br />
–90<br />
–92<br />
–94<br />
–96<br />
–82<br />
–84<br />
–86<br />
–88<br />
–90<br />
–92<br />
–94<br />
–96<br />
RCS (dB)<br />
RCS (dB)<br />
RCS (dB)<br />
research on the Gaussian-mixture probability hypothesis<br />
density (GM-PHD) [9] filter to form tracks on the human<br />
detections. The GM-PHD will aid rejection of spurious<br />
detections caused by radar calibration error and falsealarm<br />
detections. The filter will provide a running estimate<br />
of the number of humans detected. Alternatively,<br />
an M of N type of detection scheme, whereby we average<br />
the number of detections found over a given number<br />
of radar images, may also provide an adequate estimate<br />
of the number of humans in the scene. This is currently<br />
under investigation.<br />
next steps<br />
The next steps are to test this system on an adobe mudbrick<br />
wall and to complete development of a detection<br />
algorithm. If these steps are successful, this radar will be<br />
tested on walls of an actual building. Results of those tests<br />
may lead to fielding a prototype. Other applications for<br />
which the through-wall system may be used include realtime<br />
radar imaging of natural phenomenon or high-speed<br />
radar cross-section measurements.<br />
acknowledgments<br />
The authors would like to acknowledge Tyler S. Ralston,<br />
a former <strong>Lincoln</strong> <strong>Laboratory</strong> staff member now at Lawrence<br />
Livermore National <strong>Laboratory</strong>, for developing the<br />
real-time imaging algorithm, John Sandora for developing<br />
the antenna element, and Chao Liu for helping set up<br />
the outdoor measurements. n<br />
VOLUME 19, NUMBER 1, 2012 n LINCOLN LABORATORY JOURNAL 71
ThrouGh-waLL iMaGinG radar<br />
references<br />
1. G.L. Charvat, “A Low-Power <strong>Radar</strong> <strong>Imaging</strong> System,” PhD<br />
dissertation, Department of Electrical and Computer Engineering,<br />
Michigan State University, East Lansing, Michigan,<br />
Aug. 2007.<br />
2. G.L. Charvat, L.C. Kempel, E.J. Rothwell, C. Coleman, and<br />
E.J. Mokole, “An Ultrawideband (UWB) Switched-Antenna-<br />
Array <strong>Radar</strong> <strong>Imaging</strong> System,” Proceedings of the IEEE<br />
International Symposium on Phased Array Systems and<br />
Technology, 2010.<br />
3. T.S. Ralston, D.L. Marks, P.S. Carney, and S.A. Boppart,<br />
“Real-Time Interferometric Synthetic Aperture Microscopy,”<br />
Optics Express, vol. 16, no. 4, pp. 2555–2569, 2008.<br />
4. G.L. Charvat, L.C. Kempel, E.J. Rothwell, C. Coleman, and<br />
E.L. Mokole, “A <strong>Through</strong>-Dielectric <strong>Radar</strong> <strong>Imaging</strong> System,”<br />
IEEE Transactions on Antennas and Propagation, vol. 58,<br />
no. 8, pp. 2594–2603, 2010.<br />
5. T.S. Ralston, G.L. Charvat, and J.E. Peabody, “Real-Time<br />
<strong>Through</strong>-<strong>Wall</strong> <strong>Imaging</strong> using an Ultrawideband Multiple-<br />
Input Multiple-Output (MIMO) Phased-Array <strong>Radar</strong> System,”<br />
Proceedings of the IEEE International Symposium on<br />
Phased Array Systems and Technology, pp. 551–558, 2010.<br />
6. G.L. Charvat, T.S. Ralston, and J.E. Peabody, “A <strong>Through</strong>-<br />
<strong>Wall</strong> Real-Time MIMO <strong>Radar</strong> Sensor for Use at Stand-off<br />
Ranges,” MSS Tri-Services <strong>Radar</strong> Symposium, Orlando,<br />
Florida, 2010.<br />
7. W.G. Carrara, R.S. Goodman, and R.M. Majewski, Spotlight<br />
Synthetic Aperture <strong>Radar</strong> Signal Processing Algorithms. Boston:<br />
Artech House, 1995.<br />
8. P.R. Hirschler-Marchand, “Penetration Losses in Construction<br />
Materials and Buildings,” <strong>MIT</strong> <strong>Lincoln</strong> <strong>Laboratory</strong> Project<br />
Report TR-ACC-1, Rev. 1, 19 July 2006.<br />
9. B.N. Vo and W.K. Ma, “The Gaussian Mixture Probability<br />
Hypothesis Density Filter,” IEEE Transactions on Signal Processing,<br />
vol. 54, no. 11, pp. 4091–4101, 2006.<br />
72 LINCOLN LABORATORY JOURNAL n VOLUME 19, NUMBER 1, 2012<br />
John Peabody Jr. is an assistant staff<br />
member in the Aerospace Sensor Technology<br />
Group. While attending Wentworth<br />
Institute of Technology, where he<br />
majored in computer engineering, Peabody<br />
accepted an intern position at <strong>Lincoln</strong><br />
<strong>Laboratory</strong> in the Aerospace Division. Upon<br />
graduation, he accepted a full-time position<br />
in the <strong>Laboratory</strong>. Peabody completed the Master of Science in<br />
Information Technology—Software Engineering distance-learning<br />
program from Carnegie Mellon University in 2011. He is currently<br />
the Massachusetts Affiliate Partner for the For Inspiration and Recognition<br />
of Science and Technology (FIRST) Tech Challenge.<br />
Gregory Charvat is currently the cofounder<br />
and research engineer at Butterfly<br />
Networks, Inc. In graduate school, Charvat<br />
developed rail SAR imaging sensors, a<br />
MIMO phased-array radar system, and an<br />
impulse radar. He holds a patent on a harmonic<br />
radar remote sensing system. While<br />
a member of the technical staff at <strong>Lincoln</strong><br />
<strong>Laboratory</strong>, he developed a MIMO through-wall radar system. He<br />
has also taught several short courses on radar at <strong>MIT</strong> and authored<br />
numerous articles in journals and IEEE proceedings. Charvat<br />
received his bachelor's and master's (in electrical engineering) and<br />
doctorate (in 2007) degrees from Michigan State University. He is<br />
a Senior Member of the IEEE. He served on the 2010 and will serve<br />
on the 2013 IEEE Symposia on Phased Array Systems and Technology<br />
steering committees and chaired the IEEE Antennas and Propagation<br />
Society Boston Chapter from 2010–2011.<br />
Justin Goodwin is a member of the<br />
technical staff at <strong>Lincoln</strong> <strong>Laboratory</strong>. Since<br />
joining the <strong>Laboratory</strong> in 2002, his focus<br />
has been on the development of algorithms<br />
and architectures to support ballistic missile<br />
defense sensors in the areas of tracking<br />
and discrimination. Goodwin received a<br />
bachelor's degree in mathematics from the<br />
University of Puget Sound, and bachelor's and master's degrees in<br />
systems science engineering from Washington University.<br />
Martin Tobias is a technical staff<br />
member in the Systems and Architectures<br />
Group. He received his bachelor's<br />
degree summa cum laude from Harvard<br />
University in 1999 and spent a few years<br />
working at Internet hardware startup<br />
companies. He joined <strong>Lincoln</strong> <strong>Laboratory</strong><br />
in 2006 after receiving his master's and<br />
doctorate degrees from the School of Electrical and Computer<br />
Engineering at the Georgia Institute of Technology, where his<br />
research focused on multitarget, multisensor tracking.