Earnings Surprises, Growth Expectations, and Stock Returns:
Earnings Surprises, Growth Expectations, and Stock Returns:
Earnings Surprises, Growth Expectations, and Stock Returns:

Create successful ePaper yourself
Turn your PDF publications into a flip-book with our unique Google optimized e-Paper software.
Abnormal Return<br />
0.2<br />
0.15<br />
0.1<br />
0.05<br />
0<br />
-0.07 -0.05 -0.03 -0.01 0.01 0.03 0.05 0.07<br />
-0.05<br />
-0.1<br />
-0.15<br />
-0.2<br />
Forecast Error<br />
GROWTH<br />
VALUE<br />
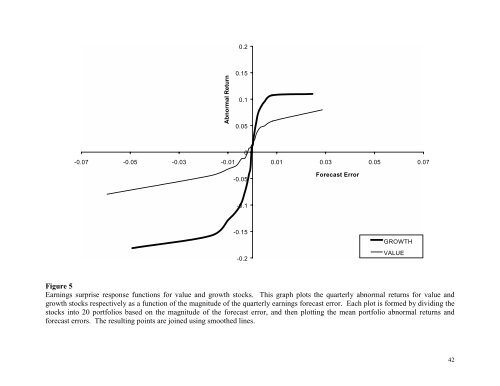
Figure 5<br />
<strong>Earnings</strong> surprise response functions for value <strong>and</strong> growth stocks. This graph plots the quarterly abnormal returns for value <strong>and</strong><br />
growth stocks respectively as a function of the magnitude of the quarterly earnings forecast error. Each plot is formed by dividing the<br />
stocks into 20 portfolios based on the magnitude of the forecast error, <strong>and</strong> then plotting the mean portfolio abnormal returns <strong>and</strong><br />
forecast errors. The resulting points are joined using smoothed lines.<br />
42