Earnings Surprises, Growth Expectations, and Stock Returns:
Earnings Surprises, Growth Expectations, and Stock Returns:
Earnings Surprises, Growth Expectations, and Stock Returns:

Create successful ePaper yourself
Turn your PDF publications into a flip-book with our unique Google optimized e-Paper software.
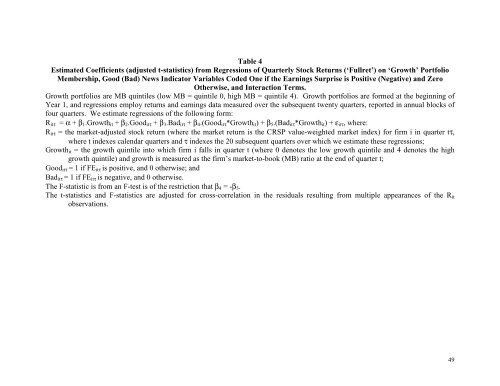
Table 4<br />
Estimated Coefficients (adjusted t-statistics) from Regressions of Quarterly <strong>Stock</strong> <strong>Returns</strong> (‘Fullret’) on ‘<strong>Growth</strong>’ Portfolio<br />
Membership, Good (Bad) News Indicator Variables Coded One if the <strong>Earnings</strong> Surprise is Positive (Negative) <strong>and</strong> Zero<br />
Otherwise, <strong>and</strong> Interaction Terms.<br />
<strong>Growth</strong> portfolios are MB quintiles (low MB = quintile 0, high MB = quintile 4). <strong>Growth</strong> portfolios are formed at the beginning of<br />
Year 1, <strong>and</strong> regressions employ returns <strong>and</strong> earnings data measured over the subsequent twenty quarters, reported in annual blocks of<br />
four quarters. We estimate regressions of the following form:<br />
Ritτ = α + β1.<strong>Growth</strong>it + β2.Gooditτ + β3.Baditτ + β4.(Gooditτ*<strong>Growth</strong>it) + β5.(Baditτ*<strong>Growth</strong>it) + εitτ, where:<br />
Ritτ = the market-adjusted stock return (where the market return is the CRSP value-weighted market index) for firm i in quarter tτ,<br />
where t indexes calendar quarters <strong>and</strong> τ indexes the 20 subsequent quarters over which we estimate these regressions;<br />
<strong>Growth</strong>it = the growth quintile into which firm i falls in quarter t (where 0 denotes the low growth quintile <strong>and</strong> 4 denotes the high<br />
growth quintile) <strong>and</strong> growth is measured as the firm’s market-to-book (MB) ratio at the end of quarter t;<br />
Gooditτ = 1 if FEitτ is positive, <strong>and</strong> 0 otherwise; <strong>and</strong><br />
Baditτ = 1 if FEitτ is negative, <strong>and</strong> 0 otherwise.<br />
The F-statistic is from an F-test is of the restriction that β4 = -β5.<br />
The t-statistics <strong>and</strong> F-statistics are adjusted for cross-correlation in the residuals resulting from multiple appearances of the Rit<br />
observations.<br />
49