TEXTURAL AND MICROANALYSIS OF IGNEOUS ROCKS: TOOLS ...
TEXTURAL AND MICROANALYSIS OF IGNEOUS ROCKS: TOOLS ...
TEXTURAL AND MICROANALYSIS OF IGNEOUS ROCKS: TOOLS ...

Create successful ePaper yourself
Turn your PDF publications into a flip-book with our unique Google optimized e-Paper software.
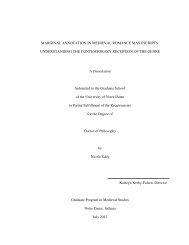
<strong>TEXTURAL</strong> <strong>AND</strong> <strong>MICROANALYSIS</strong> <strong>OF</strong> <strong>IGNEOUS</strong> <strong>ROCKS</strong>: <strong>TOOLS</strong> FOR<br />
UNDERST<strong>AND</strong>ING <strong>IGNEOUS</strong> PROCESSES<br />
A Dissertation<br />
Submitted to the Graduate School<br />
of the University of Notre Dame<br />
in Partial Fulfillment of the Requirements<br />
for the Degree of<br />
Doctor of Philosophy<br />
by<br />
William Scott Kinman, B.S.<br />
Clive R. Neal, Director<br />
Graduate Program in Civil Engineering and Geological Sciences<br />
Notre Dame, Indiana<br />
December 2006
This document is in the public domain.
<strong>TEXTURAL</strong> <strong>AND</strong> <strong>MICROANALYSIS</strong> <strong>OF</strong> <strong>IGNEOUS</strong> <strong>ROCKS</strong>: <strong>TOOLS</strong> FOR<br />
UNDERST<strong>AND</strong>ING <strong>IGNEOUS</strong> PROCESSES<br />
Abstract<br />
by<br />
William Scott Kinman<br />
Mantle characterization is vital for understanding magmatism. The notion<br />
that source characteristics are preserved transparently in primitive magmas from<br />
mantle to eruption can be misleading. The crust acts a cool density filter leading<br />
primitive magmas to pool, partially crystallize, and thus evolve. The details of<br />
this evolution are seldom completely born out by whole-rock geochemistry. Dur-<br />
ing crustal processing of magmas, crystal populations may be recycled between<br />
geochemical reservoirs such as end-members involved in magma mixing, assimi-<br />
lated country rock, or from variably evolved zones of a solidifying magma body.<br />
Crystals act as physical vessels to carry compositional and temporal information<br />
about magma evolution beyond whole-rock compositions. Textural and microana-<br />
lytical approaches differ from whole-rock approaches, because they provide a way<br />
to dissect crystal populations to reveal their chemical evolution as well as physical<br />
details of their nucleation and growth. Retrieval of these types of information are<br />
vital for understanding crustal magma evolution. The overarching goal of this<br />
work is to better understand the physical manner in which magmas solidify, and<br />
hence evolve, remains a fundamental problem in igneous petrology. I use crystal<br />
size distributions to identify related crystal populations. I use EPMA, LA-ICP-<br />
MS, and a microdrilling Sr isotope method to understand the provenance of select
William Scott Kinman<br />
plagioclase crystals. This work is focused upon understanding the petrogenesis of<br />
basaltic magmas. The Ontong Java Plateau is the size of Greenland yet basalt<br />
compositions across the plateau vary little. I propose a thick complex magma<br />
chamber system acted to buffer magma compositions, but at the plateau edge<br />
magmas were subjected to less density filtration and thus show more diversity.<br />
Highly depleted Detroit Seamount basalts formed during late Cretaceous inter-<br />
action of the Hawaiian hotspot with a spreading center. Some of these basalts<br />
contain evidence of magma mixing between unique melts from the hotspot source.<br />
I see no role for OIB-MORB magma mixing. Plagioclase dominated crystalliza-<br />
tion pre-dates peak crustal assimilation at Elan Ban, Kerguelen Plateau. Magma<br />
chamber systems beneath each setting studied are complex and multichambered.<br />
Future microanalytical work should focus on use of other isotope systems and use<br />
of laser ablation methods.
DEDICATION<br />
This work is dedicated to my wife for her unwavering support throughout my<br />
education, to my parents for teaching me to work hard and be honest, and to my<br />
son Cooper who helps me keep a smile on my face.<br />
ii
CONTENTS<br />
FIGURES . . . . . . . . . . . . . . . . . . . . . . . . . . . . . . . . . . . . viii<br />
TABLES . . . . . . . . . . . . . . . . . . . . . . . . . . . . . . . . . . . . x<br />
CHAPTER 1: INTRODUCTION . . . . . . . . . . . . . . . . . . . . . . . 1<br />
1.1 Introduction . . . . . . . . . . . . . . . . . . . . . . . . . . . . . . 1<br />
1.2 Crustal Magma Chambers . . . . . . . . . . . . . . . . . . . . . . 6<br />
1.2.1 Magma Chamber Processes: How Do Magmas Evolve? . . 7<br />
1.2.2 Solidification Fronts and Partial Crystallization of Magmas 8<br />
1.3 The Global Significance of Large Igneous Provinces (LIPs) . . . . 11<br />
1.4 Crystal Size Distributions (CSDs): Identification and Examination<br />
of Crystal Populations . . . . . . . . . . . . . . . . . . . . . . . . 13<br />
1.5 Crystal Stratigraphy - Microanalysis of Crystal Populations . . . . 15<br />
1.5.1 Plagioclase as a Target for Microanalysis of Basaltic Igneous<br />
Rocks . . . . . . . . . . . . . . . . . . . . . . . . . . . . . 15<br />
1.6 Analytical Methods . . . . . . . . . . . . . . . . . . . . . . . . . . 17<br />
1.6.1 Quantitative Textural Analysis: Crystal Size Distribution<br />
Measurement - CSD . . . . . . . . . . . . . . . . . . . . . 17<br />
1.6.2 Major Element Microanalysis: Electron Probe Microanalysis<br />
- EPMA . . . . . . . . . . . . . . . . . . . . . . . . . . 17<br />
1.6.3 Trace Element Microanalysis: Laser Ablation Inductively<br />
Coupled Plasma Mass Spectrometry - LA-ICP-MS . . . . . 18<br />
1.6.4 Microdrilling and Sr isotope microanalysis . . . . . . . . . 19<br />
1.7 Project Introductions . . . . . . . . . . . . . . . . . . . . . . . . . 20<br />
1.7.1 The Ontong Java Plateau, SW Pacific Ocean . . . . . . . . 20<br />
1.7.2 Detroit Seamount, Part of the Emperor Seamount Chain,<br />
NW Pacific Ocean . . . . . . . . . . . . . . . . . . . . . . 22<br />
1.7.3 The Kerguelen Plateau’s Western Salient - Elan Bank, Southern<br />
Indian Ocean . . . . . . . . . . . . . . . . . . . . . . . 24<br />
iii
CHAPTER 2: MAGMA EVOLUTION REVEALED BY ANORTHITE-<br />
RICH PLAGIOCLASE CUMULATE XENOLITHS FROM THE ON-<br />
TONG JAVA PLATEAU: INSIGHTS INTO LIP MAGMA DYNAMICS<br />
<strong>AND</strong> MELT EVOLUTION . . . . . . . . . . . . . . . . . . . . . . . . 27<br />
2.1 Introduction . . . . . . . . . . . . . . . . . . . . . . . . . . . . . . 27<br />
2.2 Geologic Background of the Ontong Java Plateau . . . . . . . . . 30<br />
2.3 Samples . . . . . . . . . . . . . . . . . . . . . . . . . . . . . . . . 31<br />
2.3.1 A Cogenetic Relationship Between Xenoliths? . . . . . . . 34<br />
2.4 Methods . . . . . . . . . . . . . . . . . . . . . . . . . . . . . . . . 34<br />
2.4.1 Analytical Methods . . . . . . . . . . . . . . . . . . . . . . 34<br />
2.4.2 Data Quality . . . . . . . . . . . . . . . . . . . . . . . . . 35<br />
2.4.3 Choosing partition coefficients (D) . . . . . . . . . . . . . 37<br />
2.4.4 Partition Coefficients for OJP Plagioclase Crystals . . . . 39<br />
2.5 Results . . . . . . . . . . . . . . . . . . . . . . . . . . . . . . . . . 49<br />
2.5.1 Plagioclase Zoning Patterns . . . . . . . . . . . . . . . . . 49<br />
2.5.1.1 Malaita Xenolith(ML-X1) . . . . . . . . . . . . . . . . . 49<br />
2.5.1.2 Site 1183 Xenoliths . . . . . . . . . . . . . . . . . . . . . 49<br />
2.5.1.3 Site 1183 Phenocrysts . . . . . . . . . . . . . . . . . . . 50<br />
2.5.1.4 Site 807 Xenolith (807-X1) . . . . . . . . . . . . . . . . . 52<br />
2.5.2 Measured compositions . . . . . . . . . . . . . . . . . . . . 61<br />
2.5.2.1 Major Elements . . . . . . . . . . . . . . . . . . . . . . . 61<br />
2.5.2.2 Trace Elements . . . . . . . . . . . . . . . . . . . . . . . 61<br />
2.5.3 Parental magma compositions . . . . . . . . . . . . . . . . 63<br />
2.5.3.1 Major Elements . . . . . . . . . . . . . . . . . . . . . . . 63<br />
2.5.3.2 Trace Elements . . . . . . . . . . . . . . . . . . . . . . . 64<br />
2.5.4 Resorption Features in Site 1183 xenolith Crystals . . . . . 68<br />
2.6 Discussion . . . . . . . . . . . . . . . . . . . . . . . . . . . . . . . 68<br />
2.6.1 Inferred Chemical Magma Evolution . . . . . . . . . . . . 68<br />
2.6.1.1 Major Elements . . . . . . . . . . . . . . . . . . . . . . . 68<br />
2.6.1.2 An-rich OJP Plagioclase: Influence of Temperature and<br />
Pressure . . . . . . . . . . . . . . . . . . . . . . . . . . . 72<br />
2.6.1.3 An-rich OJP Plagioclase: Influence of Water . . . . . . . 73<br />
2.6.1.4 Trace Elements . . . . . . . . . . . . . . . . . . . . . . . 74<br />
2.6.2 OJP Magma Chambers, Mush Layers, and Solidification<br />
Fronts . . . . . . . . . . . . . . . . . . . . . . . . . . . . . 77<br />
2.7 Summary and Conclusions . . . . . . . . . . . . . . . . . . . . . . 84<br />
CHAPTER 3: SHALLOW MAGMA EVOLUTION DURING LATE CRE-<br />
TACEOUS HAWAIIAN HOTSPOT-RIDGE INTERACTION: INSIGHTS<br />
FROM INTEGRATION <strong>OF</strong> CRYSTAL SIZE DISTRIBUTIONS <strong>AND</strong><br />
<strong>MICROANALYSIS</strong> <strong>OF</strong> PLAGIOCLASE . . . . . . . . . . . . . . . . . 86<br />
iv
3.1 Introduction . . . . . . . . . . . . . . . . . . . . . . . . . . . . . . 86<br />
3.1.1 Magma Evolution in the Crustal Magma Chambers . . . . 87<br />
3.2 The Emperor Seamount Chain . . . . . . . . . . . . . . . . . . . . 91<br />
3.3 Detroit Seamount . . . . . . . . . . . . . . . . . . . . . . . . . . . 91<br />
3.3.1 Samples . . . . . . . . . . . . . . . . . . . . . . . . . . . . 91<br />
3.3.2 Volcanic history of Detroit Seamount . . . . . . . . . . . . 92<br />
3.3.3 Sampling Strategy . . . . . . . . . . . . . . . . . . . . . . 93<br />
3.4 Analytical Methods . . . . . . . . . . . . . . . . . . . . . . . . . . 94<br />
3.4.1 Sample Preparation . . . . . . . . . . . . . . . . . . . . . . 94<br />
3.4.2 Crystal Size Distribution (CSD) Measurement . . . . . . . 94<br />
3.4.3 Electron Probe Microanalysis (EPMA) and Scanning Electron<br />
Microscopy . . . . . . . . . . . . . . . . . . . . . . . . 95<br />
3.4.4 Laser Ablation Inductively Coupled Plasma Mass Spectrometry<br />
(LA-ICP-MS) . . . . . . . . . . . . . . . . . . . . . . 97<br />
3.4.5 Major and Trace Element Data quality . . . . . . . . . . . 98<br />
3.4.6 Choosing partition coefficients (D) . . . . . . . . . . . . . 98<br />
3.4.6.1 Partition coefficients for DSM plagioclase crystals . . . . 100<br />
3.5 Results . . . . . . . . . . . . . . . . . . . . . . . . . . . . . . . . . 101<br />
3.5.1 Crystal Size Distributions . . . . . . . . . . . . . . . . . . 101<br />
3.5.1.1 Site 1203 CSDs . . . . . . . . . . . . . . . . . . . . . . . 101<br />
3.5.1.2 Site 884 CSDs . . . . . . . . . . . . . . . . . . . . . . . . 102<br />
3.5.2 CSDs as Guides for Microanalysis . . . . . . . . . . . . . . 107<br />
3.5.3 Petrography and Crystal Zoning Patterns of Microanalysis<br />
Samples . . . . . . . . . . . . . . . . . . . . . . . . . . . . 107<br />
3.5.3.1 Site 1203 Unit 3 . . . . . . . . . . . . . . . . . . . . . . 107<br />
3.5.3.2 Site 1203 Unit 14 . . . . . . . . . . . . . . . . . . . . . . 109<br />
3.5.3.3 Site 1203 Unit 31 . . . . . . . . . . . . . . . . . . . . . . 111<br />
3.5.3.4 Site 884 Unit 8 . . . . . . . . . . . . . . . . . . . . . . . 111<br />
3.5.4 Major Elements . . . . . . . . . . . . . . . . . . . . . . . . 113<br />
3.5.4.1 Site 1203 Unit 3 . . . . . . . . . . . . . . . . . . . . . . 113<br />
3.5.4.2 Site 1203 Unit 14 . . . . . . . . . . . . . . . . . . . . . . 113<br />
3.5.4.3 Site 1203 Unit 31 and Site 884 Unit 8 . . . . . . . . . . 114<br />
3.5.4.4 Ti variations between crystal populations and Units . . . 114<br />
3.5.5 Trace Elements . . . . . . . . . . . . . . . . . . . . . . . . 116<br />
3.5.5.1 Measured Compositions . . . . . . . . . . . . . . . . . . 116<br />
3.5.5.2 Inferred Parent Magma Compositions . . . . . . . . . . . 116<br />
3.6 Discussion . . . . . . . . . . . . . . . . . . . . . . . . . . . . . . . 120<br />
3.6.1 Evidence of Crystal Sorting . . . . . . . . . . . . . . . . . 120<br />
3.6.1.1 Site 1203 Alkalic Basalts and Tholeiitic Sheet Flows . . 122<br />
3.6.1.2 Site 1203 Pillow Basalts . . . . . . . . . . . . . . . . . . 122<br />
3.6.2 Insights from Plagioclase Major Element Compositions . . 124<br />
3.6.3 Crustal Magma Evolution: Insights from Trace Elements . 127<br />
v
3.6.3.1 Crystal Population Origins . . . . . . . . . . . . . . . . . 127<br />
3.6.4 The Crystal Record of Highly Evolved Magmas . . . . . . 133<br />
3.6.5 Ba and Sr variations: Evidence for Polybaric Crystallization?134<br />
3.7 Summary and Conclusions: Insights Into the Petrogenesis of Depleted<br />
Detroit Seamount Basalts . . . . . . . . . . . . . . . . . . . 136<br />
CHAPTER 4: CRUSTAL CONTAMINATION <strong>OF</strong> BASALTIC MAGMAS<br />
REVEALED THROUGH <strong>MICROANALYSIS</strong> <strong>OF</strong> MAJOR, MINOR, <strong>AND</strong><br />
TRACE ELEMENTS <strong>AND</strong> Sr ISOTOPES IN PLAGIOCLASE: IMPLI-<br />
CATIONS FOR ELAN BANK MAGMAS, KERGUELEN PLATEAU,<br />
INDIAN OCEAN . . . . . . . . . . . . . . . . . . . . . . . . . . . . . . 173<br />
4.1 Introduction . . . . . . . . . . . . . . . . . . . . . . . . . . . . . . 173<br />
4.1.1 Geologic Background of the Kerguelen Plateau and Elan Bank176<br />
4.2 Samples . . . . . . . . . . . . . . . . . . . . . . . . . . . . . . . . 176<br />
4.3 Analytical Techniques . . . . . . . . . . . . . . . . . . . . . . . . 178<br />
4.3.1 Sample Preparation . . . . . . . . . . . . . . . . . . . . . . 178<br />
4.3.2 Electron Probe Microanalysis (EPMA) and Scanning Electron<br />
Microscopy . . . . . . . . . . . . . . . . . . . . . . . . 178<br />
4.3.3 Laser Ablation Inductively Coupled Plasma Mass Spectrometry<br />
(LA-ICP-MS) . . . . . . . . . . . . . . . . . . . . . . 179<br />
4.3.4 Major and Trace Element Data quality . . . . . . . . . . . 180<br />
4.3.5 Microdrilling and Sr isotope microanalysis . . . . . . . . . 180<br />
4.3.6 Choosing Partition Coefficients (D) . . . . . . . . . . . . . 181<br />
4.3.6.1 Partition coefficients for Elan Bank Plagioclase Crystals 183<br />
4.4 Results . . . . . . . . . . . . . . . . . . . . . . . . . . . . . . . . . 185<br />
4.4.1 Petrography . . . . . . . . . . . . . . . . . . . . . . . . . . 185<br />
4.4.2 Electron Probe Microanalysis (EPMA) - Major Elements . 188<br />
4.4.3 LA-ICP-MS - Trace Elements . . . . . . . . . . . . . . . . 194<br />
4.4.3.1 Scandium, Ti, V, and Pb . . . . . . . . . . . . . . . . . 194<br />
4.4.3.2 Barium, Sr, and Rb . . . . . . . . . . . . . . . . . . . . 194<br />
4.4.3.3 Yttrium and the Rare Earth Elements La, Ce, Pr, Nd,<br />
Sm, and Eu . . . . . . . . . . . . . . . . . . . . . . . . . 198<br />
4.4.4 Sr Isotope Microdrilling . . . . . . . . . . . . . . . . . . . 198<br />
4.4.5 Inferred Parent Magma Compositions . . . . . . . . . . . . 202<br />
4.5 Discussion . . . . . . . . . . . . . . . . . . . . . . . . . . . . . . . 206<br />
4.5.0.1 Origin of Major Element Zoning and Resorption Surfaces 206<br />
4.5.0.2 Insights from Trace Elements and Inverted Parent Magma<br />
Compositions . . . . . . . . . . . . . . . . . . . . . . . . 208<br />
4.5.0.3 Diffusive Redistribution of Trace Elements . . . . . . . . 210<br />
4.5.0.4 Petrogenetic Insights from Plagioclase 87 Sr/ 86 SrI Ratios<br />
and the Timing of Crustal Contamination at Elan Bank 213<br />
vi
4.5.0.5 Where Did Plagioclase Dominated Partial Crystallization<br />
Occur? . . . . . . . . . . . . . . . . . . . . . . . . . . . . 213<br />
4.6 Summary and Conclusions . . . . . . . . . . . . . . . . . . . . . . 214<br />
CHAPTER 5: SUMMARY, CONCLUSIONS, <strong>AND</strong> FUTURE WORK . . 215<br />
5.1 Results and Conclusions . . . . . . . . . . . . . . . . . . . . . . . 215<br />
5.1.1 The Ontong Java Plateau . . . . . . . . . . . . . . . . . . 215<br />
5.1.2 Detroit Seamount, Emperor Seamount Chain . . . . . . . . 217<br />
5.1.3 Elan Bank, Kerguelen Plateau . . . . . . . . . . . . . . . . 218<br />
5.2 Recommendations for Future Work . . . . . . . . . . . . . . . . . 220<br />
BIBLIOGRAPHY . . . . . . . . . . . . . . . . . . . . . . . . . . . . . . . 222<br />
vii
FIGURES<br />
1.1 Magma Chambers . . . . . . . . . . . . . . . . . . . . . . . . . . . 3<br />
1.2 The CSD Plot . . . . . . . . . . . . . . . . . . . . . . . . . . . . . 5<br />
1.3 Multiply Saturated Magmatic Solidification Front . . . . . . . . . 9<br />
1.4 Global Distribution of Large Igneous Provinces . . . . . . . . . . 12<br />
2.1 Ontong Java Plateau Map . . . . . . . . . . . . . . . . . . . . . . 29<br />
2.2 OJP Xenoliths from ODP Site 1183: Hand Sample and Petrographic<br />
Thin Section Images . . . . . . . . . . . . . . . . . . . . . 32<br />
2.3 OJP Xenoliths from ODP Site 807 and Malaita: Hand Sample and<br />
Petrographic Thin Section Images . . . . . . . . . . . . . . . . . . 33<br />
2.4 ODP Site 1183 Stratigraphic Section and Locations of Xenoliths<br />
Examined in This study . . . . . . . . . . . . . . . . . . . . . . . 36<br />
2.5 Backscatter Electron SEM images of ODP Site 1183 Phenocrysts 38<br />
2.6 Core to Rim Traverses of An (mol%) Content of Xenolith Plagioclase<br />
Crystals and LA-ICP-MS Analysis Locations . . . . . . . . . 51<br />
2.7 Measured Major and Trace Element Data Versus An (mol%) Content 62<br />
2.8 Measured MgO Versus An (mol%) Content . . . . . . . . . . . . . 63<br />
2.9 Trace Element Ratio Plots for OJP Plagioclase Parent Magmas . 66<br />
2.10 Calculated Major and Trace Element Data Versus An (mol%) Content 69<br />
2.11 A Schematic of a Possible OJP Magma Chamber System . . . . . 81<br />
3.1 Map of the Hawaiian Ridge and Emperor Seamount Chain and<br />
Bathymetric Map of Detroit Seamount . . . . . . . . . . . . . . . 89<br />
3.2 Stratigraphy of igneous basement rocks recovered from ODP Sites<br />
1203 and 884 . . . . . . . . . . . . . . . . . . . . . . . . . . . . . 90<br />
3.3 Measurement and Interpretation of Crystal Size Distributions . . 96<br />
3.4 Site 1203 CSD Results . . . . . . . . . . . . . . . . . . . . . . . . 103<br />
viii
3.5 Site 884 CSD Results . . . . . . . . . . . . . . . . . . . . . . . . . 104<br />
3.6 The CSD Diagram as a Guide for Microanalysis . . . . . . . . . . 108<br />
3.7 Petrographic thin section photographs illustrating basalt textures 110<br />
3.8 Backscatter Electron Scanning Electron Microscopy Images Showing<br />
Plagioclase Major Element Zoning . . . . . . . . . . . . . . . 112<br />
3.9 Major Element Compositions of Plagioclase Crystal Cores . . . . 115<br />
3.10 Measured Trace Element Abundances Plotted Against Anorthite<br />
Content . . . . . . . . . . . . . . . . . . . . . . . . . . . . . . . . 117<br />
3.11 Parent Magma Ba/Sr and La/Sm Ratios Plotted Against Anorthite<br />
Content . . . . . . . . . . . . . . . . . . . . . . . . . . . . . . . . 119<br />
3.12 Population A and B Parent Magma La/Ce Vs. Sr Relative to Bulk-<br />
Rock Compositions . . . . . . . . . . . . . . . . . . . . . . . . . . 129<br />
3.13 Plagioclase Parent Magma La/Y Vs. Sr and Possible Source Affinities131<br />
3.14 Plagioclase Parent Magma Sr Vs. Ba . . . . . . . . . . . . . . . . 135<br />
4.1 Map of Indian Ocean and Kerguelen Plateau and Free-Air Gravity<br />
Map of Elan Bank . . . . . . . . . . . . . . . . . . . . . . . . . . 175<br />
4.2 ODP Site 1137 Igneous Basement Rocks . . . . . . . . . . . . . . 177<br />
4.3 Plagioclase Sr Isotope Microdrilling . . . . . . . . . . . . . . . . . 182<br />
4.4 Site 1137 Unit 4 and Unit 10 basalt petrography . . . . . . . . . . 186<br />
4.5 Site 1137 Unit 4 and 10 Plagioclase Phenocryst Major An-Ab-Or<br />
compositions . . . . . . . . . . . . . . . . . . . . . . . . . . . . . . 189<br />
4.6 Unit 4 An profiles . . . . . . . . . . . . . . . . . . . . . . . . . . . 190<br />
4.7 Unit 10 An profiles . . . . . . . . . . . . . . . . . . . . . . . . . . 191<br />
4.8 Microanalysis of Site 1137 Unit 4 Plagioclase Phenocrysts . . . . . 195<br />
4.9 Microanalysis of Site 1137 Unit 10 Plagioclase Phenocrysts Part I 196<br />
4.10 Microanalysis of Site 1137 Unit 10 Plagioclase Phenocrysts Part II 197<br />
4.11 Measured Trace Element Abundances vs. An Part I . . . . . . . . 199<br />
4.12 Measured Trace and Rare Earth Element Abundances vs. An Part II200<br />
4.13 Relative Ranges of 87 Sr/ 86 SrI of Site 1137 Whole-Rock Samples and<br />
Plagioclase Phenocrysts . . . . . . . . . . . . . . . . . . . . . . . 202<br />
4.14 Trace Element and Sr Isotope Diagrams . . . . . . . . . . . . . . 209<br />
4.15 Diffusive Redistribution of Sr and La . . . . . . . . . . . . . . . . 212<br />
ix
TABLES<br />
2.1 MAJOR <strong>AND</strong> TRACE ELEMENT DATA: PLAGIOCLASE PHE-<br />
NOCRYSTS <strong>AND</strong> XENOLITH PLAGIOCLASE CRYSTALS . . 41<br />
2.2 CALCULATED PARTITION COEFFICIENTS <strong>AND</strong> EQUILIB-<br />
RIUM LIQUID COMPOSITIONS . . . . . . . . . . . . . . . . . . 54<br />
2.3 RANGES <strong>OF</strong> TRACE ELEMENTS IN PLAGIOCLASE, WHOLE-<br />
ROCK DATA, <strong>AND</strong> INFERRED PARENT MAGMAS . . . . . . 67<br />
2.4 MELTS CRYSTALLIZATION MODELING <strong>OF</strong> AVERAGE OJP<br />
BASALTIC GLASSES . . . . . . . . . . . . . . . . . . . . . . . . 71<br />
3.1 CSD MEASUREMENT INFORMATION . . . . . . . . . . . . . 105<br />
3.2 CSD RESULTS . . . . . . . . . . . . . . . . . . . . . . . . . . . . 106<br />
3.3 PLAGIOCLASE PHENOCRYST MAJOR <strong>AND</strong> TRACE ELEMENT<br />
DATA . . . . . . . . . . . . . . . . . . . . . . . . . . . . . . . . . 138<br />
3.4 PLAGIOCLASE TRACE ELEMENT PARTITION COEFFICIENTS<br />
<strong>AND</strong> CALCULATED PARENT LIQUID COMPOSITIONS . . . 161<br />
4.1 UNIT 4 PLAGIOCLASE MAJOR <strong>AND</strong> TRACE ELEMENT ABUN-<br />
DANCES . . . . . . . . . . . . . . . . . . . . . . . . . . . . . . . 187<br />
4.2 UNIT 10 PLAGIOCLASE MAJOR <strong>AND</strong> TRACE ELEMENT ABUN-<br />
DANCES . . . . . . . . . . . . . . . . . . . . . . . . . . . . . . . 193<br />
4.3 UNIT 4 <strong>AND</strong> 10 87 Sr/ 86 Sr DATA . . . . . . . . . . . . . . . . . . 201<br />
4.4 UNIT 4 PLAGIOCLASE PARTITION COEFFICIENTS <strong>AND</strong> IN-<br />
FERRED PARENT MAGMA COMPOSITIONS . . . . . . . . . 204<br />
4.5 UNIT 10 PLAGIOCLASE PARTITION COEFFICIENTS <strong>AND</strong><br />
INFERRED PARENT MAGMA COMPOSITIONS . . . . . . . . 205<br />
x
1.1 Introduction<br />
CHAPTER 1<br />
INTRODUCTION<br />
Mantle source characterization is vital for understanding the origins of mag-<br />
matism on planetary bodies within our solar system and to achieve a more com-<br />
plete understanding of Earth’s geologic history. To accurately characterize mantle<br />
source regions it is necessary to understand the extent to which magma compo-<br />
sition changes between partial melting of the mantle and eruption at the surface.<br />
The notion that source characteristics are preserved transparently in primitive<br />
magmas from mantle source to eruption can be misleading. Indeed, O’Hara and<br />
Herzberg [113] suggested that truly primitive basaltic magmas rarely escape to<br />
the Earth’s surface, since the crust acts as a cool density filter to primitive mag-<br />
mas ascending from hotter mantle source regions. Ponding, cooling, and partial<br />
crystallization is favored as ascending magmas reach horizons of neutral buoyancy<br />
within the shallow crust, which commonly occurs at depths of 4-8 km [97, 122].<br />
Magma differentiation within the shallow crust may involve a combination of par-<br />
tial crystallization (i.e., fractional, equilibrium, or in-situ), assimilation, and/or<br />
magma mixing. A wide range of studies (e.g., [16, 38, 113]) have highlighted the<br />
significance of shallow magma evolution in basaltic to rhyolitic magmatic systems.<br />
Magma evolution in the shallow crust is complex. The details of this evo-<br />
lution are seldom completely born out by whole-rock geochemistry. There has<br />
1
thus been debate within the volcanology and petrology community regarding the<br />
utility of whole-rock data alone for deconvolution of complex differentiation pro-<br />
cesses. Whole-rock compositions are the sum of all of the processes and composi-<br />
tional end-members that affected a given hybrid magma, which is what extrusive<br />
igneous rocks commonly represent (e.g., [37, 98]). Textural and microanalytical<br />
approaches differ from whole-rock geochemical approaches in essence because they<br />
provide a way to dissect crystal populations to reveal their chemical evolution as<br />
well as physical details of their nucleation and growth (e.g., [39, 104]). Retrieval<br />
of these types of information are vital for understanding crustal magma evolu-<br />
tion. During crustal processing of magmas, crystal populations may be recycled<br />
between geochemical reservoirs such as end-members involved in magma mixing,<br />
assimilated country rock, or from variably evolved zones of a solidifying magma<br />
body [23]. Compositional data retrieved from distinct crystal populations and<br />
individual zoned crystals thus provide insights into the timing and chemistry of<br />
magma evolution, which helps to link changes in magma composition with phys-<br />
ical processes. Indeed, the physical manner in which magmas solidify, and hence<br />
evolve, remains a fundamental problem in igneous petrology (e.g., [70, 98]).<br />
Individual crystals and related crystal populations (e.g., phenocrysts, micro-<br />
lites, and/or xenocrysts) act as physical vessels to carry compositional and tempo-<br />
ral information about magma evolution (e.g.,[37]). Charlier et al. [23] presented<br />
an example that highlights the the wealth of petrogenetic information that can be<br />
recovered using a microanalytical approach to understand magmatic processes. In<br />
their examination of U-Th and U-Pb systematics of zircon crystals in Quaternary<br />
age rhyolites from Taupo volcano, New Zealand, Charlier et al. [23] reported nu-<br />
merous zircon crystals with cores inherited from the country rock (a zircon-bearing<br />
2
A)<br />
B)<br />
19∞15' N<br />
19∞20'<br />
Mauna Iki<br />
Kamakalauka<br />
19∞25'<br />
Kamakaiawaena<br />
Summit Magma<br />
Reservoir<br />
Southwest Rift Zone<br />
155∞20'<br />
19∞30'<br />
Kilauea<br />
Caldera<br />
Halemaumau<br />
Keanakakoi<br />
Kilauea Iki<br />
Devil's Throat Pauahi<br />
Aloi<br />
East Rift Zone<br />
Mauna Ulu Alae<br />
155∞10'<br />
Primary Conduit<br />
Makaopuhi<br />
Napau<br />
Pu'u Kamoamoa<br />
Pu'u O'o<br />
0<br />
Pu'u Kauka Heiheiahulu<br />
Pu'u Kiai<br />
Kalalua<br />
Volcanic Shield<br />
Oceanic Crust<br />
Upper Mantle<br />
3 km<br />
155∞05'<br />
30<br />
35<br />
40<br />
25<br />
0<br />
20<br />
15<br />
3 km<br />
Pacific Ocean<br />
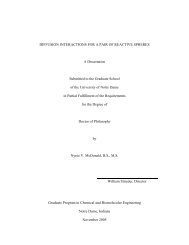
Figure 1.1. Graphic examples of relatively simple versus complex<br />
magma chamber models for the A) Ontong Java Plateau (from Sano<br />
and Yamashita [123]) constructed based primarily upon geochemical<br />
data and B) Kilauea (from Ryan [122]) using seismic data. Which<br />
model is more accurate?<br />
3<br />
Pu'u Kahaualea<br />
10<br />
155∞00' W<br />
5<br />
Depth (km)<br />
0
Cambrian schist) including a crystal with a narrow ∼ 520 Myr core region and<br />
∼ 300 Kyr rim grown in the rhyolitic host magma. These types of findings are of<br />
profound significance, as they provide robust insights into the fundamental phys-<br />
ical processes and chemical consequences of crustal assimilation. Although zircon<br />
is a refractory mineral, this type crystal of inheritance is not limited to zircon and<br />
may be exhibited by minerals that are stable on the basaltic liquidus over a wide<br />
range of magmatic temperatures and pressures (e.g., plagioclase). Crystal popula-<br />
tions and individual crystals not totally consumed by magmatic processes indeed<br />
provide records of magma chemistry and magma chamber dynamics beyond what<br />
can be learned through whole-rock studies alone.<br />
The complexity of shallow magma evolution has also been highlighted by quan-<br />
titative textural studies, most notably in crystal size distribution (CSD) studies<br />
(e.g.,[67, 68, 96, 97]). Crystal size distributions yield information about crystal<br />
nucleation and growth conditions as well as open system processes like crystal ac-<br />
cumulation or magma mixing [20, 96]. Higgins [67] showed that the proportions of<br />
mixing members can be well estimated from CSD data. Crystal size distributions<br />
provide a means to qualitatively assess whether certain processes may have taken<br />
place (e.g., magma mixing, crystal resorption/removal, or crystal accumulation),<br />
as well as provide a quantitative method for determining magmatic residence times<br />
and calculation of end-member mixing proportions [67].<br />
A collective goal within the volcanology and petrology community is to under-<br />
stand the timing and dynamics of shallow magma evolution. Meeting this goal<br />
serves not only to answer fundamental scientific questions but also includes an im-<br />
portant human factor. Magma evolution that takes place in shallow subterranean<br />
chambers has a dramatic influence on when and how a volcano will erupt (e.g.,<br />
4
Figure 1.2. (A) Relationship of CSD slope to crystal growth rate and<br />
residence time. Slope = -1/Gτ where G is growth rate; τ = residence<br />
time; n ◦ = nucleation density. (B) CSD showing mixture of two crystal<br />
populations. (C) Plagioclase CSD of a ∼ 81 Ma pillow basalt sample<br />
from Detroit Seamount where whole-rock data have indicated magma<br />
mixing may have occurred.<br />
5
explosive eruption vs. mild effusive eruption) as well as how seriously an eruption<br />
will impact the surrounding human population e.g., [65]. This human factor has<br />
been an impetus for extensive studies of active volcanoes like Mt. Vesuvius due to<br />
the threat this volcano poses to the densely populated city of Naples, Italy. More<br />
pertinent to the work described here is the fact that efforts to fully understand<br />
and mitigate volcanic hazards has lead to creative new textural and microana-<br />
lytical schemes to improve the accuracy of our view of how magmas evolve in<br />
the shallow crust [105]. The overarching purpose of the work detailed in this<br />
dissertation is to constrain the physical and chemical details of shallow magma<br />
evolution in basaltic systems with an emphasis large igneous provinces (LIPs).<br />
In this chapter I will introduce contemporary views of magma chambers, magma<br />
dynamics, magma evolution, LIPs and their global significance, microanalytical<br />
approaches, CSDs, and three focused research projects where I applied textural<br />
and/or microanalytical approaches to better understand fundamental processes of<br />
shallow basaltic magma evolution.<br />
1.2 Crustal Magma Chambers<br />
Rarely can one confidently identify detailed physical processes that<br />
drive petrologic diversity. Part of the difficulty originates in the construction<br />
of physical and chemical models; they often appear as fundamentally<br />
different enterprises. – G.W. Bergantz [4]<br />
Modeling magma chamber architecture and magma chamber processes is com-<br />
plicated by our inability to directly observe these subterranean environments as<br />
they are active. The architecture of magma chambers and/or magma chamber<br />
systems are depicted drastically different, as suggested by [4], whether modeled<br />
using chemical (i.e., using isotopic, major, and trace element data) or physical<br />
6
(i.e., using textural, seismic, or other geophysical data) data. Magma chamber<br />
architecture has a profound influence on the chemistry of evolving magmas [98].<br />
Geochemists customarily envisage magma chambers as large vats of magma, where<br />
processes such as fractional crystallization, magma mixing, and assimilation are<br />
modeled within a physically simple context (e.g., Fig. 1.1a). For example, Fig-<br />
ure 1.1a, from Sano and Yamashita [123], illustrates a relatively simple magma<br />
chamber model for the Ontong Java Plateau (OJP) based only upon geochemical<br />
data and petrographic observations. The magma chamber system of Kilauea vol-<br />
cano, Hawaii is depicted much differently as a complicated interconnected network<br />
of dikes, sills, and chambers [122]. This Kilauea model was constructed using seis-<br />
mic data by Ryan [122] (Fig. 1.1b). Neither model is necessarily ill-constructed,<br />
but each model was contrived to explain either physical observations or chemical<br />
observations but not both. Chemical and physical magma chamber models must<br />
be better integrated in order to generate more realistic (and accurate) models<br />
of magma chamber architecture and how this architecture is related to magma<br />
dynamics and the chemical evolution of magma.<br />
1.2.1 Magma Chamber Processes: How Do Magmas Evolve?<br />
Magma chamber processes such as partial crystallization, magma mixing, and/or<br />
assimilation play a controlling role in shallow level differentiation and need to be<br />
understood if a parental (or even primary) magma compositions are to be es-<br />
timated. Magma chamber architecture influences the physical manner in which<br />
differentiation processes occur (i.e., homogenous crystallization vs. solidification<br />
front crystallization)[97]. The role of solidification fronts, crystal-mush piles, and<br />
their interstitial liquids have increasingly recognized roles in magmatic differen-<br />
7
tiation (e.g., [84, 98]; Fig. 1.3). Contemporary magma chamber models have<br />
suggested solidification front processes have pervasive and significant effects on<br />
the textural and chemical evolution of magmas (e.g., [97, 98]). Classic magma<br />
chamber models tend to favor high rates of convection and bottom-up solidification<br />
primarily by crystal sedimentation (e.g., [138]). However, growing evidence over-<br />
whelmingly suggests crystallization occurs commonly along chamber walls, where<br />
most heat is lost, and progresses inward by solidification front growth [97, 98, 102].<br />
1.2.2 Solidification Fronts and Partial Crystallization of Magmas<br />
In his discussion of solidification front dynamics, Marsh [98] suggested that<br />
upon emplacement of any magma body, solidification front growth begins imme-<br />
diately and thickens with the square root of time. Silicate magmas are commonly<br />
multiply saturated favoring non-dendritic solidification front growth (e.g., Fig. 1.3<br />
adapted from [98]). Crystal nucleation and initial growth take place within the<br />
suspension zone, which is bounded outward by the capture front and inward by<br />
the liquidus. Outward from the capture front, within the mush zone, the solidifi-<br />
cation front has a crystallinity of >25% where crystals continue to grow but have<br />
little chance of escaping the advancing front. Toward the magma chamber walls<br />
the solidification front has a crystallinity > 50% and essentially behaves as a solid<br />
(for a dedicated discussion of solidification fronts see [98]).<br />
In a crystallizing magma, chemical components not incorporated into the grow-<br />
ing mineral phases will accumulate in the melt adjacent to the growing crystals<br />
particularly where non-turbulent crystallization environments exist. These envi-<br />
ronments most plausibly exist within solidification fronts in crystal mush layers.<br />
Mush layers, as described above, are rheological elements of solidification fronts<br />
8
Figure 1.3. A simple schematic of a multiply saturated solidification<br />
front. This solidification front morphology is favored over dendritic type<br />
solidification fronts in most of magmatic systems. Figure adapted from<br />
[98]<br />
9
defined as having crystallinities between 25% and 50%-55% [98] (Fig. 1.3). Pro-<br />
cesses occurring within mush-layers and their interstitial spaces are thus best dis-<br />
cussed in terms of solidification front processes. Crystallization within the mush<br />
zone produces evolved interstitial melts [84, 98]. Continued crystallization traps<br />
these evolved liquids within the solidification front. Dependent upon reservoir<br />
geometry and magma supply rate, solidification fronts may propagate inward to<br />
a point where the chamber is filled largely with a crystal mush that has a net-<br />
work of interstitial spaces filled with variably evolved melts [98]. Flushing or filter<br />
pressing of the crystal mush frees these evolved melts that can: 1) mix with more<br />
primitive magmas; 2) be erupted; or 3) be intruded. A filter pressing mecha-<br />
nism has been suggested for off-summit (axial) Hawaiian eruptions, where axial<br />
tholeiitic Kilauea magmas are olivine-clinopyroxene-plagioclase-saturated versus<br />
olivine saturated in summit magmas (e.g., [71, 98]). Interstitial liquids in the<br />
crystal mush may be flushed out by less evolved magma rising from lower levels<br />
of the magmatic system.<br />
The crystal-free interior of the magma chamber is not affected by the solidi-<br />
fication front differentiation processes, though evolved liquids may attain enough<br />
buoyancy to rise and mix with undifferentiated magmas in the magma chamber<br />
interior [84, 85, 101]. Scouring of magma chamber margins by vigorous input<br />
of new magma may free evolved packets of magma and crystals by solidification<br />
front erosion (e.g., [98]). Phases that are below the liquidus of the main body<br />
of magma can grow in interstitial spaces of solidification fronts and mush piles<br />
that are thermally and mechanically insulated from the hotter magma chamber<br />
interior [84]. Crystal debris, including sub-liquidus phases, may be fully or par-<br />
tially resorbed by the hotter less evolved magma in the chamber interior, which<br />
10
will change composition reflecting such resorption. If entrained crystals survive<br />
they may be deposited by sedimentation elsewhere in the magmatic system ef-<br />
fectively fractionating the residual magma, a process referred to as punctuated<br />
differentiation by Marsh [98]. Shallow magma evolution in basaltic systems on<br />
Earth (LIPs) is thus influenced by a balance of several processes that include: 1)<br />
Formation of evolved melts within crystal-mush regions due to partial crystalliza-<br />
tion and the return of these melts to the main magma body by buoyancy driven<br />
flow or solidification front erosion; 2) Flushing of variably evolved melts from the<br />
crystal-mush interstitial spaces (i.e, filter pressing mechanism); 3) Entrainment<br />
of phenocrysts and other crystal debris during magma recharge; 4) Resorption;<br />
5) Crystal settling and solidification front capture of crystals leading to magma<br />
fractionation [84, 85, 98, 101]; 6) Assimilation; and 7) Magma mixing.<br />
1.3 The Global Significance of Large Igneous Provinces (LIPs)<br />
Large igneous provinces or LIPs are massive crustal emplacements of mafic<br />
magma unrelated to normal ocean floor spreading [31] (Fig. 1.4). Magmas from<br />
LIPs provide insight into regions of the mantle untapped during normal sea-floor<br />
spreading [32]. Understanding LIP magma dynamics is important, particularly in<br />
light of recent debate regarding the existence of mantle plumes and their common<br />
association with LIPS (e.g., [48, 124]). Plume based models generally favor deep<br />
mantle source regions for LIPS (e.g., [17]), possibly at the core mantle boundary<br />
(e.g., [14, 31]), whereas alternative, non-plume models favor shallow fertile upper<br />
mantle source regions referred to as “perisphere” [81]. Resolution of this debate<br />
must first begin with a better understanding of primitive LIP magmas, including<br />
their volatile content, temperature, and most importantly - the extent to which<br />
11
12<br />
Figure 1.4: Large Igneous Provinces around the globe; The three LIPs at the focus of this study are labeled: Hawaiian-<br />
Emperor Chain, Ontong Java Plateau, and the Kerguelen Plateau. Map is adapted from [32].
these magmas chemically evolved in the shallow crust. Clues to these processes and<br />
relatively primitive magma compositions may be best recorded in early liquidus<br />
mineral phases [5]. Coffin ad Eldholm [32] suggested that some LIPs are emplaced<br />
at rates greater than 10 5 km 2 m.y. −1 , which underscores the possibility that LIP<br />
emplacement can have dramatic effects on the global environment. Large Igneous<br />
Provinces are more buoyant than normal oceanic crust and are relatively resistant<br />
to subduction, which indicates they may have an important role in the genesis of<br />
continents throughout geologic time [32].<br />
1.4 Crystal Size Distributions (CSDs): Identification and Examination of Crystal<br />
Populations<br />
The origins of phenocrysts are an often under-appreciated aspect of petrologic<br />
investigations. It is becoming increasingly apparent that they commonly represent<br />
a more complex formation than simple crystallization from their current host<br />
magmas [98]. This complexity is well documented by CSDs, which measure the<br />
number of crystals of a characteristic size per unit volume of rock (e.g., [20, 96,<br />
98]). Higgins [67] used CSDs to identify two distinct populations of plagioclase in<br />
porphyritic dacites from Kameni Volcano, Greece, which he interpreted to be a<br />
result of mixing between two phenocryst-carrying magmas (Fig. 1.2b). Crystal size<br />
distributions are customarily displayed on a log-normal plot of population density<br />
(number of crystals per unit volume rock) versus crystal size (L) (Fig. 1.2) [20].<br />
The utility of the CSD is best illustrated by considering a simple example,<br />
emplacement of a thin lava flow where magma arrives at the surface in a wholly<br />
liquid state. Crystal nucleation rate increases as the flow cools [18]. If nucleation<br />
and growth continue uninterrupted, the final rock will yield a linear or near linear<br />
13
distribution of crystal sizes (e.g., Fig. 1.2a) [68, 96]. However, if the magma arrives<br />
at the surface carrying macroscopic crystals (i.e., phenocrysts), be they entrained<br />
crystals from a mush pile or ripped up pieces of the conduit, the final rock will<br />
yield a non-linear CSD (Fig. 1.2b) [18]. If the magma in a wholly liquid state<br />
stalled and experienced partial crystallization en-route to the surface then lost<br />
some of its newly grown crystals via crystal settling, then a downward deflection<br />
of the CSD would be favored [99]. Crystals carried in the initial magma may vary<br />
in size and can easily be interpreted as phenocrysts crystallized from the present<br />
host magma [98]. Non-linear CSDs indicate dynamic and/or kinetic processes af-<br />
fected crystallization [18, 96], which reflects the presence of more than one distinct<br />
subterranean crystal nucleation and growth environment (e.g., Fig. 1.2b,c) [67].<br />
In the case of a rock formed from a phenocryst-carrying magma, it will contain<br />
at least two distinct populations of crystals. In the case of a non-linear CSD, the<br />
crystals grown as the lava cooled and solidified at the surface reflect the most<br />
recent conditions of nucleation and growth (e.g., the segments of the CSD with<br />
steeper negative slope in Figs. 1.2b,c). Phenocrysts carried in the initial magma<br />
(i.e., those represented by the shallower negative slope in Figs. 1.2b,c) reflect nu-<br />
cleation and growth conditions in some subsurface environment. If a linear crystal<br />
growth rate is assumed, CSDs can be used to estimate crystal residence times in<br />
magmatic systems (Fig. 1.2a) e.g., [120]. The curvature and slopes of CSD seg-<br />
ments provide a way to examine and narrow the possible physical processes that<br />
affected a batch of magma [70].<br />
14
1.5 Crystal Stratigraphy - Microanalysis of Crystal Populations<br />
Advances in microsampling and technology have made it possible to chemically<br />
and in some cases isotopically dissect igneous rocks, mineral by mineral (e.g.,<br />
[22]). Detailed rim-to-rim isotopic, major, and trace element studies (i.e., crystal<br />
stratigraphy) have commonly documented phenocryst-host rock disequilibrium<br />
(e.g., [39, 40, 134, 135, 143]). Crystal stratigraphy studies have also provided<br />
insights into the microenvironments surrounding crystals as they grow or where<br />
growth has been disrupted (e.g., [59, 60]). Processes affecting magmatic crystal<br />
growth are revealed on a crystal-by-crystal basis using this method, however its<br />
power requires a statistically relevant number of crystals be analyzed. Analysis<br />
of too few crystals provides only a limited, local-scale history of the rock. As<br />
an example of this potential limitation, consider a basaltic magma body that<br />
has experienced numerous magma mixing events consisting of liquid ± crystal<br />
exchange. Lavas produced from the system will carry crystals from some or all<br />
of the mixing events (e.g., [59, 139]). Like whole-rock analysis, documenting the<br />
histories of too few crystals from the basalt will not adequately characterize all<br />
of the processes (in this case mixing events) responsible for the final texture and<br />
composition of the rock. This potential limitation is minimized via integration of<br />
CSDs and crystal stratigraphy studies, whereby CSDs are used to identify crystal<br />
populations with related nucleation and growth histories that then become targets<br />
for microanalysis.<br />
1.5.1 Plagioclase as a Target for Microanalysis of Basaltic Igneous Rocks<br />
In this study plagioclase feldspar is a frequent target for major and trace el-<br />
ement microanalysis. As noted by Bindeman et al. [8], plagioclase is ideal for<br />
15
investigating magmatic evolution using crystal stratigraphy because 1) it is a<br />
common igneous mineral in mafic through felsic systems; 2) it appears early as<br />
a liquidus phase in basaltic systems and is stable on the liquidus for a relatively<br />
long period of time because of its capability for solid solution; 3) minerals that<br />
crystallize before plagioclase (e.g., olivine) do not significantly fractionate trace<br />
elements so plagioclase compositions adequately reflect the composition of the<br />
parental magma; 4) plagioclase contains measurable quantities of trace elements<br />
from different geochemical groups (e.g., large ion lithophile elements - LILE and<br />
rare earth elements - REE); 5) plagioclase has a highly polymerized crystal struc-<br />
ture relative to olivine or clinopyroxene that leads to very slow diffusivities of<br />
major and trace cations so magmatic-induced zonations are commonly preserved<br />
(e.g., [13, 24–28, 56–58]). Plagioclase therefore commonly records events in the<br />
evolution of a magma body that are evident as optical zonation or resorption<br />
features. Such features have been previously studied through experimental work<br />
(e.g., [77, 87, 107, 136]) and numerical modeling (e.g., [1, 86, 90]).<br />
The simple fact that Sr is compatible in plagioclase makes it an ideal candidate<br />
mineral for intra-mineral measurements of 87 Sr/ 86 Sr ratios via microdrilling, micro<br />
Sr extraction and analysis by TIMS [38]. Micro Sr isotope studies have proven to<br />
be fruitful at elucidating important processes during open system shallow magma<br />
evolution, as 87 Sr/ 86 Sr ratios are not heavily influenced by closed system magmatic<br />
processes and partial crystallization (e.g., [39]).<br />
16
1.6 Analytical Methods<br />
1.6.1 Quantitative Textural Analysis: Crystal Size Distribution Measurement -<br />
CSD<br />
Digital image mosaics of entire petrographic thin sections were captured in<br />
cross polarized light using an automated microscope stage system manufactured<br />
by Prior Scientific Instruments, Cambridge, UK. Photographs of each scanned<br />
area were printed on photograph paper and overlain with tracing paper. Minerals<br />
of interest (plagioclase and/or olivine) were outlined by hand using a pen with<br />
a 0.1 mm diameter tip (which also corresponds to the smallest measurable crys-<br />
tal size). The tracings were digitized via high resolution scanning with a flatbed<br />
scanner. Crystal intersection areas were shaded gray, detected, and measured<br />
according to a best fit ellipse routine using the freeware program UTHSCSA Im-<br />
ageTool (http://ddsdx.uthscsa.edu/dig/itdesc.html). The best fit ellipse major<br />
and minor axis results were input into the spreadsheet program CSDslice written<br />
by Morgan and Jerram [106] to estimate the three-dimensional crystal habit. As<br />
a thin section through an igneous rock will be a random 2D representation, the<br />
plagioclase crystals will be represented as a variety of cross sections. The crystal<br />
major axis data, the estimated 3D crystal habit, rock fabric, total area measured,<br />
and an estimate of crystal roundness were input into the program CSDcorrections<br />
version 1.37 written by Michael Higgins [68] to covert two-dimensional CSD data<br />
to true three-dimensional CSDs as outlined by Marsh [96].<br />
1.6.2 Major Element Microanalysis: Electron Probe Microanalysis - EPMA<br />
The Electron Probe Microanalysis (EPMA) and SEM methods outlined in<br />
this section are general descriptions of the methods used for quantitative wave-<br />
17
length dispersive spectroscopy(WDS) and collection of compositionally contrasted<br />
backscatter electron images throughout all of the work presented in this disser-<br />
tation. Deviations from these general methods are noted with accompanying ra-<br />
tionale for each change. Backscatter electron images and major element analyses<br />
were performed using a JEOL JXA-8600 Superprobe electron microprobe at the<br />
University of Notre Dame. Backscatter electron images were collected using a 1<br />
µm beam, an accelerating voltage of 20 kV, and a probe current of 25-50 nA.<br />
Microprobe analyses were performed using a 10 µm defocused beam, accelerating<br />
voltage of 15 kV, a probe current of 20 nA, 15 second on-peak counting time, and<br />
two background measurements per peak. Sodium was measured first to minimize<br />
loss via volatilization. Microprobe data were corrected for matrix effects using<br />
a ZAF correction routine. Data points near Fe-rich phases such as melt inclu-<br />
sions and alteration-filled fractures were discarded. I utilized variety of mineral<br />
calibration standards for mineral analyses and glass standards for melt inclusion<br />
analyses, and I generally attempted to match mineral standards with the mineral<br />
understudy (e.g., orthoclase and sanidine as Al, Na, K, and Si standards for anal-<br />
ysis of plagioclase). I routinely measured major elements in mineral standards as<br />
unknowns during analytical sessions to monitor calibration and data quality.<br />
1.6.3 Trace Element Microanalysis: Laser Ablation Inductively Coupled Plasma<br />
Mass Spectrometry - LA-ICP-MS<br />
The LA-ICP-MS method described in this section is a general method descrip-<br />
tion, and deviations from this general routine in terms of elements and instrument<br />
parameters are noted. Scandium, Ti V, Rb, Sr, Y, Ba, La, Ce, Nd, Sm, Eu, and<br />
Pb were measured in plagioclase crystals using a New Wave UP-213 UV laser<br />
18
ablation system interfaced with a ThermoFinnigan Element 2 ICP-MS operated<br />
in fast magnet scanning mode at the University of Notre Dame. I used a laser<br />
frequency of 5 Hz, pulse energy of 0.02-0.03 mJ pulse −1 , 15 - 40 µm diameter pits<br />
depending on crystal size, and helium as the carrier gas (∼ 0.7 l min −1 ) mixed<br />
with argon (∼ 1.0 l min −1 ) before introduction to the plasma. Due to the transient<br />
nature of the laser ablation signal, analyses were conducted in peak jumping mode<br />
with one point quantified per mass. The LA-ICP-MS spots were coincident with<br />
previous EPMA analyses, and Ca measured by EPMA was used as an internal<br />
standard for each spot analysis, because its fractionation behavior is similar to<br />
that of Sr, Ba, the REE [52]. The trace element glass NIST 612 was used as a<br />
calibration standard for all laser ablation analyses. Although heterogeneity for<br />
certain elements has been documented in the widely used NIST 612 glass i.e.,<br />
[44], Eggins et al. [44] considered it a reliable calibration standard for the ele-<br />
ments examined in this study. The analytical protocols of Longerich et al. [88]<br />
were used for LA-ICP-MS data reduction within the LAMTRACE spreadsheet<br />
data reduction program written by Dr. Simon Jackson or Macquarie University.<br />
1.6.4 Microdrilling and Sr isotope microanalysis<br />
Microdrilling for Sr isotope microanalysis was performed using a Merchantek<br />
MicroMill at the University of Durham, UK after completion of EPMA and LA-<br />
ICP-MS work. We used a highly tapered tungsten carbide drill bit for all drilling,<br />
which provided < 50 µm diameter single drill pits. Microdrilling was performed<br />
by setting precision scans consisting of grids and lines of drill points, which al-<br />
lowed us to target zones of interest and to maximize the amount of Sr recovered<br />
to ensure as accurate and precise 87 Sr/ 86 Sr measurements as possible. Prior to<br />
19
microdrilling, a pre-cleaned square 4 cm x 4 cm piece of parafilm with a ∼ 2 cm<br />
center hole was adhered to the polished sample surface. A droplet of ultrapure<br />
water was then placed over the center hole and area to be drilled. The parafilm<br />
was was used to minimize dispersion of the water droplet and to minimize sample<br />
loss. Microdrilling was then performed within the water droplet, which generated<br />
a slurry as sample material was removed. The slurry was removed using a mi-<br />
cropipette and placed in a 3.5 mL Teflon beaker. The sample was then subjected<br />
to a hotplate concentrated HF and HNO3 digestion. Strontium was extracted<br />
using a scaled down ion exchange column method. Extracted Sr was loaded on<br />
Re filaments and 87 Sr/ 86 Sr ratios were measured using a Finnigan Triton thermal<br />
ionization mass spectrometer (TIMS). Davidson et al. [39] and Tepley et al. [135]<br />
provide more extensive discussions about of the micro-Sr isotope method.<br />
1.7 Project Introductions<br />
1.7.1 The Ontong Java Plateau, SW Pacific Ocean<br />
The Ontong Java Plateau is the worlds largest oceanic LIP spanning an area<br />
of roughly 2.018 x 10 6 km 2 in the Southwest Pacific ocean [30, 32, 93, 94, 132, 133]<br />
(Fig. 1.4). Tarduno et al. [129] and Mahoney et al. [93, 94] suggested that the<br />
bulk of the OJP formed in a submarine eruptive environment relatively rapidly<br />
around ∼122 Ma, with a minor event at ∼90 Ma [93, 94, 132, 133]. Most of the<br />
OJP is presently submerged, exceptions being the southern plateau margin on<br />
the islands of Malaita, San Cristobal (Makira), and Santa Isabel in the Solomon<br />
Islands, where obducted segments now outcrop [116].<br />
Despite its size, only three subtly different low-K tholeiitic basalt types have<br />
been recovered from the OJP, either by field work or ocean drilling, which have<br />
20
een referred to as Singgalo, Kwaimbaita, and Kroenke basalts [46, 131, 133]<br />
(Fig. 1.4). The uniformity of basalt composition over the Greenland-size OJP is<br />
remarkable [46, 110, 131, 133]. Three different basalt types have been recovered<br />
from this vast LIP, and of these three types the Kwaimbaita basalt makes up ><br />
90% of the OJP [110, 131, 133]. My study is focused on plagioclase cumulate<br />
xenoliths from the Kwaimbaita basalt. Kwaimbaita basalt is the most widespread<br />
OJP basalt type and the only one of the three that contains cumulate xenoliths,<br />
and the magma chamber processes that produced this ubiquitous composition<br />
were the most common and important during formation of the OJP.<br />
Key OJP research questions include: What are the physical processes (i.e.,<br />
magma chamber dynamics) of differentiation that led to the repeated production<br />
of the same basalt type (Kwaimbaita basalt) over a Greenland-size geographic<br />
area? Hypothesis 1: OJP magma chambers were crystal-mush dominated, where<br />
differentiation was heavily influenced by residence time of magmas in the crys-<br />
tal mush. Near steady state flow of melt into and out of a vast crystal-mush-<br />
dominated magma chamber system is amenable to repeated production of the<br />
same type of basalt over a wide area. Crystals will be isotopically similar to<br />
their host basalt, but will contain greater ranges of trace element enrichments and<br />
depletions than the whole-rock host basalt.<br />
Hypothesis 2: Nucleation and growth of crystals occurred homogenously through-<br />
out the magma chamber interior. Plagioclase crystals will contains similar isotopic<br />
and trace element compositions as the whole-rock host basalt.<br />
21
1.7.2 Detroit Seamount, Part of the Emperor Seamount Chain, NW Pacific<br />
Ocean<br />
Detroit Seamount is located near the northern terminus of the Emperor Seamount<br />
Chain and formed when the Hawaiian hot spot was adjacent to a mid-ocean ridge<br />
during the Late Cretaceous (76-81 Ma) [34, 43] (Fig. 1.4). Interaction of hot<br />
spots and mid-ocean ridges (MOR) often have profound effects on the surround-<br />
ing lithosphere [47, 62–64, 79, 119]. Geochemically anomalous hot spot and MOR<br />
basalts are common in areas of hot spot-MOR interaction and are often linked<br />
to unique mantle processes resulting from the interaction [79, 119]. Several re-<br />
cent studies have noted incompatible trace element and isotopically depleted hot<br />
spot basalts from Detroit Seamount e.g., [72, 79, 119]. Detroit Seamount basalt<br />
compositions extend from N-type MORB-like to compositions intermediate be-<br />
tween N-MORB and young Hawaiian tholeiitic basalts [72, 79, 119]. Frey et al.<br />
[50] presented compositional evidence linking DSM basalts to the Hawaiian hot<br />
spot and concluded that it is unlikely DSM basalts are simply MORB. Several<br />
hypotheses have been put forward to explain the petrogenesis of depleted hot<br />
spot basalts at DSM. Keller et al. [79] suggested that the rising Hawaiian plume<br />
entrained MORB-source upper mantle to an extent that partial melting of the<br />
MORB source component overwhelmed the hot spot source signature in DSM<br />
magmas. Regelous et al. [119] favored an alternative model, where a depleted<br />
component inherent to the Hawaiian plume was more apparent in DSM magmas<br />
due to greater partial melting under a thinner lid of lithosphere near the spreading<br />
center. Huang et al. [72] noted the significance of fractionation and accumulation<br />
of olivine and plagioclase, and thus an implied of signifigance low pressure partial<br />
crystallization (e.g., [130]) during the evolution of DSM magmas in the crust. If<br />
22
one is then to relate DSM basalt chemistry to the nature of a mantle source region<br />
or some mantle process, it is vital to understand the extent to which bulk DSM<br />
magma compositions were influenced during their transit through the crust. Once<br />
the extent of magma evolution in the shallow crust is constrained, understanding<br />
the roles of mantle processes becomes less convoluted. I employ an integrated tex-<br />
tural and microanalytical approach to constrain shallow magma evolution during<br />
the formation of Detroit Seamount by 1) identification of crystal populations with<br />
related physical growth histories and 2) understanding the provenance of these<br />
crystals.<br />
Hypothesis 1: Magma mixing occurred between OIB and MORB magmas,<br />
as the Hawaiian plume was close to a MOR [95]. If this is the case, evidence<br />
supporting magma mixing, such as curved CSDs (e.g., [67]) from mixed crystal<br />
populations (e.g., [139]) should be apparent. If magma mixing did occur, and<br />
the plume-ridge proximity was least when the Site 884 (∼81 Ma) basalts were<br />
erupted. These basalts should contain a better record of mixing relative to Site<br />
1203 (∼75 Ma) basalts. Plagioclase crystals grown after the mixing event will<br />
reflect the trace element and isotopic composition of the hybridized melt and will<br />
appear in textural equilibrium with the melt. Zones grown before the mixing<br />
event will bear the trace element and isotopic compositions of respective mixing<br />
end-members. Some crystals may contain compositional evidence of exposure and<br />
growth end-member magmas.<br />
Hypothesis 2: The ascending OIB plume punched through and entrained<br />
MORB source rocks as well as MORB intrusive and extrusive rocks. Melting of<br />
the source rocks prior to plagioclase crystallization would have led to MORB-like<br />
signatures in initial growth zones in crystals from the oldest plagioclase popu-<br />
23
lations. Reprocessing of intrusive and extrusive MORB materials by ascending<br />
plume magmas would be evident in CSDs as crystal accumulation (assuming only<br />
partial resorption of the debris; e.g., [98]) and the presence of partially resorbed<br />
plagioclase crystals. Late crystallizing plagioclase would reflect growth from a<br />
hybridized magma, whereas entrained crystals would generally have MORB sig-<br />
natures.<br />
Hypothesis 3. The melt source was entirely related to the Hawaiian hotspot.<br />
Ascending hotspot magmas passed through a complex magma chamber system<br />
where they picked up crystal debris leading to curved CSDs. There is no evidence<br />
of distinct MORB or OIB end-members. Compositional variations are ascribed<br />
to variations in melting of a single heterogeneous source and variations in shallow<br />
magma chamber dynamics over time.<br />
1.7.3 The Kerguelen Plateau’s Western Salient - Elan Bank, Southern Indian<br />
Ocean<br />
The submarine Kerguelen Plateau (KP) and Broken Ridge constitute the sec-<br />
ond largest oceanic LIP on Earth and rise up to 4 km above the surrounding<br />
Indian Ocean basin (Fig. 4.1). Current sampling of the Cretaceous portion of the<br />
KP has been done via drilling at 11 drill sites during Ocean Drilling Program<br />
Legs 119, 120, and 183. Prior to Leg 183 drilling a number of workers suggested<br />
that continental crust was involved during the petrogenesis some KP basalts (e.g.,<br />
[51, 92]). Drilling at Site 1137 on Elan Bank confirmed hypotheses of continental<br />
crust involvement when clasts of garnet-biotite gneiss were recovered from a flu-<br />
vial conglomerate unit (Unit 6 in Fig. 4.2) [33, 74]. Nicolaysen et al. [111] and<br />
Frey et al. [49] suggested that during the break up of the Gondwana superconti-<br />
24
nent fragments of old continental crust were stranded amongst the Indian Ocean<br />
lithosphere including fragments within the KP crust.<br />
One of the scientific objectives of Leg 183 drilling was to constrain the post-<br />
melting evolution of Kerguelen magmas, of which crustal assimilation was clearly<br />
an important process. In this study I explore the timing and nature of crustal con-<br />
tamination of KP magmas by focusing on the compositional and isotopic record of<br />
assimilation contained within zoned plagioclase phenocrysts in two basalts from<br />
Leg 183 Site 1137 - Units 4 and 10. On the basis of whol-rock geochemistry, Ingle<br />
et al. [75] placed the Unit 4 basalt in a relatively uncontaminated upper basalt<br />
group and and the Unit 10 basalt in a relatively contaminated lower basalt group.<br />
Examination of plagioclase phenocrysts from Units 4 and 10 provide snapshots of<br />
the magmatic processes that were occurring when both when crustal contamina-<br />
tion was significant and when it was not.<br />
Hypothesis 1: Initial LIP magma emplacement in the crust was accompanied<br />
by large amounts of crustal assimilation followed by armoring of magma chamber<br />
walls. Crystallization occurred by solidification front growth. In this case early<br />
formed plagioclase crystals or zones (i.e., cores) will contain the greatest signa-<br />
ture of the crustal wall rocks, however the contamination signature in the crystal<br />
cores may be indistinct if contamination significantly pre-dates plagioclase crys-<br />
tallization. Late formed crystals or zones (i.e., rims) will contain less of a crustal<br />
signature. Hypothesis 2: Crustal assimilation occurred progressively as crystals<br />
25
nucleated homogenously and grew throughout the magma chamber interior. Early<br />
formed crystals or zones (i.e., cores) will not necessarily bear the most contami-<br />
nated signatures. Late formed crystals or zones (i.e., rims) will be equally or more<br />
contaminated than early formed crystals.<br />
26
CHAPTER 2<br />
MAGMA EVOLUTION REVEALED BY ANORTHITE-RICH PLAGIOCLASE<br />
CUMULATE XENOLITHS FROM THE ONTONG JAVA PLATEAU:<br />
INSIGHTS INTO LIP MAGMA DYNAMICS <strong>AND</strong> MELT EVOLUTION<br />
2.1 Introduction<br />
Petrologic studies have historically relied upon whole-rock chemistry alone to<br />
deduce evolutionary processes that modify magmas. Textural and microanalyti-<br />
cal studies focused on plagioclase have been recently used to understand magma<br />
chamber processes and the chemical evolution of basaltic to silicic magmas e.g.,<br />
[5, 6, 16, 39, 135]. Plagioclase is well suited for microanalysis, as it contains<br />
measurable quantities of select incompatible trace elements, including the light<br />
rare earth elements (LREE). It is often preceded on the liquidus only by olivine,<br />
which does not appreciably fractionate the REE or other incompatible trace ele-<br />
ments in the residual liquid [5]. In this study I use major, minor, and trace element<br />
abundances measured in plagioclase by electron probe microanalysis (EPMA) and<br />
laser ablation ICP-MS (LA-ICP-MS) to invert chemical compositions of basaltic<br />
parental (equilibrium) magmas from a large igneous province (LIP) to investigate<br />
magma evolution. Accurate partition coefficient data are critical for this inversion.<br />
Plagioclase partition coefficients must be applied carefully because anorthite (An<br />
= 100*[Ca/(Ca+Na)]) content is a controlling factor of cation substitution [7, 10].<br />
27
With accurate partition coefficients, inferred parent magma compositions provide<br />
insight into magma evolution beyond what is revealed by whole-rock data alone.<br />
I examine basaltic magma evolution and magma chamber process of the Ontong<br />
Java Plateau (OJP), a mid-Cretaceous large igneous province (LIP) (Fig. 2.1).<br />
The uniformity of basalt composition over the Greenland-size OJP is remarkable<br />
[46, 110, 131, 133]. Three different basalt types have been recovered from this vast<br />
LIP, and of these three types the Kwaimbaita basalt makes up > 90% of the OJP<br />
[110, 131, 133]. My study is focused on plagioclase cumulate xenoliths from the<br />
Kwaimbaita basalt (Figs. 2.2, 2.3). Kwaimbaita basalt is the only one of the three<br />
OJP basalt types that contains the xenoliths, and the magma chamber processes<br />
that produced this ubiquitous basalt type were the most common and important<br />
during formation of the OJP. Previous studies have suggested shallow (< 6-8<br />
km) fractional crystallization of olivine, plagioclase, and clinopyroxene was a ma-<br />
jor mechanism of OJP magma differentiation [46, 103, 110, 121, 123, 133]. Sano<br />
and Yamashita [123] presented a magma chamber model to explain the narrow<br />
range of OJP basalt chemistry. An outstanding question in their study of OJP<br />
basalt petrography and phase equilibria was the origin of An-rich (> An80) pla-<br />
gioclase, which they demonstrated through experiments to be out of equilibrium<br />
with Kwaimbaita basalt (Sano and Yamashita, [123]). I evaluate whether An-rich<br />
crystals grew in an evolved water-rich boundary layer, which is the model favored<br />
by Sano and Yamashita [123], or whether they formed by an alternate process<br />
such as growth in a hotter more primitive magma. I also examine whether the<br />
28
Figure 2.1. Predicted bathymetry of the Ontong Java Plateau (OJP)<br />
(modified after Mahoney et al. [91]). The locations of Ocean Drilling<br />
Program (ODP) and Deep Sea Drilling Project (DSDP) drill sites on the<br />
OJP are shown with the basalt types recovered at each location.<br />
Kw=Kwaimbaita basalt, Kr=Kroenke basalt, and Sg=Singgalo basalt.<br />
29
uniform composition of large volumes of OJP basalt represent an averaging of<br />
more varied compositions, which may be reflective of important magma chamber<br />
processes. Finally, I examine how these processes relate to the spatial distribution<br />
of known basalt types across the OJP.<br />
2.2 Geologic Background of the Ontong Java Plateau<br />
The Ontong Java Plateau is the worlds largest oceanic LIP spanning an area of<br />
roughly 2.018 x 10⁶ km 2 in the Southwest Pacific ocean [30, 32, 93, 94, 132, 133]<br />
(Fig. 2.1). Tarduno et al. [129] and Mahoney et al. [93, 94] suggested that the bulk<br />
of the OJP formed in a submarine eruptive environment relatively rapidly around<br />
∼122 Ma, with a minor event at ∼90 Ma [93, 94, 132, 133]. Most of the OJP is<br />
presently submerged, exceptions being the southern plateau margin on the islands<br />
of Malaita, San Cristobal (Makira), and Santa Isabel in the Solomon Islands,<br />
where obducted segments now outcrop [116] (Fig. 2.1). Despite its size, only<br />
three subtly different low-K tholeiitic basalt types have been recovered from the<br />
OJP, either by field work or ocean drilling, which have been referred to as Singgalo,<br />
Kwaimbaita, and Kroenke basalts [46, 131, 133] (Fig. 2.1). Singgalo basalts are<br />
isotopically distinct and overlie Kwaimbaita basalt on Malaita and ∼1,500 km to<br />
the north at Ocean Drilling Program (ODP) Site 807 [93, 94, 110, 133] (Fig. 2.1).<br />
Incompatible trace element abundances are slightly enriched and MgO abundances<br />
lower (6-7.3 %) in Singgalo basalts relative to Kwaimbaita basalts (7-8 %) [46,<br />
93, 94, 110, 131–133]. Kroenke basalts have higher MgO (8-11 wt.%) and lower<br />
incompatible trace element abundances than Kwaimbaita basalts [46]. However,<br />
these relatively primitive basalts are isotopically indistinguishable from the more<br />
fractionated Kwaimbaita basalts and share the same ∼122 Ma age [46, 131]. Fitton<br />
30
and Godard [46] and Tejada et al. [131] suggested Kroenke basalts are parental<br />
to Kwaimbaita basalts, being related by olivine fractionation. On the basis of<br />
current sampling Kroenke and Singgalo basalts represent minor components of<br />
the overall OJP volume and have been recovered primarily from the margins of<br />
the plateau [46] (Fig. 2.1).<br />
2.3 Samples<br />
The samples examined in this study were collected from outcrops along the<br />
Singgalo River on Malaita and by drill core at ODP Sites 807 (Leg 130) and 1183<br />
(Leg 192), which are shown in figure 2.1 with the basalt types recovered at each<br />
location (see also Figs. 2.2, 2.3). All xenolith crystals and phenocrysts examined<br />
in this study are from Kwaimbaita basalt and the ∼122 Ma eruptive event [21, 46,<br />
93, 94, 131, 133]. Malaita is located along the southern margin of the plateau (see<br />
Figs. 2.1, 2.3). Site 807 is along the northern margin of the OJP, and the xenoliths<br />
are from Units C-G, which are equivalent to the Kwaimbaita basalts (Figs. 2.1,2.3).<br />
Site 1183 is near the bathymetric high of the plateau, where 80.7 m of Kwaimbaita<br />
pillow basalt was cored, representing 8 flow units [91] (Fig. 2.4). Plagioclase<br />
cumulate xenoliths (Fig. 2.2) are found in all but Unit 1 of the cored section at<br />
Site 1183 [91] (Fig. 2.4). Kwaimbaita basalt is found as massive and pillow basalt<br />
flows, generally has a subophitic to intergranular texture, and < 2% (volume)<br />
phenocrysts [91, 123, 133]. The dominant phenocrysts in Kwaimbaita basalts are<br />
olivine and plagioclase with lesser amounts of clinopyroxene. I measured major<br />
and trace elements in single large crystals from one Malaitan xenolith (host basalt<br />
SGB-21, c.f., [133]; Fig. 2.3a-d), from three Site 1183 xenoliths (Units 5B, 6,<br />
and 7; (see Fig. 2.2a-d), and from a single glomerocryst/xenolith from Site 807<br />
31
Figure 2.2. Hand sample and thin section photographs of plagioclase rich<br />
xenoliths hosted in Kwaimbaita basalt from ODP Site 1183. A) hand sample<br />
of Unit 5B xenolith (192-1183A-59R2 112-117 cm piece #10A); B) Mosaic<br />
photomicrograph of Unit 7 xenolith (192-1183A-64R2 116-120 cm piece<br />
#9B). Note network of plagioclase crystals and labeled resorption feature.<br />
All visible crystals are plagioclase; C) Photomicrograph showing partially<br />
resorbed clinopyroxene and devitrified glass in a Unit 5B xenolith (adapted<br />
from [91]); D) An altered olivine crystal along the margin of Unit 7 xenolith;<br />
E) Photomicrograph of Unit 6 xenolith illustrating the xenolith interior and<br />
exterior and a resorption feature (192-1183A-63R2 25-27 cm piece #4); F)<br />
Photomicrograph of the margin of a Unit 6 xenolith. The xenolith exterior<br />
(i.e., rim) and a clinopyroxene crystal are visible.<br />
32
Figure 2.3. Hand sample and thin section photographs of plagioclase rich<br />
xenoliths hosted in Kwaimbaita basalt from ODP Site 807 and Malaita. A)<br />
A boulder of Kwaimbaita basalt (SGB-21) from along the Singgalo River,<br />
Malaita exhibiting large plagioclase-rich xenoliths. Note rock hammer for<br />
scale; B) Mosaic photomicrograph of the interior of Malaita xenolith ML-X1,<br />
exhibiting oscillatory zoning; C) Rim of xenolith ML-X1 illustrating<br />
destruction of the rim zones by alteration and a clinopyroxene crystal present<br />
along the rim; D) Small melt inclusions within ML-X1 that run parallel to<br />
zoning features; E) Mosaic photomicrograph of xenolith 807-X1 from ODP<br />
Site 807 (130-807C-93R-1-137-139). Note olivine and clinopyroxene along the<br />
xenolith margins; F) Altered olivine along the margin of 807-X1.<br />
(see 2.3e). I also measured major and trace element data at select points in a<br />
variety of phenocrysts from Site 1183 Units 5B, 6, and 7 basalts (Fig. 2.5a-d).<br />
I did not examine any plagioclase phenocrysts from Kwaimbaita basalt SGB-21<br />
from Malaita or the Site 807 Kwaimbaita basalt. Detailed descriptions of zoning<br />
patterns of the xenolith plagioclase crystals and phenocrysts are provided in the<br />
results section.<br />
33
2.3.1 A Cogenetic Relationship Between Xenoliths?<br />
Isotopic studies were not conducted on any of the plagioclase crystals in this<br />
study. Tejada et al. [133] reported isotopic data for a single OJP plagioclase<br />
xenolith, which was isotopically indistinguishable from its Kwaimbaita host basalt<br />
(SGB-21, see sample description below). I therefore assume for this study that<br />
the plagioclase-rich xenoliths, all in Kwaimbaita host basalt, are indistinguishable<br />
from Kwaimbaita-type basalt.<br />
2.4 Methods<br />
2.4.1 Analytical Methods<br />
Samples were prepared as polished thick sections (80-100 µm) with Bi-doped<br />
epoxy to signal when the sample had been penetrated during LA-ICP-MS analy-<br />
ses e.g., [76]. Bismuth was chosen as a dopant because naturally occurring Bi is<br />
well below analytical detection limits in plagioclase. Backscatter electron images<br />
and major element analyses were performed using a JEOL JXA-8600 Superprobe<br />
electron microprobe at the University of Notre Dame. Backscatter electron im-<br />
ages were taken using a 1 µm beam, an accelerating voltage of 20 kV, and a<br />
probe current of 25-50 nA. Microprobe analyses were performed using a 5 µm<br />
defocused beam, accelerating voltage of 15 kV or 20 kV depending upon samples,<br />
a probe current of 20 nA, 15 second on-peak counting time, and two background<br />
measurements per peak. I measured Na first to minimize loss via volatilization.<br />
Microprobe data were corrected for matrix effects using a ZAF correction method.<br />
Data points near Fe-rich phases such as melt inclusions and alteration-filled frac-<br />
tures were discarded due to Fe fluorescence effects. Titanium was quantified by<br />
EPMA. Strontium, Y, Ba, La, Ce, Nd, and Eu were measured in plagioclase<br />
34
crystals using a New Wave UP-213 UV laser ablation system interfaced with a<br />
ThermoFinnigan Element 2 ICP-MS operated in fast magnet scanning mode at<br />
the University of Notre Dame. I used a laser frequency of 4 Hz, pulse energy of<br />
0.02-0.03 mJ pulse −1 , 12 µm or 20 µm diameter pits depending on crystal size,<br />
and helium as the carrier gas (∼ 0.7 l min −1 ) mixed with argon (∼ 1.0 l min −1 )<br />
before introduction to the plasma. Analyses were conducted in peak jumping<br />
mode with one point quantified per mass. The LA-ICP-MS spots were coincident<br />
with previous EPMA analyses, and Ca measured by EPMA was used as an inter-<br />
nal standard for each spot analysis. The trace element glass NIST 612 was used<br />
as a calibration standard in all laser ablation analyses. Although heterogeneity<br />
for certain elements has been documented in the widely used NIST 612 glass i.e.,<br />
[44], Eggins et al. [44] considered it a reliable calibration standard for Sr, Ba, Y,<br />
and the REE. The methods of Longerich et al. [88] and Norman et al. [112] were<br />
used to reduce LA-ICP-MS data and calculate analytical uncertainty for each spot<br />
analysis (Table 2.1).<br />
2.4.2 Data Quality<br />
The quality of EPMA data were monitored by major element and cation totals.<br />
Data points where major element totals were greater than 101.5% or less than<br />
98.5% are not used in further discussion nor are points with cation totals greater<br />
or less than 20 ± 0.1 cations (based on 32 O). All laser ablation analyses were<br />
collected in time-resolved mode so that signal from inclusions and alteration filled<br />
fractures could be easily excluded. Results from laser ablation spots close to<br />
fractures or that penetrated into underlying fractures were discarded. The rate of<br />
laser ablation was tested using a 100 µm thick plagioclase wafer prior to sampling,<br />
35
Figure 2.4. Stratigraphic section of basaltic basement cored at ODP Site<br />
1183 consisting entirely of Kwaimbaita pillowed basalt flow units. The<br />
locations of xenoliths are labeled with asterisks. The locations of xenoliths<br />
examined in this study (59R2-X1, 63R2-X1, and 64R2-X1) are labeled.<br />
36
which allowed optimization of operating conditions to yield desired sensitivity and<br />
sampling depth (< 30 µm).<br />
2.4.3 Choosing partition coefficients (D)<br />
Blundy [9] concluded that inversion of magma compositions from mineral data<br />
using appropriate D values to be a robust means of estimating parent magma com-<br />
positions and suggested that D values derived from microbeam techniques were<br />
more accurate than those derived from bulk crystal-matrix analyses. Bindeman<br />
and Davis [6] noted that D values derived from doping experiments should be used<br />
with caution as, for example, the DREE and DY in REE doped runs are 30-100%<br />
higher than in undoped runs. Blundy and Wood [10] and Bindeman et al. [7]<br />
showed that the dominant factors controlling the trace element Ds for plagioclase<br />
are An content and crystallization temperature (pressure effects appeared to be<br />
negligible). Bindeman et al. [7] applied this relationship to a wide variety of trace<br />
elements and produced values for the constants “a” and “b” in their Equation 2<br />
for calculating plagioclase partition coefficients via the expression:<br />
RT ln(Di) = aXAn + b (2.1)<br />
where R is the gas constant, T is temperature (Kelvin), and XAn is the mole<br />
fraction of anorthite in the plagioclase. Using equation 2.1, Ginibre et al. [59]<br />
noted that temperatures in the range of 850-1,000 ◦ C had only a small effect on<br />
calculated melt concentrations for Sr and Ba (within their analytical uncertainty).<br />
Likewise, Bindeman et al. [7] showed that variations ∼150 ◦ C produce < 10%<br />
differences for particular partition coefficients, which were often within error of<br />
the respective D values.<br />
37
Figure 2.5. Backscatter electron images of plagioclase phenocrysts from Site<br />
1183 basalts A) A type I normal zoned crystal (63R2P4, Unit 6). Note the<br />
brighter, higher An core; B) A type II reverse zoned crystal with a darker,<br />
lower An core (64R2P4, Unit 7); C) An olivine-plagioclase glomerocryst<br />
(64R2P3, Unit 7). The plagioclase crystal has a sieve textured core; D) A<br />
reverse zoned type II crystal that contains numerous melt inclusions<br />
(64R2P1).<br />
38
2.4.4 Partition Coefficients for OJP Plagioclase Crystals<br />
I used the equations and constants of Bindeman et al. [7], derived from par-<br />
titioning experiments run at natural (i.e., undoped) trace element concentration<br />
levels at atmospheric pressure, to calculate D values for Sr, Y, Ba, La, Ce, Nd, and<br />
Ti (see Table 2.2). I assumed a crystallization temperature of 1185 ◦ C to calculate<br />
D values. Sano and Yamashita [123] reported initial crystallization of plagio-<br />
clase at 1170 ◦ C from Kwaimbaita-type magmas and 1200 ◦ C from more primitive<br />
Kroenke-type magmas. The use of 1170 ◦ C vs. 1200 ◦ C in D calculations yields <<br />
4% differences in trace element concentrations of parent liquids, within the ana-<br />
lytical error for most of my analyses. I neglect pressure effects since they are not<br />
well documented for most elements, and where they were documented for DSr by<br />
Vander Auwera et al. [137] they were negligible. Magmatic water can affect D val-<br />
ues by decreasing the activity of trace element components in silicate melts [144].<br />
However, Kwaimbaita basaltic glass samples have relatively low H2O contents<br />
(generally ≤ 0.22 wt %; [121]), so we estimate the effect of water on OJP plagio-<br />
clase D values to be negligible. The partitioning studies of Bindeman et al. [7]<br />
were run in air such that their equations and constants for calculation of DEu and<br />
DFe (hereafter DFeOT for total Fe as FeO) neglect the effects of magma oxygen fu-<br />
gacity (f O2). Oxygen fugacity affects the partitioning of Fe and Eu in plagioclase<br />
[142]. Trivalent Fe substitutes for Al 3+ in the tetrahedral site, Eu 2+ substitutes in<br />
the plagioclase M cation site at low f O2, and Eu 3+ present at higher f O2 is incom-<br />
patible [41, 89, 127]. I estimated a DEu ≈ 0.43 graphically from Blundy [9] (his<br />
Fig. 3: DEu vs.∆QFM of basaltic magma), where it was demonstrated that DEu<br />
increased systematically with decreasing f O2 in basalts. I estimate DFeOT ≈ 0.065<br />
for OJP plagioclase. This value is an average from experimental crystallization<br />
39
studies of Kwaimbaita basalt by Sano and Yamashita [123] at the QFM buffer,<br />
which is the approximate f O2 condition of OJP basalt crystallization suggested<br />
by Roberge et al. [121]. This estimate of DFeOT is supported by the results of<br />
Phinney [117] who reported little change in DFeOT at f O2 below the QFM oxy-<br />
gen buffer, while DFeOT increased steadily at higher f O2, which was attributed to<br />
greater amounts of Fe 3+ in the melt. If generally constant partitioning of Mg be-<br />
tween plagioclase and melt is assumed (i.e., using the method of Bindeman et al.<br />
[7]), we calculate an average DMg value of 0.024 ± 0.005 for the OJP plagioclase<br />
crystals considered in this study. The minor variation of DMg, using the Bindeman<br />
et al. [7] method, over the large compositional range of plagioclase examined in<br />
this study (An65−86) is in accordance with Longhi [89] and Bindeman et al. [7]<br />
who suggested An content has minimal effect on Mg partitioning. However, the<br />
average DMg values calculated using the equations and constants of Bindeman et<br />
al. [7] are inconsistent with the experimental results of Sano and Yamashita [123],<br />
whose results for OJP basalts reveal slightly larger values for Kwaimbaita (0.1<br />
MPa DMg = 0.043; 190 MPa DMg = 0.055) and Kroenke basalts (0.1 MPa DMg<br />
= 0.04; 190 MPa DMg = 0.06) at elevated pressures. This suggests crystallization<br />
pressure may have an effect on DMg [123]. I use DMg ≈ 0.047 to invert parent<br />
magma compositions of OJP plagioclase crystals, which is an average of eight DMg<br />
values from the experimental results of Sano and Yamashita [123] conducted at<br />
0.1 and 190 MPa. Phinney [117] reported an average basaltic plagioclase DMg<br />
value of 0.044, which is consistent with my selected DMg value.<br />
40
41<br />
Crystal<br />
Zone 1<br />
An<br />
(mol%)<br />
ML-X1 xenolith<br />
TABLE 2.1<br />
MAJOR <strong>AND</strong> TRACE ELEMENT DATA: PLAGIOCLASE<br />
PHENOCRYSTS <strong>AND</strong> XENOLITH PLAGIOCLASE CRYSTALS<br />
SiO2 TiO2 Al2O3 FeO T 2 MgO CaO Na2O K2O P2O5 Total Sr Y Ba La Ce Nd Eu 3<br />
Interior 85 47.5 0.02 31.9 0.54 0.22 17.4 1.71 0.07 0.17 100.8 172.4 0.21 2.31 0.24 0.59 - 0.25<br />
Interior 85 48.0 0.01 32.4 0.55 0.23 17.5 1.67 - 0.13 100.5 161.3 0.18 2.99 0.17 0.25 0.37 0.34<br />
Interior 85 47.7 0.02 31.4 0.52 0.23 17.3 1.65 0.05 0.17 100.5 176.9 0.19 1.93 0.20 0.37 0.39 0.35<br />
Interior 86 47.6 0.01 32.2 0.56 0.23 17.7 1.63 0.04 0.13 100.4 187.0 0.13 2.18 0.25 0.36 0.76 0.42<br />
Interior 84 48.0 0.01 31.7 0.56 0.25 17.4 1.79 0.09 0.13 100.4 172.7 - 2.90 0.39 0.36 0.38 0.47<br />
Interior 86 47.7 0.03 32.6 0.56 0.23 18.1 1.57 0.03 0.17 99.8 185.3 0.43 3.12 0.30 0.54 0.23 -<br />
59R2-X1 xenolith<br />
Exterior 66 55.4 0.03 26.2 1.01 0.21 13.4 3.67 0.15 0.16 100.2 - - - - - - -<br />
Exterior 75 50.6 0.04 29.6 0.72 0.32 16.1 3.98 0.03 0.13 100.5 225.7 0.19 4.97 0.43 0.65 0.49 0.49<br />
Interior 81 49.3 0.02 30.1 0.65 0.26 17.5 2.32 0.03 0.18 100.4 - - - - - - -<br />
continued...
42<br />
Crystal<br />
Zone<br />
An<br />
(mol%)<br />
TABLE 2.1<br />
Continued<br />
SiO2 TiO2 Al2O3 FeO T MgO CaO Na2O K2O P2O5 Total Sr Y Ba La Ce Nd Eu<br />
Interior 82 50.2 0.03 29.4 0.70 0.27 17.8 2.18 0.01 0.17 100.8 199.7 0.14 3.84 0.27 0.57 0.30 0.45<br />
Interior 83 48.8 0.02 31.0 0.65 0.24 17.6 1.94 0.01 0.15 100.4 218.7 0.18 4.65 0.22 0.57 0.52 0.45<br />
Interior 82 49.5 0.01 29.8 0.67 0.28 17.8 2.11 0.02 0.21 100.4 203.5 0.12 3.64 0.20 0.61 0.42 0.47<br />
Center/core 83 48.8 0.01 30.7 0.66 0.25 18.0 1.98 0.02 0.14 100.5 206.0 0.19 5.05 0.31 0.58 0.64 0.34<br />
59R2 phenocrysts P1-P4<br />
P1 Rim 71 51.7 0.03 27.8 0.84 0.33 15.0 3.35 0.02 0.16 99.3 202.2 0.29 6.06 0.35 0.70 0.78 0.38<br />
P1 Core 74 51.0 0.03 29.4 0.74 0.28 15.4 2.97 0.01 0.12 100.0 187.4 0.13 4.30 0.36 0.54 0.42 0.42<br />
P2 Rim 70 51.4 0.04 29.2 0.84 0.33 14.8 3.44 0.02 0.12 100.3 207.1 0.22 5.26 0.39 0.71 0.46 0.47<br />
P2 Core 73 51.2 0.03 29.2 0.75 0.34 15.5 3.13 0.02 0.15 100.3 195.4 0.34 4.56 0.46 0.52 0.47 0.39<br />
P3<br />
Center<br />
P4<br />
Center<br />
69 51.0 0.03 29.4 0.85 0.34 14.3 3.50 0.03 0.14 99.6 - - - - - - -<br />
67 52.1 0.03 28.6 0.89 0.37 13.7 3.77 0.03 0.15 99.7 - - - - - - -<br />
continued...
43<br />
Crystal<br />
Zone<br />
An<br />
(mol%)<br />
63R2-X1 xenolith<br />
TABLE 2.1<br />
Continued<br />
SiO2 TiO2 Al2O3 FeO T MgO CaO Na2O K2O P2O5 Total Sr Y Ba La Ce Nd Eu<br />
Exterior 79 47.6 0.03 31.2 0.74 0.28 17.40 2.32 0.02 0.22 99.9 178.1 0.27 3.04 0.20 0.43 0.51 0.22<br />
Exterior 77 48.8 0.03 30.7 0.76 0.31 16.40 2.69 0.02 0.18 100.2 180.3 0.22 4.31 0.13 0.29 0.24 0.28<br />
Exterior 81 48.2 0.02 31.0 0.70 0.25 17.50 2.24 0.01 0.20 100.1 168.9 0.34 3.41 0.22 0.33 0.04 0.22<br />
Exterior 75 50.1 0.02 29.8 0.60 0.26 16.10 2.90 0.03 0.21 100.1 160.8 0.21 3.32 0.22 0.36 0.33 0.26<br />
Interm. 85 48.3 0.01 31.7 0.65 0.23 18.10 1.79 0.01 0.19 100.9 175.0 0.21 2.73 0.19 0.38 0.34 0.26<br />
Resorp. 81 48.9 0.03 30.6 0.62 0.26 17.50 2.26 0.02 0.20 100.3 171.9 0.10 2.91 0.26 0.27 0.32 0.26<br />
Interm. 85 48.0 0.04 31.2 0.66 0.24 18.10 1.78 0.02 0.22 100.2 177.9 0.14 2.66 0.17 0.41 0.27 0.28<br />
Interm. 85 48.0 - 31.3 0.67 0.23 18.30 1.82 - 0.20 100.5 171.80 0.18 2.91 0.13 0.34 0.17 0.39<br />
Interm. 82 48.7 - 30.8 0.68 0.27 17.70 2.10 0.01 0.20 100.4 172.0 0.18 2.82 0.17 0.39 0.31 0.28<br />
Interm. 83 48.5 0.01 31.2 0.63 0.26 17.50 1.91 0.02 0.21 100.3 170.9 0.13 2.98 0.16 0.39 0.33 0.22<br />
Interm. 84 48.5 0.02 30.9 0.64 0.25 18.20 1.99 0.02 0.22 100.6 169.6 0.25 2.93 0.19 0.57 0.41 0.25<br />
Interm. 85 48.2 0.02 31.2 0.62 0.25 18.20 1.77 0.01 0.19 100.5 170.4 0.15 2.88 0.19 0.50 0.22 0.35<br />
continued...
44<br />
Crystal<br />
Zone<br />
An<br />
(mol%)<br />
63R2 phenocrysts P1-P4<br />
TABLE 2.1<br />
Continued<br />
SiO2 TiO2 Al2O3 FeO T MgO CaO Na2O K2O P2O5 Total Sr Y Ba La Ce Nd Eu<br />
P1 Core 73 51.5 0.02 29.0 0.81 0.33 14.8 2.94 0.03 0.17 99.6 - - - - - - -<br />
P1<br />
Interm<br />
P1<br />
Interm<br />
76 50.5 0.03 29.7 0.83 0.33 16.0 2.70 0.02 0.17 100.3 236.4 0.25 8.57 0.43 0.72 0.17 0.24<br />
74 51.1 0.03 29.5 0.81 0.30 15.6 3.06 0.04 0.15 100.6 173.3 0.12 4.64 0.14 0.49 0.28 0.10<br />
P1 Rim 70 52.5 0.07 28.4 0.97 0.35 14.8 3.43 0.20 0.18 100.9 - - - - - - -<br />
P2<br />
Center<br />
77 50.0 0.03 30.0 0.82 0.31 16.3 2.75 0.02 0.16 100.4 177.6 0.22 4.87 0.31 0.55 0.09 0.32<br />
P3 Core 73 51.1 0.03 29.7 0.95 0.53 14.2 2.90 0.03 0.14 99.6 - - - - - - -<br />
P3 Rim 68 51.9 0.03 28.7 0.97 0.50 13.7 3.57 0.05 0.17 99.6 195.0 0.29 5.98 0.31 0.74 0.56 0.30<br />
P4 Core 75 50.2 0.03 30.4 0.74 0.29 15.0 2.80 0.05 0.20 99.8 225.9 0.11 8.49 0.31 0.62 0.28 0.33<br />
P4 Rim 67 52.5 0.03 28.5 0.95 0.40 13.5 3.67 0.05 0.12 99.7 161.7 0.13 3.63 0.33 0.69 0.33 0.20<br />
continued...
45<br />
Crystal<br />
Zone<br />
An<br />
(mol%)<br />
64R2-X1 xenolith<br />
TABLE 2.1<br />
Continued<br />
SiO2 TiO2 Al2O3 FeO T MgO CaO Na2O K2O P2O5 Total Sr Y Ba La Ce Nd Eu<br />
Exterior 71 51.7 0.03 29.4 0.99 0.28 14.9 3.29 0.03 0.16 100.7 157.1 0.13 2.70 0.22 0.37 0.45 0.35<br />
Exterior 79 49.9 - 30.5 0.63 0.28 16.2 2.43 0.01 0.16 100.1 169.3 0.13 3.04 0.21 0.40 0.24 0.39<br />
Interior 80 49.3 0.02 30.5 0.63 0.25 16.2 2.24 0.01 0.18 99.3 165.9 0.21 2.90 0.22 0.37 0.53 0.38<br />
Interior 84 48.6 0.01 30.4 0.62 0.22 17.2 1.84 0.01 0.17 99.1 181.6 0.21 3.10 0.16 0.43 0.08 0.41<br />
Interior 82 49.3 0.02 31.0 0.61 0.25 16.9 2.06 0.02 0.18 100.3 168.2 0.20 2.66 0.25 0.36 0.28 0.32<br />
Interior 82 49.0 0.02 30.7 0.56 0.25 16.6 1.95 0.01 0.18 99.7 161.2 0.20 3.23 0.16 0.40 0.19 0.21<br />
Interior 82 48.7 0.01 31.5 0.53 0.26 16.6 1.96 0.02 0.17 99.8 162.0 0.19 2.48 0.18 0.38 0.39 0.44<br />
Interior 82 48.5 0.02 31.1 0.58 0.27 16.5 2.03 0.02 0.20 99.1 168.7 0.19 2.77 0.10 0.41 0.32 0.41<br />
Resorp. 83 48.0 - 31.9 0.57 0.24 16.7 1.93 0.03 0.21 99.5 167.1 0.30 2.53 0.14 0.38 0.21 0.35<br />
Interior 80 50.0 - 31.0 0.54 0.26 15.6 2.21 0.02 0.17 99.8 155.9 0.16 2.45 0.21 0.30 0.49 0.36<br />
64R2 phenocrysts P1-P4<br />
continued...
46<br />
Crystal<br />
Zone<br />
An<br />
(mol%)<br />
TABLE 2.1<br />
Continued<br />
SiO2 TiO2 Al2O3 FeO T MgO CaO Na2O K2O P2O5 Total Sr Y Ba La Ce Nd Eu<br />
P1 Core 69 52.6 0.02 29.2 0.53 0.22 14.4 3.61 0.02 0.15 100.6 186.7 0.17 4.06 0.18 0.40 0.31 0.39<br />
P1<br />
Interm.<br />
P1<br />
Interm.<br />
78 50.7 0.02 30.2 0.67 0.29 16.3 2.56 - 0.14 100.7 172.6 0.13 2.88 0.10 0.33 0.20 0.18<br />
74 51.5 0.03 29.1 0.67 0.29 15.1 2.99 - 0.15 99.7 170.0 0.12 5.38 0.15 0.41 0.17 0.25<br />
P1 Rim 67 52.5 0.04 28.3 0.96 0.30 13.9 3.82 0.05 0.14 100.0 - - - - - - -<br />
P2 Core 83 48.8 0.02 31.4 0.66 0.22 16.5 1.84 - 0.15 99.60 195.2 0.48 4.91 0.43 0.53 0.48 0.43<br />
P2 Rim 79 50.0 0.03 29.8 0.67 0.28 16.2 2.42 0.02 0.13 99.6 - - - - - - -<br />
P4 Core 66 53.2 0.02 27.8 0.50 0.23 13.5 3.83 0.03 0.10 99.2 - - - - - - -<br />
P4<br />
Interm.<br />
P4<br />
Interm.<br />
79 48.2 0.04 30.3 0.68 0.25 16.1 2.34 0.01 0.18 99.6 167.9 0.38 2.63 0.18 0.70 0.85 0.27<br />
74 51.0 0.04 28.8 0.73 0.30 14.8 3.26 0.03 0.17 99.9 182.7 0.38 4.81 0.32 0.72 0.44 0.21<br />
P4 Rim 65 52.6 0.06 27.7 1.04 0.26 13.3 3.99 0.03 0.11 99.0 - - - - - - -<br />
P3 Core 78 50.3 0.01 29.8 0.68 0.29 15.8 2.39 0.03 0.13 99.5 183.0 0.26 3.27 0.09 0.45 0.14 0.13<br />
P3<br />
Interm.<br />
75 51.0 0.03 29.4 0.71 0.29 15.8 2.85 0.02 0.16 100.3 180.9 0.27 4.87 0.38 0.44 0.28 0.34<br />
continued...
47<br />
Crystal<br />
Zone<br />
An<br />
(mol%)<br />
807-X1 xenolith<br />
TABLE 2.1<br />
Continued<br />
SiO2 TiO2 Al2O3 FeO T MgO CaO Na2O K2O P2O5 Total Sr Y Ba La Ce Nd Eu<br />
Core 83 47.0 - 31.30 0.78 0.26 18.7 2.02 0.18 - 100.2 - - - - - - -<br />
Core 84 47.0 - 31.50 0.65 0.22 18.9 1.88 0.14 - 100.2 - - - - - - -<br />
Core 84 47.2 - 31.30 0.89 0.29 18.6 1.94 0.11 - 100.2 - - - - - - -<br />
Interm. 83 47.4 - 31.30 0.71 0.22 18.6 2.02 0.15 - 100.5 - - - - - - -<br />
Interm. 83 46.6 - 31.50 0.72 0.27 18.9 2.14 0.05 - 100.2 - - - - - - -<br />
Interm. 83 47.1 - 31.30 0.76 0.27 18.9 2.06 0.11 - 100.5 - - - - - - -<br />
Rim 74 49.7 - 28.90 0.68 0.28 16.2 2.99 0.19 - 98.9 - - - - - - -<br />
Rim 71 50.8 - 28.30 0.79 0.32 15.6 3.41 0.16 - 99.3 - - - - - - -<br />
Rim 74 50.1 - 29.10 0.73 0.29 16.0 2.97 0.20 - 99.4 - - - - - - -<br />
Average detection limits<br />
continued...
48<br />
Crystal<br />
Zone<br />
An<br />
(mol%)<br />
TABLE 2.1<br />
Continued<br />
SiO2 TiO2 Al2O3 FeO T MgO CaO Na2O K2O P2O5 Total Sr Y Ba La Ce Nd Eu<br />
12 µm pit - - - - - - - - - - - 0.33 0.14 0.10 0.07 0.03 0.05 0.06<br />
25 µm pit - - - - - - - - - - - 0.12 0.06 0.07 0.04 0.03 0.03 0.03<br />
NIST<br />
614 4<br />
measured<br />
NIST<br />
614 error<br />
measured<br />
NIST 614<br />
recommended<br />
- - - - - - - - - - - 44.7 0.76 3.25 0.73 0.81 0.73 0.73<br />
- - - - - - - - - - - ±1.9 ±0.06 ±0.27 ±0.02 ±0.1 ±0.04 ±0.03<br />
- - - - - - - - - - - 45.1 0.80 3.13 0.71 0.78 0.75 0.73<br />
1 Interm. = Intermediate area between core and rim of largest discernible plagioclase crystal in each xenolith.<br />
2 Fe reported as total FeO<br />
3 Major elements in wt.% and trace elements in ppm<br />
4 NIST 614 values reported are the average of ten measurements
2.5 Results<br />
2.5.1 Plagioclase Zoning Patterns<br />
2.5.1.1 Malaita Xenolith(ML-X1)<br />
Plagioclase cumulate xenoliths from Malaita are round to subround, generally<br />
1-8 cm in diameter, consist entirely of interlocking plagioclase crystals, and are<br />
generally moderately altered (Figs. 2.3a-d). Alteration is evident as fracturing<br />
and discoloration of xenolith crystals (e.g., Fig. 2.3). The xenolith I examined<br />
from Malaita (ML-X1) is larger than xenoliths from Site 1183 or 807 (6.7 cm<br />
diameter, roughly twice the diameter than the largest Site 1183 xenolith from Unit<br />
7). ML-X1 contains zones of small devitrified melt inclusions oriented parallel to<br />
oscillatory zoning and is completely altered along its rim (Figs. 2.3c,e). It also<br />
contains small olivine (now completely altered to clay minerals) and clinopyroxene<br />
grains along its margins (Fig. 2.3c). I collected major and trace element data from<br />
the least altered interior section of ML-X1, which exhibited oscillatory zonation<br />
(Figs. 2.3b, 2.6a).<br />
2.5.1.2 Site 1183 Xenoliths<br />
The three rounded xenoliths I examined from Site 1183 are texturally similar,<br />
and Mahoney et al. [91] suggested they have a cumulate origin (Figs. 2.2a,b).<br />
The Site 1183 xenoliths contain only sparse melt inclusions, are primarily oscil-<br />
latory zoned, and are 0.5-3 cm in diameter [91] (Fig. 2.2). There are distinct<br />
resorption/reaction rims on each of the crystals that are common to the entire<br />
xenolith rather than individual crystals (Figs. 2.2e,f). I refer to these common<br />
rim sections as xenolith exteriors (see Fig. 2.2e). All three Site 1183 xenoliths<br />
contain clinopyroxene and completely altered olivine grains in similar proportions<br />
49
along the xenolith margins (e.g., Figs. 2.2d,f). Similarly, all three xenoliths con-<br />
tain patches of devitrified glass and minor clinopyroxene that appears to have<br />
been almost completely melted out (Mahoney et al., 2001; Fig. 2.2c). The Site<br />
1183 xenolith crystals I examined contain few resorption features, exceptions are<br />
the core region of the Unit 7 xenolith crystal (Fig. 2.2b) and a small resorption<br />
surface in the Unit 6 xenolith (Fig. 2.2e). Selected major and trace element data<br />
collected along core to rim transects in each crystal are displayed in Table 2.2 (see<br />
also Figs. 2.6b-d).<br />
2.5.1.3 Site 1183 Phenocrysts<br />
Sano and Yamashita [123] documented two types of zoned plagioclase phe-<br />
nocrysts, Types I and II, in Kwaimbaita basalts from Site 1183 and other ODP<br />
drill sites. Type I crystals are generally euhedral, exhibit normal zonation, and<br />
have An73 to An78 cores (e.g., Fig. 2.5a). Type II crystals have complex zon-<br />
ing, exhibit reverse or oscillatory zonations, and have cores in the An73 to An78<br />
range that are commonly surrounded by An80 to An84 zones [123] (e.g., Fig. 2.5b).<br />
Representative examples of the different zoning types are shown in Figure 2.5. I<br />
observed similar zoning patterns in the Units 5B, 6, and 7 Kwaimbaita basalts<br />
from Site 1183. Basalts from Units 5B and 6 contain primarily Type I normal<br />
zoned phenocrysts, whereas the Unit 7 basalt I examined contains a mixture of<br />
Type I normal and Type II reverse zoned phenocrysts (Table 2.1). Plagioclase phe-<br />
nocrysts from Unit 7 exhibit other morphological differences from Units 5B and<br />
6 phenocrysts. For example, 64R2P3 from Unit 7 is part of a plagioclase-olivine<br />
glomerocryst and has a sieve textured core (Fig. 2.5c). Olivine was entirely re-<br />
placed with clay minerals and was identified by its morphology. Melt inclusions<br />
50
Figure 2.6. Major and trace element data were collected along a traverse<br />
from interior to rim (i.e., exterior). Locations LA-ICP-MS analysis sites are<br />
illustrated (labeled LA) along the measured core to rim An profile of each<br />
plagioclase crystal. A) Interior section of xenolith crystal ML-X1, Malaita;<br />
B) Xenolith crystal 59R2X1, ODP Site 1183 Unit 5B (192-1183A-59R2<br />
112-117 cm piece #10A); C) Xenolith crystal 63R2X1, ODP Site 1183 Unit 6<br />
(192-1183A-63R2 25-27 cm piece #4); D) Xenolith crystal 64R2X1, ODP<br />
Site 1183 Unit 7 (192-1183A-64R2 116-120 cm piece #9B); E) Xenolith<br />
crystal 807-X1, ODP Site 807 (130-807C-93R-1-137-139).<br />
51
are more abundant in phenocrysts from Unit 7 relative to Units 5B and 6 (e.g.,<br />
64R2P1; Fig. 2.5d). Unit 7 basalts also contain plagioclase-clinopyroxene glome-<br />
rocrysts and partially resorbed strained clinopyroxene xenocrysts [91].<br />
2.5.1.4 Site 807 Xenolith (807-X1)<br />
Plagioclase xenoliths, although smaller and commonly in the form of glom-<br />
erocrysts, were noted in Kwaimbaita basalts from ODP Site 807 [93, 94]. The<br />
subround xenolith I examined from the Site 807 (807-X1) has a similar morphol-<br />
ogy to the larger xenoliths from Site 1183 and Malaita but is more disaggregated<br />
(Fig. 2.3e). Xenolith 807-X1 is composed primarily of interlocking plagioclase<br />
52
grains and contains small clinopyroxene and completely altered olivine grains in<br />
similar proportions along its margins (130-807C-93R-1-137-139; Unit 4G; 1525.8<br />
mbsf; [82]; Figs. 2.3e,f). Major and minor element data only are reported in Ta-<br />
ble 2.1 for selected points sampled along a transect from the core area to the rim<br />
of a single large xenolith crystal (Fig. 2.6e).<br />
53
54<br />
Crystal Zone 5<br />
ML-X1 xenolith<br />
TABLE 2.2<br />
CALCULATED PARTITION COEFFICIENTS <strong>AND</strong> EQUILIBRIUM<br />
LIQUID COMPOSITIONS<br />
An D Sr D Ti D Y D Ba D La D Ce D Nd D Eu D Mg D Fe Sr Ti Y Ba La Ce Nd Eu Mg# 6 Ba/Sr La/Y Sr/Ti<br />
Interior 85 1.26 0.04 0.03 0.1 0.17 0.11 0.12 0.43 0.047 0.065 136.8 3331 8 22.08 1.41 5.52 - 0.58 0.3 0.16 0.18 0.04<br />
Interior 85 1.24 0.04 0.03 0.1 0.17 0.1 0.11 0.43 0.047 0.065 130.5 1991 7.05 29.68 0.99 2.37 3.3 0.78 0.31 0.23 0.14 0.07<br />
Interior 85 1.24 0.04 0.03 0.1 0.17 0.11 0.11 0.43 0.047 0.065 142.1 3664 7.51 18.91 1.19 3.49 3.39 0.81 0.32 0.13 0.16 0.04<br />
Interior 86 1.23 0.04 0.03 0.1 0.17 0.1 0.11 0.43 0.047 0.065 152.3 2036 5.15 21.85 1.52 3.49 6.71 0.97 0.31 0.14 0.26 0.07<br />
Interior 84 1.28 0.04 0.03 0.11 0.17 0.11 0.12 0.43 0.047 0.065 135 2147 - 27.01 2.32 3.4 3.29 1.1 0.33 0.2 - 0.06<br />
Interior 86 1.21 0.04 0.02 0.1 0.17 0.1 0.11 0.43 0.047 0.065 153.6 4392 17.51 32.31 1.81 5.25 2.03 - 0.31 0.21 0.1 0.03<br />
59R2-X1 xenolith<br />
Exterior 66 1.99 0.06 0.06 0.24 0.2 0.14 0.16 0.43 0.047 0.065 - 2998 - - - - - - 0.18 - - -<br />
Exterior 75 1.61 0.05 0.04 0.16 0.19 0.12 0.14 0.43 0.047 0.065 140.6 9313 4.76 30.42 2.33 5.26 3.6 1.13 0.32 0.22 0.49 0.02<br />
Interior 81 1.39 0.04 0.03 0.13 0.18 0.11 0.12 0.43 0.047 0.065 - 5985 - - - - - - 0.3 - - -<br />
continued...
55<br />
TABLE 2.2<br />
Continued<br />
Crystal Zone An D Sr D Ti D Y D Ba D La D Ce D Nd D Eu D Mg D Fe Sr Ti Y Ba La Ce Nd Eu Mg# Ba/Sr La/Y Sr/Ti<br />
Interior 82 1.35 0.04 0.03 0.12 0.17 0.11 0.12 0.43 0.047 0.065 148.2 7881 4.55 32.29 1.56 4.26 2.51 1.04 0.3 0.22 0.34 0.02<br />
Interior 83 1.3 0.04 0.03 0.11 0.17 0.11 0.12 0.43 0.047 0.065 168.5 3953 6.58 41.83 1.29 5.2 4.38 1.05 0.29 0.25 0.2 0.04<br />
Interior 82 1.33 0.04 0.03 0.12 0.17 0.11 0.12 0.43 0.047 0.065 152.6 2929 4.17 31.19 1.15 5.48 3.5 1.09 0.31 0.2 0.28 0.05<br />
Center/Core 83 1.3 0.04 0.03 0.11 0.17 0.11 0.12 0.43 0.047 0.065 158.5 2461 6.79 45.33 1.79 5.36 5.42 0.79 0.29 0.29 0.26 0.06<br />
59R2 phenocrysts P1-P4<br />
P1 Rim 71 1.76 0.05 0.05 0.19 0.19 0.13 0.14 0.43 0.047 0.065 115 5117 6.45 31.46 1.81 5.44 5.38 0.89 0.3 0.27 0.28 0.02<br />
P1 Core 74 1.63 0.05 0.04 0.17 0.19 0.12 0.14 0.43 0.047 0.065 114.8 6525 3.22 25.56 1.92 4.35 3.04 0.99 0.29 0.22 0.6 0.02<br />
P2 Rim 70 1.79 0.05 0.05 0.2 0.19 0.13 0.15 0.43 0.047 0.065 115.4 8039 4.79 26.36 2.01 5.4 3.13 1.09 0.3 0.23 0.42 0.01<br />
P2 Core 73 1.68 0.05 0.04 0.18 0.19 0.13 0.14 0.43 0.047 0.065 116.6 5962 8.2 25.85 2.42 4.14 3.35 0.9 0.33 0.22 0.3 0.02<br />
P3 Center 69 1.84 0.05 0.05 0.21 0.2 0.13 0.15 0.43 0.047 0.065 - 3597 - - - - - - 0.3 - - -<br />
P4 Center 67 1.97 0.06 0.05 0.24 0.2 0.14 0.16 0.43 0.047 0.065 - 2998 - - - - - - 0.31 - - -<br />
continued...
56<br />
TABLE 2.2<br />
Continued<br />
Crystal Zone An D Sr D Ti D Y D Ba D La D Ce D Nd D Eu D Mg D Fe Sr Ti Y Ba La Ce Nd Eu Mg# Ba/Sr La/Y Sr/Ti<br />
63R2-X1 xenolith<br />
Exterior 79 1.4 0.04 0.03 0.13 0.18 0.11 0.12 0.43 0.047 0.065 127.9 7685 8.64 24.02 1.14 3.83 4.14 0.52 0.29 0.19 0.13 0.02<br />
Exterior 77 1.51 0.05 0.04 0.15 0.18 0.12 0.13 0.43 0.047 0.065 119.4 6671 6.28 29.48 0.71 2.47 1.83 0.65 0.31 0.25 0.11 0.02<br />
Exterior 81 1.37 0.04 0.03 0.12 0.18 0.11 0.12 0.43 0.047 0.065 123.3 5807 11.18 27.88 1.29 2.94 0.33 0.5 0.28 0.23 0.11 0.02<br />
Exterior 75 1.63 0.05 0.04 0.17 0.19 0.12 0.14 0.43 0.047 0.065 101.1 5033 5.39 20.65 1.2 2.91 2.47 0.62 0.32 0.2 0.24 0.02<br />
Interm. 85 1.25 0.04 0.03 0.1 0.17 0.11 0.12 0.43 0.047 0.065 138 1435 7.41 25.45 1.08 3.24 2.58 0.61 0.27 0.18 0.15 0.1<br />
Resorp. 81 1.38 0.04 0.03 0.12 0.18 0.11 0.12 0.43 0.047 0.065 124.9 6266 3.27 23.56 1.46 2.39 2.64 0.61 0.31 0.19 0.45 0.02<br />
Interm. 85 1.25 0.04 0.03 0.1 0.17 0.11 0.12 0.43 0.047 0.065 142.3 9791 5.43 25.59 1 3.89 2.38 0.65 0.29 0.18 0.18 0.01<br />
Interm. 85 1.25 0.04 0.03 0.1 0.17 0.11 0.12 0.43 0.047 0.065 137 - 6.79 27.84 0.78 3.15 1.45 0.9 0.27 0.2 0.12 -<br />
Interm. 82 1.33 0.04 0.03 0.12 0.17 0.11 0.12 0.43 0.047 0.065 129.3 - 6.11 24.27 1.01 3.52 2.58 0.65 0.3 0.19 0.16 -<br />
Interm. 83 1.29 0.04 0.03 0.11 0.17 0.11 0.12 0.43 0.047 0.065 132.2 3055 4.78 27.06 0.95 3.6 2.8 0.52 0.3 0.2 0.2 0.04<br />
Interm. 84 1.27 0.04 0.03 0.11 0.17 0.11 0.12 0.43 0.047 0.065 133.5 4651 9.05 27.45 1.11 5.34 3.56 0.57 0.3 0.21 0.12 0.03<br />
Interm. 85 1.24 0.04 0.03 0.1 0.17 0.11 0.11 0.43 0.047 0.065 137 4422 5.76 27.93 1.1 4.7 1.92 0.82 0.3 0.2 0.19 0.03<br />
continued...
57<br />
TABLE 2.2<br />
Continued<br />
Crystal Zone An D Sr D Ti D Y D Ba D La D Ce D Nd D Eu D Mg D Fe Sr Ti Y Ba La Ce Nd Eu Mg# Ba/Sr La/Y Sr/Ti<br />
63R2 phenocrysts P1-P4<br />
P1 Interm. 76 1.54 0.05 0.04 0.15 0.18 0.12 0.13 0.43 0.047 0.065 153.6 6571 6.69 56.62 2.36 5.97 1.31 0.57 0.3 0.37 0.35 0.02<br />
P1 Interm. 74 1.65 0.05 0.04 0.17 0.19 0.12 0.14 0.43 0.047 0.065 105 5171 3.02 27.06 0.73 3.96 2.03 0.23 0.28 0.26 0.24 0.02<br />
P2 Center 77 1.54 0.05 0.04 0.15 0.18 0.12 0.13 0.43 0.047 0.065 115.5 5876 6.09 32.24 1.68 4.59 0.67 0.75 0.29 0.28 0.28 0.02<br />
P3 Rim 68 1.91 0.06 0.05 0.22 0.2 0.14 0.15 0.43 0.047 0.065 102 4513 5.58 26.69 1.55 5.47 3.67 0.7 0.36 0.26 0.28 0.02<br />
P4 Core 75 1.62 0.05 0.04 0.17 0.19 0.12 0.14 0.43 0.047 0.065 139.8 5920 2.71 51.41 1.64 5.03 2.09 0.76 0.29 0.37 0.61 0.02<br />
P4 Rim 67 1.96 0.06 0.05 0.23 0.2 0.14 0.15 0.43 0.047 0.065 82.7 4345 2.41 15.57 1.64 5.02 2.15 0.46 0.31 0.19 0.68 0.02<br />
64R2-X1 xenolith<br />
Rim 71 1.76 0.05 0.05 0.19 0.19 0.13 0.14 0.43 0.047 0.065 89.5 6605 2.96 14.05 1.16 2.82 3.09 0.83 0.23 0.16 0.39 0.0<br />
1 Rim 79 1.46 0.04 0.03 0.14 0.18 0.12 0.13 0.43 0.047 0.065 115.9 757 3.75 22.06 1.18 3.47 1.91 0.91 0.32 0.19 0.31 0.15<br />
Interior 80 1.51 0.04 0.03 0.13 0.18 0.11 0.12 0.43 0.047 0.065 117.4 4832 6.43 22.41 1.23 3.23 4.23 0.87 0.3 0.19 0.19 0.02<br />
continued...
58<br />
TABLE 2.2<br />
Continued<br />
Crystal Zone An D Sr D Ti D Y D Ba D La D Ce D Nd D Eu D Mg D Fe Sr Ti Y Ba La Ce Nd Eu Mg# Ba/Sr La/Y Sr/Ti<br />
Interior 84 1.29 0.04 0.03 0.11 0.17 0.11 0.12 0.43 0.047 0.065 141.2 3288 7.72 28.37 0.92 3.93 0.68 0.96 0.28 0.2 0.12 0.04<br />
Interior 82 1.35 0.04 0.03 0.12 0.17 0.11 0.12 0.43 0.047 0.065 124.9 5056 6.62 22.4 1.41 3.26 2.31 0.73 0.31 0.18 0.21 0.02<br />
Interior 82 1.34 0.04 0.03 0.12 0.17 0.11 0.12 0.43 0.047 0.065 120.2 5862 6.9 27.39 0.92 3.64 1.57 0.48 0.29 0.23 0.13 0.02<br />
Interior 82 1.33 0.04 0.03 0.12 0.17 0.11 0.12 0.43 0.047 0.065 121.6 3332 6.61 21.33 1.03 3.47 3.21 1.03 0.34 0.18 0.16 0.04<br />
Interior 82 1.35 0.04 0.03 0.12 0.17 0.11 0.12 0.43 0.047 0.065 124.7 3900 6.41 23.1 0.58 3.64 2.63 0.94 0.33 0.19 0.09 0.03<br />
Interior 83 1.32 0.04 0.03 0.12 0.17 0.11 0.12 0.43 0.047 0.065 126.2 - 10.22 22 0.83 3.43 1.76 0.81 0.31 0.17 0.08 -<br />
Interior 80 1.43 0.04 0.03 0.13 0.18 0.11 0.13 0.43 0.047 0.065 109.2 - 4.83 18.55 1.15 2.6 3.88 0.83 0.34 0.17 0.24 -<br />
64R2 phenocrysts P1-P4<br />
P1 Core 69 1.87 0.06 0.05 0.21 0.2 0.13 0.15 0.43 0.047 0.065 100 4378 3.35 18.91 0.9 2.99 2.05 0.91 0.31 0.19 0.27 0.02<br />
P1 Interm. 78 1.49 0.05 0.03 0.14 0.18 0.12 0.13 0.43 0.047 0.065 115.9 4822 3.73 20.18 0.57 2.8 1.58 0.41 0.32 0.17 0.15 0.02<br />
P1 Interm. 74 1.66 0.04 0.04 0.17 0.19 0.13 0.14 0.43 0.047 0.065 102.6 6897 2.87 31.09 0.79 3.24 1.19 0.59 0.32 0.3 0.29 0.01<br />
P2 Core 83 1.3 0.04 0.03 0.11 0.17 0.11 0.12 0.43 0.047 0.065 150.1 4125 17.18 44.03 2.5 4.87 4.03 0.99 0.26 0.29 0.15 0.04<br />
continued...
59<br />
TABLE 2.2<br />
Continued<br />
Crystal Zone An D Sr D Ti D Y D Ba D La D Ce D Nd D Eu D Mg D Fe Sr Ti Y Ba La Ce Nd Eu Mg# Ba/Sr La/Y Sr/Ti<br />
P2 Rim 72 1.7 0.05 0.04 0.18 0.19 0.13 0.14 0.43 0.047 0.065 - 5216 - - - - - - 0.31 - - -<br />
P4 Interm. 79 1.44 0.04 0.03 0.13 0.18 0.12 0.13 0.43 0.047 0.065 116.5 8180 11.37 19.58 1 6.04 6.75 0.62 0.28 0.17 0.09 0.01<br />
P4 Interm. 74 1.66 0.05 0.04 0.17 0.19 0.13 0.14 0.43 0.047 0.065 110.2 7640 9.09 27.82 1.68 5.77 3.2 0.5 0.31 0.25 0.18 0.01<br />
P3 Core 78 1.47 0.04 0.03 0.14 0.18 0.12 0.13 0.43 0.047 0.065 124.7 1576 7.51 23.57 0.5 3.89 1.1 0.31 0.31 0.19 0.07 0.08<br />
P3 Interm. 75 1.58 0.05 0.04 0.16 0.18 0.12 0.13 0.43 0.047 0.065 114.2 6477 7.05 30.56 2.07 3.62 2.11 0.8 0.3 0.27 0.29 0.02<br />
807-X1 xenolith<br />
Core 83 - - - - - - - - 0.047 0.065 - - - - - - - - 0.26 - - -<br />
Core 84 - - - - - - - - 0.047 0.065 - - - - - - - - 0.27 - - -<br />
Core 84 - - - - - - - - 0.047 0.065 - - - - - - - - 0.26 - - -<br />
Interm. 83 - - - - - - - - 0.047 0.065 - - - - - - - - 0.25 - - -<br />
Interm. 83 - - - - - - - - 0.047 0.065 - - - - - - - - 0.29 - - -<br />
Interm. 83 - - - - - - - - 0.047 0.065 - - - - - - - - 0.28 - - -<br />
continued...
60<br />
TABLE 2.2<br />
Continued<br />
Crystal Zone An D Sr D Ti D Y D Ba D La D Ce D Nd D Eu D Mg D Fe Sr Ti Y Ba La Ce Nd Eu Mg# Ba/Sr La/Y Sr/Ti<br />
Rim 74 - - - - - - - - 0.047 0.065 - - - - - - - - 0.3 - - -<br />
Rim 71 - - - - - - - - 0.047 0.065 - - - - - - - - 0.3 - - -<br />
Rim 74 - - - - - - - - 0.047 0.065 - - - - - - - - 0.29 - - -<br />
5 Interm. = Intermediate area between core and rim of largest discernible plagioclase crystal in each xenolith<br />
6 Mg# = [Mg/(Mg+Fe)]
2.5.2 Measured compositions<br />
2.5.2.1 Major Elements<br />
The interior sections of xenolith crystals have greater An content (An80-An86)<br />
than the xenolith exteriors and phenocrysts, which display a similar range of<br />
An content (An65-An83) (see Table 2.1 and Figs. 2.7,2.8). Phenocrysts from Site<br />
1183 Units 5B, 6, and 7 trend to lower An (An65−73) content than phenocrysts<br />
reported by Sano and Yamashita [123] (An73−78) (Table 2.1). The phenocrysts<br />
contain FeOT, MgO, and Ti within the ranges exhibited by xenolith interiors, but<br />
do however extend to higher abundances of these elements (see Table 2.1). In<br />
Table 2.1 I display representative major and trace element data of both xenolith<br />
crystals and phenocrysts. Note that Ti was measured by EPMA. A spread sheet<br />
of all major element data is available in an online archive.<br />
2.5.2.2 Trace Elements<br />
Selected trace element abundances measured in xenolith crystals and phe-<br />
nocrysts are plotted against mole percent An of plagioclase in Figure 2.7 for sam-<br />
ples from Malaita, Site 1183, and Site 807. With the exception of Eu, a general<br />
negative correlation of element concentration with An content is apparent, which is<br />
a likely result of the greater ease of trace element partitioning into the more elastic<br />
structure of the relatively albite-rich plagioclase (e.g., [10]; Fig. 2.7). Phenocrysts<br />
contain concentrations of La, Ce, and Nd that overlap the ranges exhibited by<br />
xenolith interiors, but extend to higher abundances (see Table 2.1). Xenolith<br />
crystals and phenocrysts contain similar Y and Eu abundances (Fig. 2.7).<br />
61
Figure 2.7. Measured major and trace element data versus An content of<br />
xenolith plagioclase crystals and plagioclase phenocrysts from: A) ML-X1<br />
(Malaita) and 807-X1(130-807C-93R-1-137-139); B) ODP Site 1183 Unit 5B<br />
xenolith 59R2X1 (192-1183A-59R2 112-117 cm piece #10A); C) ODP Site<br />
1183 Unit 6 xenolith 63R2X1 (192-1183A-63R2 25-27 cm piece #4); D) ODP<br />
Site 1183 Unit 7 xenolith 64R2X1 (192-1183A-64R2 116-120 cm piece #9B).<br />
Resorption features examined in the Unit 6 and Unit 7 xenolith crystals are<br />
noted in columns C and D. Average analytical uncertainties (analytical<br />
precision relative 1σ) calculated for each segment of signal integrated for<br />
each element are displayed as error bars in column A. Ti and FeOT measured<br />
by EPMA, all others measured by LA-ICP-MS.<br />
62
Figure 2.8. Measured MgO (wt %) abundance versus An content of all<br />
xenolith plagioclase crystals and plagioclase phenocrysts examined in this<br />
study. All data were obtained by EPMA. Magnesium partitioning is weakly<br />
affected or unaffected by plagioclase composition e.g., [7]. I suggest low<br />
pressure (depth range shallower than 7 km) crystallization of relatively<br />
primitive OJP magmas can generate low MgO, An-rich plagioclase.<br />
2.5.3 Parental magma compositions<br />
2.5.3.1 Major Elements<br />
Parent magmas of the An-rich xenolith interiors tend to have lower Ti at a<br />
given Mg number (Mg/[Mg+Fe]) than phenocryst parent magmas. On a plot of<br />
Mg number vs. Ti, phenocryst parent magmas overlap the Kwaimbaita whole-rock<br />
basalt field, whereas the An-rich xenolith interiors trend below the fields defined<br />
by OJP basalts (Fig. 2.9a; Table 2.3).<br />
63
2.5.3.2 Trace Elements<br />
It is difficult to accurately quantify the amount of error introduced by chosen<br />
or calculated partition coefficients. Error bars displayed in figures 2.9 and 2.10,<br />
which can be compared to analytical uncertainty displayed in figure 2.7, repre-<br />
sent the combined potential error related to analytical uncertainty and calculation<br />
of partition coefficients using uncertainty on constants reported by Bindeman et<br />
al. [7]. Parent magmas of xenolith interiors typically exhibit lower La/Y and<br />
Ba/Sr ratios and slightly higher Sr/Ti ratios than phenocryst parent magmas<br />
(Tables 2.2and2.3; Fig. 2.9). Parent magmas of the An-rich xenolith interiors are<br />
also enriched in Sr, Eu, and Y and relatively depleted in Ba, La, Ce, and Nd rela-<br />
tive to phenocryst parent magmas (Tables 2.2, 2.3; Fig. 2.10). Parent magmas of<br />
both xenolith crystals and phenocrysts have Sr, Ba, and Eu abundances that over-<br />
lap published Kwaimbaita and Kroenke basalt whole-rock values, but generally<br />
have lower La, Ce, and Nd abundances (see Table 2.3). Given the potential error<br />
in calculated D values (compare error bars in Figs. 2.7 and 2.10), OJP plagioclase<br />
parent magmas plot in a reasonably consistent manner in terms of La/Y, Sr/Ti,<br />
and Ba/Sr ratios, Mg number, Eu and Sr, compared to the Kroenke, Kwaim-<br />
baita, and Singgalo whole-rock basalt fields (Fig. 2.9; Table 2.3). For example,<br />
the compositions of parent magmas of xenolith interiors from Malaita and Unit<br />
7 of Site 1183 overlap Kroenke and Kwaimbaita basalt fields (see Fig. 2.9). Par-<br />
ent magma compositions of xenolith exteriors and phenocrysts from all three Site<br />
1183 Units and xenolith interior parent magmas from Units 5B and 6 consistently<br />
trend outside of the fields defined by the whole-rock compositions (Fig. 2.9). Par-<br />
ent magmas of the core and rim of phenocryst 63R2P4, the core of 59R2P1, the<br />
rim of 59R2P2, and an exterior zone of xenolith 59R2X-1 are unique, because they<br />
64
have much higher La/Y ratios than whole-rock data or parent magmas of all other<br />
xenolith and phenocryst zones examined (see Figs. 2.9, 2.10). A zone within the<br />
Unit 6 xenolith associated with a resorption feature has a similarly evolved parent<br />
magma and is described in the section that follows.<br />
65
Figure 2.9. Trace element ratio plots for parent magmas of OJP plagioclase<br />
phenocrysts and xenolith plagioclase crystals. Error bars represent the total<br />
potential error obtained by combining the uncertainty of LA-ICP-MS<br />
measurements and that inherent in calculating the partition coefficients (D)<br />
using uncertainties reported in Bindeman et al. [7] using standard error<br />
propagation. Fields defined by published OJP whole-rock basalt data are<br />
displayed [46, 133]. A) Ti vs Mg # [Mg + (Mg+Fe)] data show no distinct<br />
differences between xenolith crystals and phenocrysts, except that An-rich<br />
crystals tend to have lower Ti and trend to greater Mg#; B) Sr/Ti vs. La/Y:<br />
note phenocryst parent magmas extend to higher La/Y ratios than higher<br />
An xenolith crystals; C) La/Y vs. Ba/Sr: vectors defined by clinopyroxene<br />
and plagioclase crystallization of relatively primitive Kroenke basalt are<br />
shown as labeled arrows. For illustrative purposes, the head of the arrow on<br />
the clinopyroxene vector corresponds to a crystallinity of ∼70%; D) La/Y vs.<br />
Eu and vectors defined by clinopyroxene and plagioclase crystallization of<br />
relatively primitive Kroenke basalt. Again, the head of the arrow on the<br />
clinopyroxene vector corresponds to a crystallinity of ∼70%. Parent magmas<br />
of xenolith crystals and phenocrysts from Site 1183 Unit 7 extend to lower<br />
Eu and La/Y.<br />
66
67<br />
Sample An<br />
(mol%)<br />
Ranges in Published Whole-Rock and Glass Data<br />
Kroenke - 8.9-<br />
10.1<br />
Kwaimbaita - 8.6-<br />
12.5<br />
Singgalo - 10.7-<br />
13.5<br />
TABLE 2.3<br />
RANGES <strong>OF</strong> TRACE ELEMENTS IN PLAGIOCLASE,<br />
WHOLE-ROCK DATA, <strong>AND</strong> INFERRED PARENT MAGMAS<br />
FeO T MgO Ti Sr Y Ba La Ce Nd Eu Mg# Ba/Sr La/Y Sr/Ti<br />
7.1-<br />
13.6<br />
5.3-<br />
10.7<br />
Ranges Measured in OJP Plagioclase Crystals<br />
Xenolith Int. 80-86 0.52-<br />
0.89<br />
Xenolith Ext. 66-81 0.60-<br />
1.01<br />
Phenocrysts 65-83 0.50-<br />
1.04<br />
3410-<br />
5790<br />
4760-<br />
10198<br />
6.3-8.1 6775-<br />
10611<br />
0.22-<br />
0.29<br />
0.21-<br />
0.32<br />
0.22-<br />
0.53<br />
70.7-<br />
194.3<br />
33.4-<br />
939.3<br />
116.4-<br />
207.1<br />
0-221 155.9-<br />
218.7<br />
0-266 157.1-<br />
225.7<br />
41-441 161.7-<br />
236.4<br />
Ranges in Parent Magmas Calculated from OJP Plagioclase Crystals<br />
Xenolith Int. - 8.0-<br />
13.7<br />
Xenolith Ext. - 9.2-<br />
15.5<br />
Phenocrysts - 7.7-<br />
16.0<br />
1 FeOT = Fe reported as total FeO.<br />
4.7-6.1 0-9790 109.2-<br />
168.5<br />
4.4-6.8 0-9313 89.5-<br />
140.6<br />
4.7-<br />
11.3<br />
1576-<br />
8180<br />
2 Major elements in wt.% and trace elements including Ti in ppm.<br />
82.7-<br />
153.6<br />
16.1-<br />
18.8<br />
19.9-<br />
37.1<br />
18.3-<br />
31.8<br />
0.10-<br />
0.43<br />
0.13-<br />
0.34<br />
0.11-<br />
0.48<br />
3.27-<br />
17.51<br />
2.96-<br />
11.18<br />
2.41-<br />
17.8<br />
4.65-<br />
25.63<br />
6.97-<br />
36.27<br />
15.6-<br />
133.0<br />
1.93-<br />
5.05<br />
2.70-<br />
4.97<br />
2.63-<br />
8.57<br />
18.55-<br />
45.33<br />
14.05-<br />
30.42<br />
15.57-<br />
56.62<br />
1.84-<br />
2.48<br />
2.44-<br />
5.19<br />
4.06-<br />
6.76<br />
0.10-<br />
0.39<br />
0.13-<br />
0.43<br />
5.19-<br />
5.98<br />
6.66-<br />
13.69<br />
3 Kwaimbaita, Kroenke, and Singgalo whole-rock and glass major and trace element abundances taken from [133] and [46].<br />
4 Mg# = [Mg/(Mg+total Fe)].<br />
0.09-<br />
0.46<br />
0.58-<br />
2.32<br />
0.71-<br />
2.33<br />
0.50-<br />
2.50<br />
11.0-<br />
19.6<br />
0.25-<br />
0.63<br />
0.29-<br />
0.65<br />
0.28-<br />
0.74<br />
2.37-<br />
5.53<br />
2.47-<br />
5.26<br />
2.19-<br />
6.04<br />
4.31-<br />
5.23<br />
5.58-<br />
10.98<br />
8.14-<br />
14.10<br />
0.08-<br />
0.76<br />
0.05-<br />
0.51<br />
0.09-<br />
0.85<br />
0.68-<br />
6.71<br />
0.33-<br />
4.14<br />
0.60-<br />
6.75<br />
0.59-<br />
0.69<br />
0.73-<br />
1.34<br />
1.02-<br />
1.65<br />
0.21-<br />
0.47<br />
0.22-<br />
0.49<br />
0.10-<br />
0.47<br />
0.48-<br />
1.10<br />
0.50-<br />
1.13<br />
0.36-<br />
0.53<br />
0.29-<br />
0.44<br />
0.27-<br />
0.36<br />
0.05-<br />
0.29<br />
0.03-<br />
0.39<br />
0.11-<br />
1.14<br />
0.11-<br />
0.15<br />
0.12-<br />
0.19<br />
0.18-<br />
0.29<br />
- - - -<br />
- - - -<br />
- - - -<br />
0.25-<br />
0.34<br />
0.23-<br />
0.32<br />
0-1.09 0.21-<br />
0.38<br />
0.13-<br />
0.29<br />
0.16-<br />
0.25<br />
0.17-<br />
0.37<br />
0.02-<br />
0.04<br />
0.01-<br />
0.15<br />
0.01-<br />
0.02<br />
0-0.53 0.01-<br />
0.10<br />
0.11-<br />
0.49<br />
0.07-<br />
0.68<br />
0.01-<br />
0.15<br />
0.01-<br />
0.08
2.5.4 Resorption Features in Site 1183 xenolith Crystals<br />
A resorption feature in the Unit 6 xenolith crystal 63R2-X1, identified by tex-<br />
ture, included a decrease in An content across the resorption surface towards the<br />
rim (i.e., the direction of crystal growth) from An85 to An81 (see Figs. 2.2e, 2.9, 2.10).<br />
There is no significant change in Mg number of parent magmas across this resorp-<br />
tion surface, but there is a decrease in parent magma Ti content. The parent<br />
magma of the An81 zone, which was the zone grown following resorption, had a<br />
higher La/Y and Sr/Ti, although it had less Sr, Ti, and Y, and roughly the same<br />
Ba/Sr ratio as the parent magma of the An85 zone (see Figs. 2.9, 2.10). A re-<br />
sorption feature in the Unit 7 xenolith crystal 64R2-X1, also identified by texture,<br />
included a slight increase in An content across the surface from An80 to An83 (see<br />
Fig. 2.2b). The lower An parent magma (core region) in 64R2X-1 had a higher<br />
La/Y and Sr/Ti, and again less Sr, Ti, and Y, with a similar Ba/Sr ratio and<br />
Mg# as the An83 parent magma. The An83 zone was grown following resorption<br />
(see Fig. 2.2b).<br />
2.6 Discussion<br />
2.6.1 Inferred Chemical Magma Evolution<br />
2.6.1.1 Major Elements<br />
In terms of An content, the cores of Site 1183 cumulate xenolith plagioclase<br />
crystals are generally distinct from the phenocrysts in the host basalt. Sano and<br />
Yamashita [123] suggested plagioclase in equilibrium with Kwaimbaita magmas<br />
should be An73−78. I observed phenocryst zones as low as An65 and as high as An83,<br />
whereas xenolith interiors were An80-An86 (Tables 2.2, 2.3; Figs. 2.9, 2.10). It<br />
68
Figure 2.10. Calculated major and trace element abundances of magmas<br />
that were parental to the studied plagioclase crystals plotted against the An<br />
content of each crystal from: A) ML-X1 (Malaita) and 807-X1<br />
(130-807C-93R-1-137-139); B) ODP Site 1183 Unit 5B xenolith 59R2X1<br />
(192-1183A-59R2 112-117 cm piece #10A); C) ODP Site 1183 Unit 6<br />
xenolith 63R2X1 (192-1183A-63R2 25-27 cm piece #4); D) ODP Site 1183<br />
Unit 7 xenolith 64R2X1 (192-1183A-64R2 116-120 cm piece #9B).<br />
Resorption features examined in the Unit 6 and Unit 7 xenolith crystals are<br />
noted in columns C and D. Error bars for the y-axis represent the total<br />
potential error obtained by combining the uncertainty of LA-ICP-MS<br />
measurements and that inherent in calculating the partition coefficients (D)<br />
using uncertainties reported in Bindeman et al. [7] using standard error<br />
propagation. Error bars for the x-axis represent just analytical uncertainty.<br />
69
should, however, be noted that in their experimental studies Sano and Yamashita<br />
[123] observed crystallization of An82 plagioclase from Kroenke basalts (parental<br />
to Kwaimbaita basalts) at higher temperatures (∼1200 ◦ C) and lower pressure (0.1<br />
MPa). Although the Mg# of a residual magma decreases with increased olivine<br />
fractionation, I see no evidence of olivine-dominated fractionation in xenolith or<br />
phenocryst parent magmas (i.e., no systematic difference of parent magma Mg#<br />
between the xenolith crystals and phenocrysts). The ranges of Mg# for parent<br />
magmas of both xenolith crystals and phenocrysts overlap the range observed for<br />
Kwaimbaita basalts (Fig. 2.9a; Table 2.3). Parent magmas of An65−79 phenocryst<br />
zones from the three Site 1183 basalt units are compositionally similar with regard<br />
to Mg number and Ti abundance (e.g., Fig. 2.9a). This first order observation<br />
suggests they share a common parent magma, although some lower An phenocryst<br />
zones (i.e., 63R2P4, 59R2P1, and 59R2P2) appear to have more evolved parent<br />
magmas (Fig. 2.9). However, when individual units from Site 1183 are considered,<br />
the Mg# of the parent magmas changes little with quite a large range in An<br />
content (Fig. 2.10b-d), suggesting that the Mg# is buffered.<br />
Parent magmas of the An-rich xenolith crystals and phenocrysts extend to<br />
more primitive compositions than the Kwaimbaita whole-rock composition (Ta-<br />
ble 2.2; Fig. 2.9a). This is contrary to the interpretation of Sano and Yamashita<br />
[123] that An-rich zones grew in a relatively evolved and H2O-rich boundary layer.<br />
It is thus necessary to elucidate other factors, in addition to growth in a water-rich<br />
boundary layer, which favor crystallization of An-rich plagioclase.<br />
70
TABLE 2.4<br />
MELTS CRYSTALLIZATION MODELING <strong>OF</strong> AVERAGE OJP<br />
BASALTIC GLASSES<br />
Pressure (kbar) 0.1 0.7 0.9<br />
Average Site 1183 Kwaimbaita basaltic glass<br />
Temperature( ◦ C) 1184 1188 1198<br />
An content 79 79 77<br />
Average Site 1185 Kroenke basaltic glass<br />
Temperature( ◦ C) 1200 1204 1216<br />
An content 84 83 82<br />
Glass 192-1185B-16R1, 64<br />
Temperature( ◦ C) 1217 1222 1229<br />
An content 85 84 84<br />
Average Site 1187 Kroenke basaltic glass<br />
Temperature( ◦ C) 1200 1206 1218<br />
An content 84 83 82<br />
1 Glass compositions are from [121]<br />
2 Temperature at which plagioclase starts to crystallize<br />
3 Anorthite content of the first-formed plagioclase<br />
71
2.6.1.2 An-rich OJP Plagioclase: Influence of Temperature and Pressure<br />
Experimental results have demonstrated that relatively albite-rich plagioclase<br />
crystallizes at elevated pressure, and growth of An-rich plagioclase is favored in<br />
high temperature magmas at lower pressure e.g., [3, 61, 123, 137]. I used the<br />
MELTS program ([2, 55]) to test the likelihood of equilibrium crystallization of<br />
An-rich (i.e., >An82) plagioclase at low pressure from relatively hot and primitive<br />
OJP magmas. Major element, H2O, and other volatile data reported by Roberge<br />
et al. [121] for unaltered Kwaimbaita and Kroenke basaltic glasses from ODP<br />
Leg 192 were used as starting compositions for equilibrium crystallization mod-<br />
eling using MELTS (see Table 2.4). Equilibrium crystallization modeling, which<br />
was performed to estimate initial crystallization temperature and An content of<br />
plagioclase, was run at 0.1 kbar, 0.7 kbar, and 1.9 kbar to also explore the influ-<br />
ence of pressure on the composition of crystallizing plagioclase. These pressure<br />
estimates adhere to previous models that indicate OJP basalts experienced par-<br />
tial crystallization in the shallow crust (< 6-8 km depth) [46, 103, 121, 123]).<br />
Results of MELTS modeling demonstrate average Kroenke basaltic glasses from<br />
both Site 1187 and 1185, which are considered to be parental to Kwaimbaita<br />
basalt e.g., [46, 123], crystallize An84 plagioclase at 1200 ◦ C and 0.1 kbar pressure<br />
(see modeling results in Table 2.4). I also modeled crystallization of a single more<br />
primitive Kroenke glass with greater MgO, CaO, Al2O3 (sample 1185B-15R-1<br />
149 of Roberge et al., 2004), which crystallized An85 plagioclase at 1217 ◦ C and<br />
0.1 kbar (Table 2.4). There indeed may be more primitive melts, currently un-<br />
sampled, that would produce slightly An-richer initial plagioclase (i.e., to account<br />
for An86 plagioclase from Malaita xenolith ML-X1). The results of the MELTS<br />
numerical simulations suggest equilibrium crystallization a low pressure (i.e., 1<br />
72
kbar), high temperature (>1200 ◦ C) crystallization environment favors An-rich<br />
plagioclase growth from known compositions of magmas parental to Kwaimbaita<br />
basalt.<br />
2.6.1.3 An-rich OJP Plagioclase: Influence of Water<br />
Sano and Yamashita [123] invoked a role for water in the genesis of low-MgO,<br />
An-rich OJP plagioclase crystals, which they envisaged to form in a water-rich<br />
(and presumably incompatible trace element-rich) crystal mush layer. Their in-<br />
terpretation is consistent with the hydrous experimental data of Sisson and Grove<br />
[126]. However, while the plagioclase observed by Sisson and Grove [126] grown<br />
in H2O saturated parent magmas were low-MgO and An-rich, the crystals they<br />
observed were more An-rich (generally An90) and lower MgO (< 0.2 wt.% MgO)<br />
than OJP plagioclase crystals (< An90, and > 0.2 wt.% MgO) reported in this<br />
study or by Sano and Yamashita [123] (Table 2.1). Plagioclase data from the<br />
anhydrous experiments of Grove et al. [61] and Bartels et al. [3] produced a neg-<br />
ative correlation of MgO with An content, which was also documented for OJP<br />
plagioclase xenolith crystals and phenocrysts ( [123]; this study; Fig. 2.8). The<br />
experiments of Bartels et al. (1991) were run at 10-20 kbar, and the experiments<br />
of Grove et al. (1982) run at 10-3 kbar. The lower pressure experiments of Grove<br />
et al. [61] produced crystals with MgO and An contents similar to natural OJP<br />
plagioclase observed in this study and by Sano and Yamashita [123]. While I can-<br />
not rule out the influence of H2O, MELTS modeling and previous experimental<br />
studies provide evidence that crystallization of low MgO, An-rich OJP plagioclase<br />
from low pressure, high temperature magmas can account for my observations<br />
without a significant role for H2O. It is, however, impossible to determine un-<br />
73
equivocally the roles of H2O, pressure, and temperature on the genesis of low<br />
MgO, An-rich OJP plagioclase based solely upon major element data. Plagioclase<br />
parent magma trace element compositions allow us to further test the contrasting<br />
hypotheses that An-rich crystals grew from relatively primitive magmas versus<br />
evolved H2O-rich magmas.<br />
2.6.1.4 Trace Elements<br />
The relatively low incompatible trace element abundances in the calculated<br />
parental magmas, relative to the whole-rock basalt compositions, indicates that<br />
crystal fractionation had not occurred to any significant degree and, thus, cannot<br />
be invoked as a process to elevate the water content of the magma. Therefore,<br />
if water-rich magmas were responsible for An-rich plagioclase crystallization, the<br />
magma(s) would need to have been derived from a relatively water-rich source.<br />
However, the data from Roberge et al. [121] indicate this was not the case. As<br />
an alternative to growth in an H2O-rich magma, I suggest An-rich plagioclase,<br />
whether xenolith or phenocryst, crystallized from relatively primitive magmas<br />
in the shallow portions of the OJP magma chamber system. This interpreta-<br />
tion reconciles the relatively primitive parent magma compositions (i.e., lower<br />
incompatible element abundances at a given Mg#; see Fig. 2.9a) of the An-rich<br />
portions of OJP xenolith crystals and phenocrysts. Extensive plagioclase crys-<br />
tallization depletes a residual melt of Sr, as DSr in plagioclase is generally > 1.2<br />
(see Table 2.2). In an environment where plagioclase is the dominant crystallizing<br />
phase, early formed crystals will contain higher Sr/Ti and lower Ba/Sr ratios,<br />
since DBa and DTi < 1 in plagioclase. In a confined, nonturbulent environment<br />
components rejected by growing plagioclase crystals spawn local oversaturations<br />
74
of components needed for later stage clinopyroxene crystallization e.g., [98]. As<br />
clinopyroxene crystallizes the incompatibility of La in clinopyroxene relative to<br />
Y results in relative depletion of Y and enrichment of La, which will yield a<br />
higher La/Y residual liquid (e.g., Table 2.2; Fig. 2.9b-c). Since the trace elements<br />
considered here are highly incompatible in olivine, crystallization of this phase<br />
yields minimal change in the ratios of any of these elements c.f., [6, 7]. Trace<br />
element enrichments and depletions not encountered in whole-rock basalt data<br />
include: 1) An80−86 xenolith and phenocryst zones that were derived from parent<br />
magmas with greater Sr, Y, and Eu, lower La/Y and Ba/Sr, and lower Ba and<br />
LREE abundances extending to overall more primitive compositions than whole-<br />
rock data (Fig. 2.9; Table 2.2). These compositional characteristics suggest that<br />
parent magmas of the An-rich zones experienced less clinopyroxene and plagio-<br />
clase crystallization than lower An zones (Fig. 2.9). The resorption feature in<br />
the Unit 7 xenolith 64R2X-1 provides textural and chemical evidence of exposure<br />
to more primitive magma, where the parent magma of the zone grown after re-<br />
sorption is more An-rich, has lower La/Y, and has greater Sr and Y abundances<br />
(Figs. 2.2b, 2.9, 2.10), and 2) An65−79 phenocryst and xenolith exterior zones with<br />
lower Sr, Y, and Eu, higher La/Y and Ba/Sr, and higher Ba and LREE abun-<br />
dance parental magma compositions that extend to more evolved compositions<br />
than whole-rock data (Figs. 2.9, 2.10). Included in this group are a small number<br />
of phenocrysts, a xenolith exterior zone, and a single resorption feature in the<br />
Unit 6 xenolith that indicate crystallization from magma(s) that had experienced<br />
relatively extreme plagioclase and clinopyroxene fractionation. In Figures 2.9a<br />
and 2.9c vectors for clinopyroxene and plagioclase crystallization are shown as<br />
arrows. Generation of the highest La/Y ratio I observed in a plagioclase par-<br />
75
ent magma requires significant clinopyroxene fractionation (Fig. 2.9). These high<br />
La/Y, relatively evolved liquids, were parental to portions of both xenolith crys-<br />
tals (i.e., 63R2X-1 resorption feature) and phenocrysts. In figure 2.9c the head<br />
of the arrow defining the clinopyroxene crystallization vector corresponds to ap-<br />
proximately 70% clinopyroxene crystallization in terms of La/Y for the highest<br />
MgO Site 1187 Kroenke basalt reported by Fitton and Godard [46]. However, the<br />
amount of crystallization required to account for trace element variations may be<br />
much less given the combined error of calculated partition coefficients (which is<br />
larger for Y than La, Ba, Sr, or Ti), LA-ICP-MS analyses, crystallization tem-<br />
perature, pressure, magmatic H2O, and uncertainties regarding bulk DY and DLa<br />
for clinopyroxene (see error bars in Figs. 2.9, 2.10 and the captions Figs. 2.9,<br />
and 2.10 for details on how the error bars were estimated). The observed major<br />
and trace element variations require magmas both more and less evolved than<br />
those represented by the whole-rock/groundmass. The evolution of these liquids<br />
involved crystallization that was dominated early by plagioclase and olivine (as<br />
suggested by whole-rock and basaltic glass studies) (e.g., Fig. 2.9), although as<br />
noted above, evidence of olivine fractionation is difficult to identify from the pla-<br />
gioclase trace element data presented here [103, 110, 121, 123, 131, 133]. Late<br />
stage clinopyroxene crystallization also played a significant role in evolution of<br />
OJP basaltic magmas, as indicated by variations in La/Y ratios between magma<br />
parental to the high and low An zones. Crystallization of plagioclase from high<br />
temperature, relatively primitive anhydrous magmas at low pressure was an im-<br />
portant process. Conditions to produce the spectrum of relatively evolved and<br />
76
primitive magma compositions recorded in OJP plagioclase are not fully met in<br />
a homogenous magma body and require more confined environments such as a<br />
crystal mush layers e.g., [84, 98, 123].<br />
2.6.2 OJP Magma Chambers, Mush Layers, and Solidification Fronts<br />
Sano and Yamashita [123] suggested zoned plagioclase, clinopyroxene, and<br />
olivine crystals in Kwaimbaita basalts formed as they moved between crystal<br />
mush boundary layers (solidification fronts) and the main magma body. Bound-<br />
ary mush layers are rheological elements of multiply saturated solidification fronts<br />
defined as having crystallinities between 25% and 50%-55% [98]. Crystallization<br />
within the mush zone produces interstitial melts that are evolved relative to the<br />
magma in the chamber interior, and continued crystallization traps these evolved<br />
melts within the solidification front [84, 98]. Mineral phases with compositions<br />
out of equilibrium with main magma body grow within the mush zone of the so-<br />
lidification front where they are thermally and mechanically insulated from the<br />
hotter magma chamber interior [84]. Early formed crystals that potentially con-<br />
tain chemical signatures of relatively primitive magmas may also exist in the rigid<br />
crust of the solidification front near the solidus. Solidification fronts thicken over<br />
time due to crystal nucleation and growth but may also thicken by capturing<br />
crystals carried within new batches of magma. Capture of crystals by the advanc-<br />
ing solidification front is greatest along the magma chamber floor due to crystal<br />
settling, and the thickness of these cumulates in any given magma chamber may<br />
grow to be quite large if repeated transit and storage of crystal carrying magmas<br />
occurs from other magma chambers [98]. Crystal debris may be mobilized from<br />
mushy cumulate layers and solidification fronts by erosion, density and convec-<br />
77
tion driven plumes, or stirring by new magma input [83, 98]. In the case of the<br />
OJP magma chamber system, magma in the chamber interior(s) was the most<br />
eruptible, had Kwaimbaita or Kroenke basalt-like composition(s), and made up<br />
the most significant compositional and textural fractions of basalts erupted to<br />
the surface. Disruption of solidification fronts released evolved material (liquid +<br />
crystals) to mix with the main body of magma e.g., [98]. Mixing small fractions of<br />
evolved material from disrupted solidification fronts into the main magma body<br />
can lead to changes in basalt chemistry (Marsh, 1996). However, if the geometry<br />
of the OJP magma chamber system was such that inputs from disrupted solid-<br />
ification fronts were small relative to the size of the magma body, the input of<br />
more evolved material would have had little affect on the bulk magma chemistry.<br />
Evidence for this process is thus best preserved by allochthonous crystals e.g.,<br />
[37, 98], much like the An65−73 phenocrysts with evolved parent magma composi-<br />
tions and the An80−86 xenolith crystals with primitive magma compositions, which<br />
are all out of equilibrium with the host Kwaimbaita basalt. Parent magma trace<br />
element compositions of An65−73 phenocryst zones, which trend to much more<br />
evolved compositions than whole-rock data, suggest some of these crystals grew<br />
deep within solidification fronts that were eroded and mixed into the main magma<br />
body. Crystals with similarly evolved compositions may also form in dikes and<br />
conduits within the magma chamber system that become readily congested. In<br />
these regions geometry and magma supply rate allow solidification fronts to prop-<br />
agate inward and meet filling the space with a crystal mush that has a network<br />
of interstitial spaces filled with variably evolved melts [98]. Within the interstices<br />
of the crystal mush significant melt differentiation can occur where the mush is<br />
infrequently flushed with new (primitive) melt. I suggest the xenolith crystals and<br />
78
phenocrysts with relatively evolved parent magmas originated from these types of<br />
environments (e.g., phenocryst 63R2P4; phenocryst zones 59R2 P1 core) or were<br />
exposed to liquids flushed from these types of environments (e.g., 59R2P2 rim;<br />
xenolith zones 59R2X1 and 63R2X1). Anorthite-rich plagioclase crystals from the<br />
cumulate xenoliths grew from relatively primitive magmas that ascended and par-<br />
tially crystallized in shallow magma chambers. Contraction of the clinopyroxene<br />
stability field at lower pressures, coupled with evidence of less clinopyroxene frac-<br />
tionation in parent magmas of An-rich zones and results of MELTS simulations,<br />
suggest that crystallization of OJP magmas at low pressure was dominated by<br />
plagioclase ± olivine. Farnetani et al. [45] also suggested that shallow crystal-<br />
lization of OJP magmas was largely plagioclase and olivine with lesser amounts<br />
of late crystallizing clinopyroxene. This relationship is favored by the textures of<br />
Site 1183 xenoliths, where partially resorbed clinopyroxene crystals were present in<br />
voids within interlocking plagioclase crystals (e.g., Fig. 2.2c). Given the size of the<br />
xenoliths (Figs. 2.2a, 2.3a) and their apparent low porosity, they are likely pieces<br />
of the deepest and earliest formed portion of the solidification front. The large<br />
size and general round nature of plagioclase cumulate xenoliths in Kwaimbaita-<br />
type basalt qualitatively suggest that magma delivery and eruption processes were<br />
quite vigorous. Vigorous input of magma into the chamber promotes heavy ero-<br />
sion of solidification fronts and deep stirring of cumulates along the chamber<br />
floor. I suggest solidification front disruption was a ubiquitous process over large<br />
vertical and lateral scales, which freed both more evolved phenocrysts and less<br />
evolved xenoliths to mix with Kwaimbaita-like magma in the chamber interior.<br />
The volume fraction of material from disrupted solidification fronts generally was<br />
probably small (i.e., as suggested by < 2% phenocrysts by volume; Sano and<br />
79
Yamashita, [123], and thus did not significantly change bulk magma chemistry,<br />
unless extensive resorption of crystals occurred.<br />
A laterally and vertically extensive system of interconnected dikes and sills<br />
with regions dominated by liquid and other regions dominated with a crystal-liquid<br />
mush can account for the zoning and compositional features recorded in OJP xeno-<br />
lith and phenocryst plagioclase crystals (see Fig. 2.11). Oscillatory zoned crystals<br />
may have formed in a quiet environment where feeDBack between the rate of crys-<br />
tal growth and diffusion in a boundary layer at the crystal-melt growth interface<br />
yielded small and frequent variations of melt composition near the growing crystal<br />
[1, 115, 141] (Figs. 2.2, 2.3, 2.5). Oscillatory zoned crystals may have also formed<br />
where small and frequent variations in melt composition and/or temperature were<br />
produced by convection of the main magma body at the inward edge of the solid-<br />
ification front e.g., [60]. Indeed, where magma recharge is frequent, solidification<br />
front growth can be arrested or reversed placing deeper zones of the front in re-<br />
peated contact with fresh primitive melt (Marsh, 1996). I have noted evidence<br />
that magma recharge was both vigorous and frequent to have generated the most<br />
of the volume of the OJP around ∼122 Ma. In the case of a shallow OJP magma<br />
chamber, frequent and vigorous recharge would favor production of oscillatory-<br />
zoned An-rich plagioclase crystallizing from relatively primitive parental magmas,<br />
whereas a stagnant environment would favor production of oscillatory zoned An-<br />
poor plagioclase crystallizing from more evolved parental melts. Thick cumulate<br />
mush layers along the floors of OJP magma chambers were also likely important in<br />
the widespread genesis of Kwaimbaita basalt (e.g., Fig. 2.11). An important factor<br />
in basalt differentiation in the crystal-mush dominated portions of the magmatic<br />
system would have been the residence time of melts within the vertically and lat-<br />
80
Figure 2.11. This is a simplified schematic of the Ontong Java Plateau<br />
magma chamber system consisting of a series of interconnected dikes and sills<br />
similar to the mush-column magma chamber model of Marsh [98] in the 0 to<br />
7 km depth range. Magma ascending magma chamber system that follows<br />
the path (dashed line) X-X is subject to more density filtration (i.e., in the<br />
center of the plateau). Magma that ascends along the path (dashed line)<br />
Y-Y is subject to less density filtration, hence a wide variety of magma types<br />
are erupted along this path (i.e., along the plateau margins). A) Due to<br />
geometry, these areas quickly become congested via crystallization during<br />
period of low magma throughput. Interstitial fluids in these regions, within<br />
the congested crystal-liquid mush, experience greater degrees of<br />
fractionation; B) Solidification front material may dislodge from the roof and<br />
cascade as a plume of liquid + crystals with components both in and out of<br />
equilibrium with the main magma body. Some of this material may escape to<br />
be carried to the surface; C) Liquid-dominated regions of the magma<br />
chamber, which are also the hottest portions of the system. In the OJP<br />
magma chamber system this was filled with Kwaimbaita and/or<br />
Kroenke-type magmas; D) Examples of crystal-mush dominated zones, where<br />
within the mush evolved liquids are present. Crystal phases out of<br />
equilibrium with the main magma body are also present in these zones,<br />
where their growth environment is thermally and mechanically insulated<br />
from the hot chamber interior e.g., [98]. E) Thick solidification fronts along<br />
chamber floors (i.e., cumulate layers). These crystal-mush cumulate layers<br />
thicken with the repeated input of crystal-bearing magmas.<br />
81
erally extensive crystal-mush network (Marsh, 1996; Fig. 2.11). Near steady-state<br />
supply of magma into the system (e.g., [120]) would have resulted in tightly con-<br />
strained basalt compositions consistent with Kwaimbaita-type basalts that make<br />
up the bulk of the OJP. Given the size of the OJP, persistent melting over the<br />
lifetime of the causative thermal disturbance is amenable to near steady-state melt<br />
infiltration of the mush-column-type OJP magma chamber system as illustrated<br />
in Figure 2.11 e.g., [98]. Shallow OJP magma evolution was thus influenced by a<br />
balance of several processes that included: 1) Formation of evolved melts within<br />
crystal-mush dominated regions; 2) Flushing of variably evolved melts from the<br />
crystal mush and homogenization of these melts within the main magma body;<br />
3) Entrainment of phenocrysts and other crystal debris (e.g., An-rich xenoliths)<br />
during magma recharge; 4) Resorption (partial or complete) of crystal debris; 5)<br />
Crystal settling; 6) Input of new, primitive magma (see Fig. 2.11). Partial crystal-<br />
lization of magmas at depths of 0-7 km, within the range suggested for the OJP,<br />
coincide with zones of neutral buoyancy as discussed by Ryan [122]. Studies have<br />
suggested the OJP crust contains significant gabbro and/or dolerite intrusions<br />
that would have corresponded to zones of neutral buoyancy and a large shallow<br />
magma chamber system during active OJP volcanism e.g., [45, 53, 54, 73, 110].<br />
Widespread gabbro and dolerite intrusions are consistent with my interpretation<br />
that the OJP magma chamber system consisted of interconnected crystal-mush-<br />
rich magma chambers. Ryan [122] suggested as crust is thickened by erupted<br />
lavas, the zone of neutral buoyancy will slowly migrate upward. Slow upward<br />
migration of the magma chamber system would favor slow yet pervasive assim-<br />
ilation of overlying rock, potentially seawater altered basalts in the case of the<br />
OJP. Indeed, Michael [103] and Roberge et al. [121] suggested assimilation of sea-<br />
82
water altered basalt or materials with a seawater brine component as the source<br />
of widespread Cl contamination of OJP basaltic glasses. Additionally, Neal and<br />
Davidson [108] invoked seawater altered basalt as the contaminant to the parental<br />
magma that produced megacrysts entrained in post-OJP alnite pipes on Malaita,<br />
Solomon Islands. However, I note that the assimilation of such a seawater-altered<br />
component did not radically elevate the water content of the magma within the<br />
different chambers. Magma chambers are more sheet-like near the Earths surface<br />
[97]. The maximum vertical extent of interconnected sheet-like chambers would<br />
have been where the supply of intruding magma was the greatest (i.e., toward the<br />
center of the plateau; Fig. 2.11). The total integrated thickness of the dike and<br />
sill system was thus less along the margins of the OJP, which allowed magmas<br />
distinct from Kwaimbaita-type to ascend through the mush column and erupt<br />
(see Fig. 2.11). Indeed, the greatest compositional diversity is observed along the<br />
plateau margins e.g., [46, 91, 93, 94]. Along the thinner margins of the plateau<br />
the magma chamber system and overlying rock would have acted as less of a<br />
density filter than the thicker central portion of the plateau (Fig. 2.11). I cal-<br />
culated average OJP magma densities using the KWare Magma program written<br />
by Dr. Ken Wohletz using the glass compositions reported by Michael [103] and<br />
Roberge et al. [121] at a temperature of 1180 ◦ C and a pressure of 1 kbar (KWare<br />
Magma program is available at http://geont1.lanl.gov/Wohletz/Magma.htm). It<br />
would have been possible for more (e.g., Kroenke-type: 2869 ± 3 kg/m 3 ) and<br />
less dense (Singgalo-type: 2860 kg/m 3 and Kwaimbaita-type: 2861± 3 kg/m 3 )<br />
magmas to ascend the mush pile and reach the surface along the margins of the<br />
plateau where there was less overlying volume of intruded and extruded magma.<br />
Indeed, Kroenke basalt flows are found to be stratigraphically above Kwaimbaita<br />
83
asalt at Site 1185 of ODP Leg 192 [91]. Although the magma chamber system<br />
may have been thinner along the margins of the plateau, variations in magma res-<br />
idence time in the system did not preclude formation and eruption of Kwaimbaita<br />
magmas along the OJP margins. Differences, however slight, in the densities of<br />
Kroenke, Kwaimbaita, and Singgalo magmas would have lead to different rates<br />
and patterns of magma ascent, pooling, and crystallization en route to the surface.<br />
2.7 Summary and Conclusions<br />
Anorthite-rich (An80−86) portions of plagioclase crystals from cumulate xeno-<br />
liths and phenocrysts in host basalts were formed primarily by crystallization in<br />
shallow (low pressure, 2-7 km depth) regions of the OJP magma chamber system<br />
from more primitive magmas than those basalts sampled from the OJP that were<br />
low in H2O and at relatively high temperature (liquidus temperature near 1200 ◦ C).<br />
Evidence from this study shows that the role of H2O-rich evolved boundary layer<br />
interstitial melts in the formation of An-rich plagioclase was, at best, minor. Par-<br />
ent liquid compositions derived from OJP xenolith and phenocryst plagioclase<br />
crystals contain a wider compositional record of magma evolution than that re-<br />
vealed by OJP whole-rock basalt data. Cumulate xenoliths and phenocrysts gen-<br />
erally are pieces of disrupted solidification fronts. Solidification fronts would have<br />
been ubiquitous throughout the OJP magma chamber system. The OJP magma<br />
chamber system was composed of interconnected dikes and sills and consisted of<br />
regions dominated by liquid (magma chamber interior) and regions dominated by<br />
crystal-liquid mush (along magma chamber floors and walls, within dikes and con-<br />
duits). Crystals and crystalline debris were extensively recycled throughout the<br />
OJP magma chamber system. This recycling accounts for the wide compositional<br />
84
spectrum of magmas parental to plagioclase xenolith crystals and phenocrysts<br />
with An content out of equilibrium with their Kwaimbaita host basalts. Ironi-<br />
cally, this process also accounts for the dominance of a single magma composition<br />
erupted on to the OJP, as it represents the homogenized body of magma in the<br />
main part of the upper chamber. The compositions of melts periodically flushed<br />
from the interstices of the crystal-mush network were affected by their residence<br />
times in the mush. Depending upon the extent of the crystal-rich portions of the<br />
magma chamber system, residence time may have had a large effect on overall<br />
basalt chemistry. The shallow crustal OJP magma chamber system corresponded<br />
with a zone of neutral buoyancy in the 0-7 km depth range, as in other volcanic<br />
systems [122]. As OJP volcanism progressed the plateau gained elevation, and the<br />
zone of neutral buoyancy gradually migrated upward leading to slow yet pervasive<br />
assimilation of overlying seawater altered basalt. The greatest diversity of OJP<br />
basalts is along the margins of the plateau where it is thinner. During formation,<br />
magmas ascending into the marginal and thinner magma chamber system around<br />
the plateau margins were subject to less density filtration, which allowed ascent<br />
and eruption of relatively dense Kroenke magmas and slightly less dense Singgalo<br />
magmas (see Fig. 2.1 for magma types and distribution across the OJP). Slight<br />
variations in paths of magma ascent, depths of magma pooling and crystallization,<br />
as well as rates and amounts of assimilation of seawater altered basalt would have<br />
affected the isotopic and incompatible trace element characteristics of known OJP<br />
basalts. I suggest that these physical factors may account for both the homogene-<br />
ity of basalts in the central portion of the OJP and the relative heterogeneity of<br />
basalts around the plateau margin.<br />
85
CHAPTER 3<br />
SHALLOW MAGMA EVOLUTION DURING LATE CRETACEOUS<br />
HAWAIIAN HOTSPOT-RIDGE INTERACTION: INSIGHTS FROM<br />
INTEGRATION <strong>OF</strong> CRYSTAL SIZE DISTRIBUTIONS <strong>AND</strong><br />
3.1 Introduction<br />
<strong>MICROANALYSIS</strong> <strong>OF</strong> PLAGIOCLASE<br />
Detroit Seamount is located near the northern terminus of the Emperor Seamount<br />
Chain and formed when the Hawaiian hot spot was adjacent to a mid-ocean ridge<br />
during the Late Cretaceous (76-81 Ma) [34, 43] (Fig. 3.1). Interaction of hot<br />
spots and mid-ocean ridges (MOR) often have profound effects on the surround-<br />
ing lithosphere [47, 62–64, 79, 119]. Geochemically anomalous hot spot and MOR<br />
basalts are common in areas of hot spot-MOR interaction and are often linked<br />
to unique mantle processes resulting from the interaction [79, 119]. Several re-<br />
cent studies have noted incompatible trace element and isotopically depleted hot<br />
spot basalts from Detroit Seamount (e.g., [72, 79, 119]). Detroit Seamount basalt<br />
compositions extend from N-type MORB-like to compositions intermediate be-<br />
tween N-MORB and young Hawaiian tholeiitic basalts [72, 79, 119]. Frey et al.<br />
[50] presented compositional evidence linking DSM basalts to the Hawaiian hot<br />
spot and concluded that it is unlikely DSM basalts are simply MORB. Several<br />
hypotheses have been put forward to explain the petrogenesis of depleted hot<br />
86
spot basalts at DSM. Keller et al. [79] suggested that the rising Hawaiian plume<br />
entrained MORB-source upper mantle to an extent that partial melting of the<br />
MORB source component overwhelmed the hot spot source signature in DSM<br />
magmas. Regelous et al. [119] favored an alternative model, where a depleted<br />
component inherent to the Hawaiian plume was more apparent in DSM magmas<br />
due to greater partial melting under a thinner lid of lithosphere near the spreading<br />
center. Huang et al. [72] noted the significance of fractionation and accumulation<br />
of olivine and plagioclase, and thus an implied of signifigance low pressure partial<br />
crystallization (e.g., [130] during the evolution of DSM magmas in the crust. If<br />
one is then to relate DSM basalt chemistry to the nature of a mantle source region<br />
or some mantle process, it is vital to understand the extent to which bulk DSM<br />
magma compositions were influenced during their transit through the crust. Once<br />
the extent of magma evolution in the shallow crust is constrained, understanding<br />
the roles of mantle processes becomes less convoluted.<br />
3.1.1 Magma Evolution in the Crustal Magma Chambers<br />
The crust acts as a cool density filter to ascending hot mantle derived magmas<br />
creating a tendency for rising magmas to stall [113]. Crustal magma chambers<br />
are sites of extensive partial crystallization (fractional, equilibrium, or in-situ),<br />
assimilation, and/or magma mixing, each of which are fundamental processes of<br />
magma evolution. Over the lifetime of magmatism a magma chamber may be filled<br />
with a variety of magma types including but not limited to more primitive, more<br />
evolved, or end-member magmas involved in mixing. Crystals exchanged during<br />
transfer, movement, or filling of magma or crystals grown after these events are<br />
physical vessels that carry compositional information about otherwise inaccessible<br />
87
magma compositions [23, 39, 98]. A sensible approach then for constraining the<br />
processes of shallow magma evolution is to decipher the textural and compositional<br />
record of these processes recorded in individual crystals e.g., [37].<br />
In this work I employ an integrated textural and microanalytical approach to<br />
constrain shallow magma evolution during the formation of Detroit Seamount by<br />
1) identification of crystal populations with related physical growth histories and<br />
2) understanding the provenance of these crystals. Textural and microanalyti-<br />
cal studies focused on plagioclase have been used to elucidate basaltic to silicic<br />
magma evolution processes (e.g., [5, 6, 16, 39, 135]). Plagioclase contains mea-<br />
surable quantities of select incompatible trace elements, including the light rare<br />
earth elements (LREE). When preceded on the liquidus only by olivine, which<br />
does not appreciably fractionate the REE or other incompatible trace elements<br />
[5], plagioclase crystals carry valuable compositional clues about primitive magma<br />
compositions. In this study I use major, minor, and trace element abundances<br />
measured in plagioclase by electron probe microanalysis (EPMA) and laser abla-<br />
tion ICP-MS (LA-ICP-MS) to invert chemical compositions of parental (equilib-<br />
rium) magmas. Accurate partition coefficient data are critical for this inversion.<br />
Plagioclase partition coefficients must be applied carefully because anorthite (An<br />
= 100*[Ca/(Ca+Na)]) content has a dominant influence on cation substitution<br />
[7, 10]. Combined with accurate partition coefficients, inferred parent magma<br />
compositions provide insight into magma evolution beyond what is revealed by<br />
whole-rock data alone.<br />
88
Figure 3.1. Map of the Hawaiian Ridge and Emperor Seamount Chain<br />
(ESC) showing the locations and ages of selected seamounts in the ESC and<br />
the location of Detroit Seamount and a bathymetric map of Detroit<br />
Seamount showing the locations of ODP Sites 884 and 1203. Map is adapted<br />
from [128]. Age data are from [43, 79].<br />
89
Figure 3.2. Stratigraphy of basalts and volcaniclastic rocks cored at ODP<br />
Site 1203 and 884 including the depth, rock types, flow types, and Unit<br />
boundaries (both observed and inferred). Stratigraphic columns are adapted<br />
from [128] and [118]. CSD only and CSD plus microanalysis sample locations<br />
are labeled with white and gray stars, respectively.<br />
90
3.2 The Emperor Seamount Chain<br />
The Hawaiian Ridge and the Emperor Seamount Chain define a nearly con-<br />
tinuous 6000 km long age progressive track of hot spot magmatism ranging in age<br />
from ∼ 85 Ma at Meiji Seamount ([79]) to active volcanism on the Island of Hawaii<br />
(Fig. 3.1). The northwest trending Hawaiian ridge meets the northerly trending<br />
Emperor Seamount Chain south of Koko Seamount (48-49 Ma) [43] (Fig. 3.1).<br />
Early plate reconstructions (e.g., [95]) and recent paleomagnetic studies (e.g.,<br />
[34]) have indicated that the Hawaiian hot spot was close to a mid-ocean spread-<br />
ing center during the formation of Meiji and Detroit Seamounts. Of the oldest<br />
two seamounts, Detroit Seamount is the best sampled and has thus been a focus<br />
of studies aimed at understanding the nature of the Late Cretaceous interaction<br />
of the Hawaiian hot-spot with a MOR e.g., [72, 79].<br />
3.3 Detroit Seamount<br />
3.3.1 Samples<br />
Detroit Seamount covers an area of ∼ 10,000 km 2 and likely represents the<br />
remains of multiple coalesced shield volcanoes [43, 72]. Detroit Seamount was<br />
sampled at multiple drillsites during Legs 145 and 197 of the Ocean Drilling Pro-<br />
gram (ODP). Huang et al. [72] provided a thorough review and interpretation of<br />
whole-rock isotopic and geochemical variations in basalts recovered from Detroit<br />
Seamount. I focused on samples recovered from Sites 1203 and 884 (see Fig. 3.1).<br />
Site 884 is on the northeastern flank of DSM where 87 m of igneous basement was<br />
cored [118] (Fig. 3.1). Basalt samples cored at Site 884 represent 13 flow units<br />
that consist of tholeiitic massive flows in the upper portion of the cored section<br />
and highly plagioclase phyric pillow lavas in lower portion of the cored section<br />
91
[118]. No volcaniclastic rocks were recovered at Site 884 [118] (Fig. 3.2). Keller<br />
et al. [78] reported an 40 Ar- 39 Ar age of 81 ± 1 Ma for a single Site 884 basalt<br />
sample. Site 1203 is located on the eastern flank of Detroit Seamount where 453<br />
m of igneous basement was cored [128] (Fig. 3.2). Eighteen flow units were re-<br />
covered at Site 1203 including tholeiitic pillow basalts, tholeiitic simple pahoehoe<br />
flows, and alkalic compound pahoehoe flows [128]. A variety of volcaniclastic and<br />
sedimentary rocks were recovered from Site 1203 [128] (Fig. 3.2). Duncan and<br />
Keller [43] reported an average 40 Ar- 39 Ar age of 76 ± 1 Ma for four separate lava<br />
flows from Site 1203. Basalts in lower portion of the cored section from Site 1203<br />
include tholeiitic pillow basalts and tholeiitic simple pahoehoe flows but are dom-<br />
inated by thick compound alkalic pahoehoe flows. Basalts in the upper portion<br />
of the cored section from Site 1203 are all tholeiitic pillow basalts and tholeiitic<br />
simple pahoehoe flows [128]. The alkalic to tholeiitic transition is between Units<br />
18 and 19 (Fig. 3.2)<br />
3.3.2 Volcanic history of Detroit Seamount<br />
The tholeiitic compositions of Site 884 basalts are consistent with the shield<br />
building stage of a typical Hawaiian shield volcano [29]. Drilling at Site 1203,<br />
however, recovered a more extensive sequence of lavas that exhibit an upward<br />
change from dominantly subaerial erupted alkalic basalt to submarine erupted<br />
tholeiitic basalt, which Huang et al. [72] noted as compositionally consistent<br />
with the transition from the pre-shield to shield stage of magmatism. The entire<br />
Island of Hawaii is made up of five shield volcanoes and has been constructed<br />
over ∼ 1 Myr [29]. The ∼ 5 Myr age difference between Site 1203 and 884 lavas<br />
and the eruption environment differences between Site 884 and Site 1203 lavas<br />
92
are thus inconsistent with a typical Hawaii-like emplacement. Huang et al. [72]<br />
suggested Site 884 lavas were erupted closest to the spreading ridge axis and that<br />
the proximity of the Hawaiian hotspot to the ridge at ∼ 81 Ma brought about<br />
greater flow of plume mantle toward the ridge axis prior to mantle partial melting<br />
[72, 119]. They suggest Site 1203 lavas were erupted away from the ridge axis<br />
through hotspot-related lithosphere [72]. It cannot be ruled out that Sites 1203<br />
and 884 sampled separate shield volcanoes (see discussion in [72]). Huang et al.<br />
[72] suggested that all of the Site 1203 lavas came from single volcano, where melts<br />
were segregated at lower mean pressure than Hawaiian volcanoes but higher mean<br />
pressure than Site 884 melts. The sequence of rocks recovered from Site 1203<br />
represent a more diverse record of eruptive styles relative to cored section from<br />
Site 884, as well as several distinct periods of non-deposition or erosion (between<br />
Units 5 and 6, Units 23 and 24, and Units 27 and 28) [128] (Fig. 3.2).<br />
3.3.3 Sampling Strategy<br />
A large proportion of the basalts from Site 1203 and Site 884 contain high<br />
volumes of plagioclase phenocrysts [118, 128]. Regelous et al. [119] noted that this<br />
has a diluting effect on whole-rock compositions. Given the size and volume of the<br />
phenocrysts in the numerous plagioclase phyric basalts from Sites 1203 and 884, it<br />
is apparent that whole-rock compositions of these lavas may be best characterized<br />
as hybrids rather than true liquid compositions. Perhaps of greater significance is<br />
that the plagioclase crystals, which have clearly influenced bulk-rock compositions<br />
([119]), may hold clues to otherwise inaccesible facets of magma evolution.<br />
I measured a total of 14 plagioclase CSDs and two olivine CSDs on 12 separate<br />
lava flows from Site 1203 to examine temporal changes in the physical history of<br />
93
magmatic crystallization. Using the CSD results I selected three Site 1203 pillow<br />
lavas for microanalytical studies to examine crystal provenance. I measured six<br />
plagioclase CSDs on two separate plagioclase megaphyric pillow basalts from Site<br />
884 to examine the origins and histories of the cm size plagioclase phenocrysts in<br />
these flows and to examine CSD variations within single flows.<br />
3.4 Analytical Methods<br />
3.4.1 Sample Preparation<br />
Basalt samples were prepared as polished thin sections using a microdiamond<br />
slurry and final grit size of 0.5 µm. Prior to analytical work the slides were rinsed<br />
in ethanol in an ultrasonic bath to remove remnants of the polishing compounds<br />
followed by three 30 minute rinses in ultrapure water in an ultrasonic bath. Sam-<br />
ples were carbon coated for EPMA work. After completion of EPMA work the<br />
carbon coats were removed with 3 µm and 1 µm diamond polishing clothes under<br />
ethanol followed by three 30 minutes rinses in ultrapure water in an ultrasonic<br />
bath. The surface of each slide was inspected under a reflected light optical mi-<br />
croscope to confirm that all vestiges of the carbon coat had been removed prior<br />
to LA-ICP-MS work.<br />
3.4.2 Crystal Size Distribution (CSD) Measurement<br />
Digital image mosaics of entire petrographic thin sections were captured in<br />
cross polarized light using an automated microscope stage system manufactured<br />
by Prior Scientific Instruments, Cambridge, UK. Photographs of each scanned area<br />
were printed on photograph paper and overlain with tracing paper. Minerals of<br />
interest (plagioclase and/or olivine) were outlined by hand using a pen with a 0.1<br />
94
mm diameter tip (which also corresponds to the smallest measurable crystal size).<br />
The tracings were digitized via high resolution scanning with a flatbed scanner.<br />
Crystal intersection areas were shaded gray, detected, and measured according<br />
to a best fit ellipse routine using the freeware program UTHSCSA ImageTool<br />
(http://ddsdx.uthscsa.edu/dig/itdesc.html). The best fit ellipse major and minor<br />
axis results were input into the spreadsheet program CSDslice written by Morgan<br />
and Jerram [106] to estimate the three-dimensional crystal habit. The crystal<br />
major axis data, the estimated 3D crystal habit, rock fabric, total area measured,<br />
and an estimate of crystal roundness were input into the program CSDcorrections<br />
version 1.37 written by Michael Higgins [68] to covert two-dimensional CSD data<br />
to true three-dimensional CSDs as outlined by Marsh [96]. The areas and numbers<br />
of crystals measured in each thin section are listed in table 3.1. Modal abundances<br />
of plagioclase (and olivine for Site 1203 Units 11 and 16) were measured as the<br />
percentage of the phase in the traced area, which Higgins [69] determined to be<br />
an accurate method for estimation of modal abundance.<br />
3.4.3 Electron Probe Microanalysis (EPMA) and Scanning Electron Microscopy<br />
Backscatter electron images and major element analyses were performed us-<br />
ing a JEOL JXA-8600 Superprobe electron microprobe at the University of Notre<br />
Dame. Backscatter electron images were collected using a 1 µm beam, an acceler-<br />
ating voltage of 20 kV, and a probe current of 25-50 nA. Microprobe analyses were<br />
performed using a 10 µm defocused beam, accelerating voltage of 15 kV, a probe<br />
current of 20 nA, 15 second on-peak counting time, and two background measure-<br />
ments per peak. Sodium was measured first to minimize loss via volatilization.<br />
Microprobe data were corrected for matrix effects using a ZAF correction rou-<br />
95
Figure 3.3. A cross polarized light photomosaic (a) of a Detroit Seamount<br />
basalt (Unit 3) and the trace and filled outlines (b) of plagioclase crystals. In<br />
a steady state open system a magma in a wholly liquid state that experiences<br />
simple nucleation and growth of crystals upon cooling will have a linear CSD<br />
[96], but if physical history of crystal nucleation and growth may be more<br />
complex and may include crystal accumulation, crystal sorting or loss,<br />
textural coarsening, or magma mixing (c).<br />
96
tine. Data points near Fe-rich phases such as melt inclusions and alteration-filled<br />
fractures were discarded.<br />
3.4.4 Laser Ablation Inductively Coupled Plasma Mass Spectrometry (LA-ICP-<br />
MS)<br />
Strontium, Y, Ba, La, Ce, Nd, Sm, and Eu were measured in plagioclase<br />
crystals using a New Wave UP-213 UV laser ablation system interfaced with a<br />
ThermoFinnigan Element 2 ICP-MS operated in fast magnet scanning mode at<br />
the University of Notre Dame. I used a laser frequency of 5 Hz, pulse energy of<br />
0.02-0.03 mJ pulse −1 , 15 µm or 30 µm diameter pits depending on crystal size<br />
(40 µm diameter pits were used for analysis of Site 884 plagioclase crystals), and<br />
helium as the carrier gas (∼ 0.7 l min −1 ) mixed with argon (∼ 1.0 l min −1 ) before<br />
introduction to the plasma. Due to the transient nature of the laser ablation sig-<br />
nal, analyses were conducted in peak jumping mode with one point quantified per<br />
mass. The LA-ICP-MS spots were coincident with previous EPMA analyses, and<br />
Ca measured by EPMA was used as an internal standard for each spot analysis,<br />
because its fractionation behavior is similar to that of Sr, Ba, Y, and the REE<br />
[52]. The trace element glass NIST 612 was used as a calibration standard for<br />
all laser ablation analyses. Although heterogeneity for certain elements has been<br />
documented in the widely used NIST 612 glass (i.e., [44]), Eggins et al. [44] consid-<br />
ered it a reliable calibration standard for Sr, Ba, Y, and the REE. The analytical<br />
protocols of Longerich et al. [88] were used for LA-ICP-MS data reduction.<br />
97
3.4.5 Major and Trace Element Data quality<br />
The quality of EPMA data were monitored by major element and cation totals.<br />
Data points where major element totals were greater than 101.5% or less than<br />
98.5% are not used in further discussion nor are points with cation totals greater<br />
or less than 20 ± 0.1 cations (based on 32 O). All laser ablation analyses were<br />
collected in time-resolved mode so that signal from inclusions and alteration filled<br />
fractures could be easily identified. Results from laser ablation spots close to<br />
fractures or that penetrated into underlying fractures were discarded. The rate of<br />
laser ablation was tested using a 100 µm thick plagioclase wafer prior to sampling,<br />
which allowed optimization of operating conditions to yield desired sensitivity and<br />
sampling depth (< 30 µm).<br />
3.4.6 Choosing partition coefficients (D)<br />
Blundy [9] noted that inversion of magma compositions from mineral data<br />
using appropriate trace element D values is a robust means of estimating parent<br />
magma compositions and suggested that trace element D values derived from<br />
microbeam techniques were more accurate than those derived from bulk crystal-<br />
matrix analyses. Blundy and Wood [10, 11] and Bindeman et al. [7] showed<br />
that the dominant factors controlling the trace element D vaues for plagioclase<br />
are An content and crystallization temperature. Bindeman et al. [7] applied this<br />
relationship to a variety of major and trace elements and produced values for the<br />
constants “a” and “b” in their Equation 2 (equation 3.1 below) for calculating<br />
plagioclase partition coefficients via the expression:<br />
RT ln(Di) = aXAn + b (3.1)<br />
98
where R is the gas constant, T is temperature (Kelvin), i is the element of interest,<br />
and XAn is the mole fraction of anorthite. Using equation 3.1, Ginibre et al.<br />
[59] noted that temperatures in the range of 850-1,000 ◦ C had miniscule effect on<br />
calculated melt concentrations for Sr and Ba (within their analytical uncertainty).<br />
Likewise, Bindeman et al. [7] showed that variations of ∼150 ◦ C produce < 10%<br />
differences for particular partition coefficients, which were often within error of<br />
the respective D values.<br />
Blundy and Wood [11] presented an alternative model for quantitative predic-<br />
tion of D values based upon thermodynamic principles and lattice strain theory<br />
(i.e., [15]). Specifically, they noted the dominant roles of cation size, lattice site<br />
size, and elasticity of the lattice site related to cation substitution in minerals.<br />
The elastic response of a lattice site to cation substitution is measured by Young’s<br />
Modulus (E), and the value of E plag is dependent upon plagioclase An content<br />
and the charge of the substituent cation [11, 12]. Equation 3.2 (Equation 2 of<br />
Blundy and Wood [11]) is the basis of their predictive D model that I apply to<br />
plagioclase,<br />
Di = D z+<br />
o<br />
∗ exp<br />
−4πEplagNA<br />
<br />
ro<br />
2 (r2 o − r2 1<br />
i ) + 3 (r3 i − r3 o )<br />
<br />
RT<br />
(3.2)<br />
where Di of a trace element (i) is a function of the strain compensated partition<br />
coefficient for the divalent (D 2+<br />
0 ) or trivalent (D 3+<br />
0 ) substituent cation, Young’s<br />
Modulus for the plagioclase M lattice site (E plag), NA (Avogadro’s Number), the<br />
radius of the plagioclase M site (ro), the radius of the substituent cation (ri),<br />
the gas constant (R), and crystallization temperature (T). For a more thorough<br />
discussion of this model see Blundy and Wood [11, 12].<br />
99
3.4.6.1 Partition coefficients for DSM plagioclase crystals<br />
I used equation 3.2 and the parameterizations of Blundy and Wood [11, 12] to<br />
calculate D values for Sr, Y, Ba, La, Ce, Nd, and Sm. (see Table 3.4). I assumed<br />
a crystallization temperature of 1190 ◦ C to calculate D values. The validity of<br />
this assumption was examined using the MELTS program [2, 55] to determine<br />
the temperature at which plagioclase arrives on the liquidus during crystallization<br />
of a typical Detroit Seamount tholeiitic basalt. I input Detroit Seamount tholei-<br />
itic basaltic glass compositions reported by Huang et al. [72] into the MELTS<br />
program. During equilibrium crystallization of the lowest MgO glass from Site<br />
1203 (Unit 3), plagioclase appeared on the liquidus at 1170 ◦ C, at at 1190 ◦ C from<br />
the highest MgO glass from Site 1203 (top of Unit 18), and at 1200 ◦ C from the<br />
highest MgO glass from Site 884 (Unit 10). The use of 1170 ◦ C vs. 1200 ◦ C in D<br />
calculations yields < 4% differences in trace element concentrations of parent liq-<br />
uids, which is within the analytical error for my analyses. The effects of pressure<br />
on plagioclase D values are not well documented for most elements, and where<br />
they were documented for DSr by Vander Auwera et al. [137] they were negligible.<br />
I used a crystallization pressure of 0.001 kbar for D calculations. I assume the<br />
strain compensated (i.e., strain free) partition coefficient D 2+<br />
0 in plagioclase is best<br />
approximated by DCa (c.f., [12]), and to estimate DCa I used equation 3.1 and the<br />
“a” and “b” constants reported for Ca by Bindeman et al. [7]. Estimation of D 3+<br />
0<br />
is less straightforward. I assumed D 3+<br />
0 to be ∼ 7.5% of D 2+<br />
0 , which was derived<br />
from experimental data reported in Blundy [9]. I used equation 3.1 and the “a”<br />
and “b” constants reported for Ti by Bindeman et al. [7] to estimate DTi<br />
100
3.5 Results<br />
3.5.1 Crystal Size Distributions<br />
3.5.1.1 Site 1203 CSDs<br />
Plagioclase CSDs of Site 1203 basalts are categorized as linear, gently curved<br />
upward, or strongly kinked upward (Fig. 3.4). Of the 12 separate flows I sampled<br />
from Site 1203, two flows: Units 14 and 31, have strongly upward kinked CSDs. A<br />
number of flows have plagioclase CSDs that are gently curved upward, including<br />
Unit 3 (top), Unit 8, Unit 18, and Unit 19. Each of these flows, with the exception<br />
of Unit 19, are tholeiitic pillow basalts (Fig. 3.4). Unit 19 is a subaerial alkalic<br />
basalt, is the youngest alkalic basalt sampled at Site 1203, and is the closest to<br />
the alkalic to tholeiitic basalt transition. Three submarine tholeiitic sheet flows<br />
were examined (Units 11, 16, and 24), and each have linear plagioclase CSDs. The<br />
Unit 11 and Unit 16 tholeiitic sheet lobes have linear olivine CSDs with slopes<br />
nearly identical to their corresponding plagioclase CSDs (Fig. 3.4, Table 3.2). I<br />
sampled two site 1203 basalts near flow tops and bottoms. Unit 3, which is a ∼<br />
25 m thick tholeiitic pillow basalt, and Unit 23, which is a ∼ 62 m thick alkalic<br />
compound pahoehoe basalt flow. The plagioclase CSD of the top of Unit 3 is<br />
curved gently upward (Fig. 3.4b) but otherwise has a nearly identical slope to the<br />
CSD from the bottom of the flow. Samples from both the top and bottom of Unit<br />
23 have linear plagioclase CSDs but the sample from the top of the flow has a<br />
distinctly shallower slope (Fig. 3.4i). Below the alkalic to tholeiitic transition a<br />
larger proportion of the flows I examined have linear CSDs (Fig. 3.4).<br />
101
3.5.1.2 Site 884 CSDs<br />
I measured plagioclase CSDs of samples taken from the tops, middles, and<br />
bottoms of two thin tholeiitic pillow basalts (Unit 8: ∼ 4 m thick and Unit 10:<br />
∼ 7 m thick) from Site 884 (Fig. 3.2). The top of Unit 8 is within error of being<br />
linear, whereas samples from the middle and bottom of the Unit 8 pillow basalt<br />
exhibit identical curved CSDs (Fig. 3.5). Samples from the top and bottom of<br />
the Unit 10 pillow basalt have similar initial slopes (i.e., slope at smaller L), but<br />
the sample from the top of the flow is curved more strongly upward. The CSD<br />
of the sample from the middle of Unit 10 has a shallower initial slope and is the<br />
most curved upward of the three sampled sections of Site 884 Unit 10 (Fig. 3.5;<br />
Table 3.2).<br />
102
Figure 3.4. Plagioclase and olivine CSDs of selected ODP Site 1203 basalts.<br />
Basalts below the alkalic to tholeiitic transition, the boundary between Units<br />
18 and 19, are more frequently linear. Units 14 and 31 have strongly kinked<br />
CSDs. With the exception of Unit 1, all pillow basalts have non-linear CSDs.<br />
103
Figure 3.5. Plagioclase CSDs of ODP Site 884 Unit 8 and 10 pillow basalts.<br />
Plagioclase CSDs were measured on samples taken from flow tops, middles,<br />
and bottoms. a) The top of Unit 8 has a linear CSD and the lowest modal<br />
plagioclase abundance. b) The middle of Unit 10 has the most prominent<br />
upward CSD curvature and the greatest modal plagioclase abundance.<br />
104
105<br />
TABLE 3.1<br />
CSD MEASUREMENT INFORMATION<br />
Sample ODP Site Unit Mineral Crystals Measured Area Measured (mm 2 ) Habit (S:I:L) Habit R 2<br />
17R5-34-36 1203 1 plagioclase 1502 560.2 1-3.2-8 0.78<br />
19R2-136-138 1203 3 top plagioclase 2356 100.4 1-3.2-10 0.74<br />
20R3-4-10 1203 3 bottom plagioclase 3477 105.9 1-3.2-10 0.80<br />
31R1-29-31 1203 8 plagioclase 721 516 1-3.2-10 0.69<br />
32R3-85-87 PL 1203 11 plagioclase 842 585.2 1-2.9-7 0.80<br />
32R3-85-87 OL 1203 11 olivine 462 585.2 1-1.5-1.8 0.92<br />
36R4-92-95 1203 14 plagioclase 3388 72.3 1-4.0-9.0 0.88<br />
37R3-10-13 PL 1203 16 plagioclase 1781 350.5 1-3.4-9 0.85<br />
37R3-10-13 OL 1203 16 olivine 859 350.5 1-1.25-1.9 0.89<br />
40R5-119-121 1203 18 plagioclase 2762 478.1 1-4.0-10 0.90<br />
42R5-20-23 1203 19 plagioclase 1285 711.8 1-3.6-7 0.86<br />
52R6-12-14 1203 23 plagioclase 3280 327.8 1-3.2-10 0.88<br />
57R2-127-129 1203 23 plagioclase 2722 199.7 1-3.4-9 0.87<br />
59R2-99-102 1203 24 plagioclase 2580 394 1-4.0-9.0 0.91<br />
59R5-30-32 1203 26 plagioclase 1902 108 1-4.0-9.0 0.86<br />
68R4-29-30 1203 31 plagioclase 2227 164.9 1-2.9-5.5 0.84<br />
9R1-36-45 884 8 top plagioclase 2653 857.7 1-3.0-10 0.82<br />
9R2-60-75 884 8 middle plagioclase 2406 861.5 1-3.2-8 0.83<br />
9R3-1-12 884 8 bottom plagioclase 2940 789.7 1-3.2-8 0.85<br />
10R2-31-43 884 10 top plagioclase 2711 805.1 1-3.4-7 0.84<br />
10R3-60-74 884 10 middle plagioclase 2329 728.8 1-3.2-8 0.82<br />
10R4-33-49 884 10 bottom plagioclase 2561 576.7 1-3.6-7 0.88<br />
1 Crystal habit was estimated using the CSDslice program written by Morgan and Jerram [106]. S:I:L = short:intermediate:long axis lengths.
106<br />
TABLE 3.2<br />
CSD RESULTS<br />
Sample ODP Site Unit Mineral CSD segment Slope (mm −1 ) σ (slope) ln n o (mm −4 ) σ (intercept) X plag X oliv<br />
17R5-34-36 1203 1 plagioclase linear -1.95 0.03 3.57 0.04 0.13 –<br />
19R2-136-138 1203 3 top plagioclase A -4.47 0.06 7.68 0.03 0.23 –<br />
B -1.26 0.02 1.69 0.01 – –<br />
20R3-4-10 1203 3 bottom plagioclase A -4.33 0.05 7.86 0.02 0.17 –<br />
31R1-29-31 1203 8 plagioclase A -4.24 0.08 5.01 0.07 0.04 –<br />
B -0.96 0.02 -0.49 0.01 – –<br />
32R3-85-87 PL 1203 11PL plagioclase A -1.80 0.04 2.73 0.19 0.08 0.38<br />
32R3-85-87 OL 1203 11OL olivine A -2.01 0.08 1.38 0.03 0.08 0.38<br />
36R4-92-95 1203 14 plagioclase A -10.80 0.16 9.89 0.03 0.2 –<br />
B -1.31 0.02 0.86 0.00 – –<br />
37R3-10-13 PL 1203 16PL plagioclase linear -3.55 0.05 5.82 0.06 0.07 0.3<br />
37R3-10-13 OL 1203 16OL olivine linear -4.07 0.12 3.34 0.07 0.07 0.3<br />
40R5-119-121 1203 18 plagioclase A -3.71 0.06 6 0.04 0.11 –<br />
B -0.91 0.02 -1.15 0.01 – –<br />
42R5-20-23 1203 19 plagioclase A -3.90 0.06 4.44 0.05 0.14 –<br />
B -1.10 0.02 -0.11 0.00 – –<br />
52R6-12-14 1203 23 plagioclase linear -2.99 0.04 6.18 0.04 0.14 –<br />
57R2-127-129 1203 23 plagioclase A -4.43 0.08 6.91 0.04 0.11 –<br />
59R2-99-102 1203 24 plagioclase linear -4.36 0.09 6.12 0.05 0.07 –<br />
59R5-30-32 1203 26 plagioclase linear -6.27 0.13 7.75 0.06 0.09 –<br />
68R4-29-30 1203 31 plagioclase A -17.77 0.21 9.26 0.03 0.18 –<br />
B -1.69 0.02 1.72 0.01 – –<br />
9R1-36-45 884 8 top plagioclase A -1.36 0.02 3.02 0.03 0.17 –<br />
9R2-60-75 884 8 middle plagioclase A -2.01 0.03 3.48 0.03 0.36 –<br />
B -0.31 0.00 -4.32 0.04 – –<br />
9R3-1-12 884 8 bottom plagioclase A -2.52 0.05 4.27 0.03 0.27 –<br />
B -0.39 0.01 -3.8 0.03 – –<br />
10R2-31-43 884 10 top plagioclase A -3.79 0.05 4.94 0.04 0.34 –<br />
B -0.59 0.01 -1.94 0.02 – –<br />
10R3-60-74 884 10 middle plagioclase A -2.12 0.03 3.83 0.03 0.43 –<br />
B -0.37 0.01 -2.95 0.03 – –<br />
10R4-33-49 884 10 bottom plagioclase A -4.07 0.07 5.57 0.04 0.24 –<br />
B -0.95 0.02 -0.65 0.00 – –<br />
1 Segment A of a curved or kinked CSD here refers to the small crystals that populate the steeper segment, whereas segment B refers to the larger crystals.<br />
2 1σ errors were calculated following the protocol of Higgins [68].<br />
3 Several samples listed contained sparse olivine phenocrysts but each less than 5% by volume unless otherwise noted.
3.5.2 CSDs as Guides for Microanalysis<br />
I selected three samples from Site 1203 for detailed microanalysis of plagio-<br />
clase phenocrysts based upon CSD curvature (Fig. 3.6). I chose to examine Site<br />
1203 Units 14 and 31 due to the highly kinked nature of their CSDs. I also chose<br />
one gently curved CSD sample, the top of Site 1203 Unit 3, for microanalysis to<br />
compare with the results from the strongly kinked CSDs. I selected two large<br />
phenocrysts, one each from the middle and bottom of Site 884 Unit 8 for micro-<br />
analysis. I divided non-linear CSDs into two segments for targeted microanalysis<br />
based upon the approximate position CSD slope change (Fig. 3.6a). A generaliza-<br />
tion of the division of CSDs into separate segments, which are hereafter referred<br />
to as Population A (smaller L) and Population B (larger L), is illustrated in fig-<br />
ure 3.6a. The locations and sample names of each plagioclase crystal analyzed in<br />
this study, as listed in tables 3.3 and 3.4, are labeled in figure 3.6b-e. The stereo-<br />
logic correction used to convert 2D crystal sizes to 3D crystal sizes for generation<br />
of true 3D CSD plots was applied to each crystal each crystal examined in order<br />
to accurately sample CSD segments shown in figure 3.6b-e.<br />
3.5.3 Petrography and Crystal Zoning Patterns of Microanalysis Samples<br />
3.5.3.1 Site 1203 Unit 3<br />
Unit 3 basalts have massive textures and large plagioclase phenocrysts (i.e.,<br />
population B) that occur both as individual euhedral crystals and as portions of<br />
rounded glomerocrysts (e.g., Fig. 3.7a). Both the large euhedral crystals and the<br />
crystals present within glomerocrysts exhibit oscillatory zoning (e.g., Fig. 3.8d)<br />
superimposed upn normal zonation ± distinct changes in An content of > 5 mole %<br />
(e.g., Fig. 3.8c,d). Major element zonation is visible in backscatter electron images<br />
107
ln (n) [mm -4 ]<br />
ln (n) [mm -4 ]<br />
10<br />
5<br />
0<br />
-5<br />
5<br />
0<br />
-5<br />
Unit 8 middle<br />
Unit 8 bottom<br />
ln (n) [mm -4 ]<br />
Site 884 Unit 8<br />
}Crystals: PG1-PG5,PG-8-PG-13,Y3A,Y3C,Y3F,Y4A,<br />
Y4D,Y4E,Y4F,Y5B,Y2B,Y2C,Y2D,<br />
XLE1-XLE4,XLB1-XLB4,XLC1-XLC-5,<br />
XLD1,XLD2,SB1<br />
} Crystals:<br />
Site 1203 Unit 14<br />
-10<br />
0 2 4 6<br />
L [mm]<br />
8 10<br />
10<br />
5<br />
0<br />
-5<br />
}<br />
population A<br />
}<br />
-10<br />
0 2 4 6<br />
L [mm]<br />
8 10<br />
A,B,C1,D1,E,X1,X2,Y3B,Y3D,Y3E,Y4G,<br />
Y5A,Y2A,X4,C,B2,A2<br />
population B<br />
}<br />
A)<br />
Crystals: D-S1,D-S2,E-1,F,H,PL-A,PL-B,PL-C,PL-D,<br />
PL-E,PL-F,PL-G,PL-H<br />
B) C)<br />
9R2A 9R3B }Crystals:<br />
A,B,C,D-L,<br />
J,X1,X4,X2-1<br />
Site 1203 Unit 3<br />
Unit 3 top<br />
Unit 3 bottom<br />
}Crystals: SPL3,SPL1,SPL,5,SPL2,SPL6,SPL7,SPL8,SPL9,<br />
SPL10,Y1,Y2B,Y3,Y4A,Y4B,Y6C,Y6B<br />
D) E)<br />
A,Bsm,C,D,E,G,I,J,Y5L,<br />
Y10,Y11<br />
}Crystals:<br />
Site 1203 Unit 31<br />
0 2 4<br />
L [mm]<br />
6 8<br />
Figure 3.6. a) Non-linear CSDs were divided into two regions based upon<br />
the approximate position of CSD slope change. Crystals from each<br />
population segment were then targets for compositional microanalysis. The<br />
general locations of crystals listed in tables 3.1 and 3.2 are shown for b) Site<br />
884 Unit 8; c) Site 1203 Unit 3; d) Site 1203 Unit 14; and e) Site 1203 Unit<br />
31.<br />
108
and is most apparent near population B crystal rims where there are changes of up<br />
to > 10 mole % An. Population A and B crystals have thin (< 10 µm) rims that<br />
are as low as An62. The majority of the population A crystals in Unit 3 samples<br />
are unzoned or normally zoned (Fig. 3.7b). There is a small proportion of crystals<br />
exhibiting reverse zonation that have chaotic zoning in their crystal cores that on<br />
average have lower An than the rims (Fig. 3.8b). Small reverse zoned plagioclase<br />
crystals are commonly present in clots of clinopyroxene and plagioclase crystals,<br />
where the small clinopyroxene crystals also exhibit reverse zonation (see inset<br />
image in Fig. 3.8b). Of the two Unit 3 basalt samples I examined, the sample<br />
from the bottom of the flow has a 17% modal abundance of plagioclase and the<br />
sample from the top of the flow has 23% modal plagioclase. I did not measure<br />
olivine modal abundances in the Unit 3 samples but were estimated to be 3-5 %<br />
by Tarduno et al. [128].<br />
3.5.3.2 Site 1203 Unit 14<br />
The Unit 14 basalt I examined has a massive texture and population B crystals<br />
that occur as clusters of euhedral crystals and as occasional individual rounded<br />
crystals (e.g., Fig. 3.7b). Population B crystals exhibit oscillatory zoning (e.g.,<br />
Fig. 3.8e,f) superimposed upon normal zonation with distinct changes in An con-<br />
tent near the rims, often a > 10 mole % An change (e.g., Fig. 3.8e,f). The majority<br />
( 95%) of the population A crystals exhibit the zoning pattern displayed in fig-<br />
ure 3.8g. This pattern, which is characterized by a change from An69−71 in the<br />
core to a thin (2-5 µm) higher An zone then an outermost rim that is An69−71, is<br />
similar to the zoning pattern observed along the rims of the population B crystals<br />
(e.g., rims in Figs. 3.8e,f vs. Fig. 3.8g). The remaining proportion of the pop-<br />
109
ulation A crystals are unzoned (An64−79) and normal zoned with cores up An82<br />
(e.g., Fig. 3.8h). The single Unit 14 basalt sample I examined has a 20% modal<br />
abundance of plagioclase. I did not measure olivine modal abundances in the Unit<br />
14 sample and Tarduno et al. [128] did not note any olivine in this sample.<br />
Figure 3.7. In each basalt chosen for microanalysis large phenocrysts (i.e.,<br />
population B crystals) are present as glomerocrysts and individual crystals<br />
that are commonly rounded or embayed. The field of view in each<br />
photomicrograph is 2 cm. Large plagioclase phenocrysts are a) 0.5-2 mm in<br />
Site 1203 Unit 3; b) 1-8 mm in Site 1203 Unit 14; c) 1-4 mm in Site 1203<br />
Unit 31; d) up to 1.5 cm in the sample from the middle of Site 884 Unit 8;<br />
and e) up to 1.5 cm from the bottom of Site 884 Unit 8.<br />
110
3.5.3.3 Site 1203 Unit 31<br />
The Unit 31 basalt I examined has a massive texture and population B crys-<br />
tals that occur as rounded and euhedral individual crystals or glomerocrysts (e.g.,<br />
Fig. 3.7c). Most population B crystals exhibit interior oscillatory zoning superim-<br />
posed upon normal zonation with distinct changes in An content near the rims,<br />
often a > 10 mole % An change (e.g., Fig. 3.8j). A small number of population B<br />
crystals exhibit patchy disorganized major element zoning in their interiors with<br />
An variations close to the limits of An content resolution (∼ 1-2 mol % An) of<br />
backscatter electron images (see Fig. 3.8i). Population A crystals are unzoned and<br />
normal zoned (Fig. 3.8k,l). The single Unit 31 basalt sample I examined has 18%<br />
modal abundance of plagioclase. I did not measure olivine modal abundances in<br />
the Unit 31 sample but was estimated to be < 1% by Tarduno et al. [128].<br />
3.5.3.4 Site 884 Unit 8<br />
The Site 884 Unit 8 basalts I examined have massive textures and and cm size<br />
population B crystals that occur as rounded clusters of crystals and individual<br />
euhedral or rounded crystals (e.g., Fig. 3.7d,e). The interiors of the population B<br />
crystals exhibit oscillatory type zoning and normal zonation with subtle decreases<br />
in An content of 1-4 mole % near the rims (e.g., Fig. 3.8m,n). Thin (5-10 µm)<br />
low An rims are apparent in backscatter electron images of population B crystals<br />
but were not sampled in detail. The basalt sample from the middle of this flow<br />
has 36% modal plagioclase abundance, the sample from the bottom of the flow<br />
has 27% modal plagioclase abundance, and the sample from the flow top has 17%<br />
modal plagioclase abundance. I did not measure olivine modal abundances in the<br />
Site 884 Unit 8 samples but they were estimated to be < 1% by Rea et al. [118].<br />
111
Figure 3.8. a) The majority of Site 1203 Unit 3 population A crystals are normal zoned or<br />
unzoned. b) There is a small proportion of population A crystals in Unit 3 that are reverse zoned<br />
that are clustered with small reverse zoned clinopyroxene crystals (inset image). c) Unit 3<br />
population B crystals exhibit oscillatory zonation superimposed upon a (d) normal zoning pattern.<br />
e) Site 1203 Unit 14 population B crystals exhibit oscillatory zonation superimposed upon a (f)<br />
normal zoning pattern. g) The majority of Unit 14 population A crystals exhibit minor low An<br />
cores bounded by thin An-rich mantles then low An rims. h) A small proportion of Unit 14<br />
population A crystals exhibit normal zoning. i) A small number of Unit 31 population B crystals<br />
exhibit patchy disorganized interior zoning. j) Most Site 1203 Unit 31 population B crystals exhibit<br />
oscillatory zonation superimposed upon a normal zoning pattern. k) A small proportion of Unit 31<br />
population A crystals are (l) normal zoned, but the majority are unzoned. m,n) Site 884 Unit 8<br />
population B crystals exhibit oscillatory zonation superimposed upon normal zoning.<br />
112
3.5.4 Major Elements<br />
Major element compositions measured by EPMA and Ti abundances measured<br />
by LA-ICP-MS in plagioclase crystals from each Unit are reported in table 3.3<br />
and illustrated in figure 3.9.<br />
3.5.4.1 Site 1203 Unit 3<br />
I noted variations in An content apparent in backscatter electron images that<br />
correlate with zoning patterns. Unit 3 Population A crystal cores fall into two<br />
groups in terms of An content. The higher An group (An74−79) overlaps the<br />
population B cores (An78−81) (Fig. 3.9a). The cores of population B crystals<br />
extend to higher An contents (up to An81) than population A crystals. There is<br />
no obvious variation in Mg # (measured in plagioclase) between population A<br />
and B crystals or with An content.<br />
3.5.4.2 Site 1203 Unit 14<br />
The cores of population A crystals from Unit 14 also fall into two groups in<br />
terms of An content. The more An rich population A group have An77−82 cores<br />
that overlap the compositions of population B cores, and the lower An population<br />
A group have An64−76 cores. The cores of population B crystals have a higher<br />
range of An content (An81−87), but a single population B crystal with a core<br />
composition of An73−74 was observed. There is no obvious variation in Mg #<br />
(Mg/Mg+total Fe measured in plagioclase) between population A and B crystals<br />
or with An content, but a single Unit 14 crystal rim (An56) has the lowest overall<br />
Mg # (Fig. 3.9d).<br />
113
3.5.4.3 Site 1203 Unit 31 and Site 884 Unit 8<br />
The cores of population A crystals from Site 1203 Unit 31 define a single<br />
An67−77 group. The cores of Site 123 Unit 31 population B crystals are An-rich<br />
(An80−86), define a single group of compositions, and do not overlap population A<br />
cores. The cores of the two Site 884 Unit 8 population B crystals I examined are<br />
An85−86. There is no obvious variation in Mg # (measured in plagioclase) between<br />
population A and B crystals or with An content. Of all crystals examined with<br />
An82−86 zones, the two Site 884 Unit 8 crystals tend to have the highest Mg #’s<br />
(Fig. 3.9d).<br />
3.5.4.4 Ti variations between crystal populations and Units<br />
There is a strong negative correlation of Ti abundance with An content that<br />
is apparent for crystals from each Site examined, however there seems to be min-<br />
imal correlation at An contents greater than ∼ An72 (Fig. 3.9e). In the An80−87<br />
range Unit 3 population B crystals have greater Ti abundances than population<br />
B crystals from all other Units examined, and population B crystals from Site 884<br />
Unit 8 have the lowest overall Ti abundance (Fig. 3.9e).<br />
114
115<br />
A)<br />
An (mol %)<br />
pop. A cores<br />
pop. B cores<br />
Site 1203 Unit 3<br />
Ab 50 (mol %) Or 50 (mol %)<br />
B)<br />
An (mol %)<br />
An (mol %)<br />
pop. A cores<br />
pop. B cores<br />
Site 1203 Unit 14<br />
Ab 50 (mol %) Or 50 (mol %)<br />
C)<br />
pop. A cores<br />
pop. B cores<br />
Site 884 Unit 8 pop. B cores<br />
Site 1203 Unit 31<br />
(and Site 884 Unit 8)<br />
Ab 50 (mol %) Or 50 (mol %)<br />
Mg #<br />
Ti (ppm)<br />
An (mol %)<br />
Figure 3.9. a) The cores of Site 1203 Unit 3 population A and B crystals overlap, but<br />
population A crystals extend to much lower An. b) Unit 14 and Unit 31 (c) population B crystals<br />
extend up to An87, which is distinct from population A crystals in each Unit. d) There is little<br />
obvious variation of Mg# with An content, between crystal populations, or between Units. e) A<br />
strong correlation of Ti abundance with An content was observed, although correlations appears to<br />
weaken considerably at An > 70. Correlation coefficient for Unit 3 Ti vs. An R2 = 0.79, Unit 14<br />
R2 = 0.80, and Unit 31 R2 = 0.39.<br />
D)<br />
E)
3.5.5 Trace Elements<br />
3.5.5.1 Measured Compositions<br />
Trace element abundances measured by LA-ICP-MS in plagioclase crystals<br />
from each Unit are reported in table 3.3 and illustrated in figure 3.10. Yttrium,<br />
Sr, La, Nd, Sm, and Eu abundance exhibit little or no correlation with An content<br />
in figure 3.10. More prominent negative correlations of Ba and Ce abundance with<br />
An content are apparent if figures 3.10c,e, although these correlations appear to be<br />
most significant at An contents < An70. In the An80−87 range, which is dominated<br />
by the interiors of population B crystals from each Unit, Unit 14 population B<br />
crystals trend to highest Sr abundance, Unit 31 crystals have the lowest Sr of the<br />
three Site 1203 Units I examined, and the Site 884 Unit 8 crystals have lower<br />
abundances Sr than all Site 1203 crystals (Fig. 3.10). In terms of Y, Sm, Nd, and<br />
Eu all crystals in the An80−87 range overlap. It should be noted, however, that the<br />
Site 884 Unit 8 crystals tend to have the lowest abundances of these elements and<br />
Sm low enough to be below analytical detection limits. Lanthanum and Ce exhibit<br />
similar patterns in crystal zones in the An80−87 range, where Unit 31 crystals are<br />
the most La and Ce depleted of the Site 1203 samples and the Site 884 Unit 8<br />
crystals have notably lower La and Ce abundances (Fig. 3.10d,e)<br />
3.5.5.2 Inferred Parent Magma Compositions<br />
I inverted the compositions of magmas in equilibrium with the crystals at dif-<br />
ferent periods during their growth. The calculated parent magma compositions<br />
and the partition coefficients used for inversion are listed in table 3.4. Rare earth<br />
element, Ti, Ba, and Sr abundance in parent magmas of the four Units I examined<br />
exhibit the following general trend of decreasing abundance: Unit 3 ≅ Unit 14 ><br />
116
Figure 3.10. Strong negative correlations of are apparent for c) Ba and e)<br />
Ce, although the correlation is weaker above ∼ An70. There little or weak<br />
correlation of a) Y, b) Sr, d) La, f) Nd, g) Sm, and h) Eu with An content.<br />
Unit 31 population B crystals have the lowest parent magma LREE<br />
abundances of Site 1203 samples. Site 884 Unit 8 population B parent have<br />
the lowest overall abundances of each element measured except Y. Yttrium<br />
abundance of Site 884 population B magmas trends higher than any other<br />
population B parent magma.<br />
117
Unit 31 > Site 884 Unit 8 (Table 3.3). Selected trace element ratios are shown<br />
plotted against An content in figure 3.11. It is difficult to estimate the amount<br />
of error introduced to the inverted compositions via the choice of partition coeffi-<br />
cients, and for this reason the error shown in figure 3.11 is analytical uncertainty<br />
only. Parent magma Ba/Sr ratios of population A and B crystals from Unit 3<br />
overlap at An > 70 and trend to higher ratios at An contents approaching An60<br />
(Fig. 3.11a). Parent magmas of Unit 14 and 31 population A crystals trend to<br />
higher Ba/Sr than parent magmas of population B crystals (Fig. 3.11a). Par-<br />
ent magma Ba/Sr of population B crystals from Units 14, 31, and Site 884 Unit<br />
8 overlap and are lower than Unit 3 population B parent magmas (Fig. 3.11a).<br />
Population A crystals from Units 14 and 31 trend to the lowest overall La/Sm<br />
ratios, but there are no other noteworthy La/Sm distinctions between Units or<br />
crystal populations (Fig. 3.11b). Samarium was below analytical detection limits<br />
in the Site 884 Unit 8 crystals. In terms of La/Y ratios, parent magmas from<br />
populations A and B from Units 3, 14, and 31 overlap, but population A parent<br />
magmas exhibit a wider range of La/Y (Fig. 3.13). I measured trace elements in<br />
a single Unit 31 population A crystal, which has lower parent magma La/Y than<br />
the population B crystals (Fig. 3.13). When the range of La/Y in parent magmas<br />
of the Unit 3 and 14 population A magmas are considered, the separation of the<br />
single Unit 31 population A crystal parent magma from parent magmas of the<br />
population B crystals is probably an artifact of limited sampling. In summary,<br />
the parent magmas of population B crystals from Unit 31 and Site 884 Unit 8 are<br />
the most LREE and trace element depleted of all crystals sampled. There appears<br />
to be little significant fractionation of REE between parent magmas of population<br />
A and B crystals, but there are distinct differences in Ba and Sr content.<br />
118
Figure 3.11. a) Population B parent magmas trend to lower Ba/Sr, which is<br />
sensitive to plagioclase fractionation. In general population B crystals are<br />
older and grew from less evolved melts. b) La/Sm ratios of population A and<br />
B magmas are broadly similar with the exception of Unit 14 population A<br />
parent magmas. These parent magmas trend to lower La/Sm, which may<br />
indicate a unique source compositions relative to Unit 14 population B<br />
crystals.<br />
119
3.6 Discussion<br />
3.6.1 Evidence of Crystal Sorting<br />
In each instance where I measured multiple CSDs in a single flow, I observed<br />
evidence of plagioclase sorting. For example, my observations that the top of the<br />
Site 1203 Unit 3 pillow basalt has greater modal abundance plagioclase and an<br />
upward curved plagioclase CSD are consistent with crystal sorting and concen-<br />
tration (Fig. 3.4b). Plagioclase phenocrysts were concentrated near the top of<br />
this ∼ 25 m thick pillow flow most plausibly by flotation. I observed evidence of<br />
plagioclase sorting in Unit 8 from Site 884, where the plagioclase CSD from the<br />
top of the ∼ 4 m thick flow is linear and has lower modal plagioclase, and CSDs<br />
from the middle and bottom of the flow are nearly identical, curved upward, and<br />
have greater modal plagioclase (Fig. 3.5a; Table 3.2). Faster cooling of the flow<br />
top could have lead flowing lava to concentrate larger crystals toward the bottom<br />
of the flow. Simple gravitational sinking of plagioclase can also explain concentra-<br />
tion of large crystals near the flow bottom, however the density contrast between<br />
basaltic lava and plagioclase would likely have minimized significant plagioclase<br />
settling. Plagioclase sorting is also evident in the Unit 10 pillow flow (∼ 7m thick)<br />
from Site 884 (Fig. 3.5a). The plagioclase CSD I measured from the center of the<br />
flow displays the greatest upward curvature and highest modal plagioclase abun-<br />
dance (Table 3.2), which is consistent with greater accumulation of plagioclase at<br />
the flow center. This type of flow sorting of crystals was documented by Marsh<br />
[98] on a larger scale in basaltic sills.<br />
The two CSDs I measured on samples taken from near the top and bottom<br />
of the ∼ 62 m thick Site 1203 Unit 23 alkalic compound pahoehoe flow appear<br />
to fan (or rotate) about a point at low L (Fig. 3.4i). Two samples provide only<br />
120
a limited picture of CSD variation across this thick flow, but CSD fanning of<br />
co-magmatic lavas may indicate progressive deeper sampling of the solidification<br />
fronts lining the magma chamber [146]. The deeper portions of solidification fronts<br />
lining the magma chamber contain larger and older crystals, and as this region is<br />
increasingly scoured by passing magma en-route to the surface the resulting lava<br />
will have a flatter CSD slope (e.g., [146]). In the case of this single thick flow the<br />
steeper CSD from the bottom of the flow is representative of the earliest and lowest<br />
crystallinity magma emptied from the magma chamber, and as evacuation of the<br />
magma chamber progressed and fed the flow, deeper portions of the solidification<br />
fronts lining the chamber were eroded leading to a shallower sloped CSD near the<br />
top of the flow (i.e., the terminus of magma chamber evacuation).<br />
I conclude that flow sorting of plagioclase was a ubiquitous process during<br />
the formation of Detroit Seamount and that measurement of one plagioclase CSD<br />
per flow is inadequate for making robust interpretations based solely upon CSD<br />
results. Crystal size distribution results do, however, provide insight into when<br />
and where crystal accumulation or magma mixing most heavily influenced bulk<br />
magma composition. Based upon the fact that everywhere I looked for evidence of<br />
crystal sorting I found convincing evidence of this process, I suggest that sorting<br />
was not limited to plagioclase. Indeed, the greater density of olivine relative to<br />
basaltic melt and plagioclase may have accentuated olivine sorting and sorting<br />
due to both flow sorting and gravitational settling. Indeed Tarduno et al. [128]<br />
noted olivine cumulate picritic basalts at Site 1203<br />
121
3.6.1.1 Site 1203 Alkalic Basalts and Tholeiitic Sheet Flows<br />
Each of the alkalic lavas I examined are plagioclase phyric [128]. Close in-<br />
spection of the single alkalic basalt with a curved CSD, Unit 19, reveals that the<br />
upward curvature is largely due to a slope change at the smallest L (i.e., small-<br />
est crystal sizes), which is consistent with a rapid change in cooling related to<br />
eruption [96] (Fig. 3.4h). With the overall linearity of Unit 19 CSD considered,<br />
each of the alkalic basalts I examined can be taken as having a linear CSDs. This<br />
observation suggests an insignificant role for plagioclase removal or accumulation<br />
during the petrogenesis of Site 1203 alkalic basalts. Submarine tholeiitic sheet<br />
lavas have the lowest overall modal abundances of plagioclase as a group and all<br />
have approximately linear CSDs (Figs. 3.4d,f,j).<br />
The Unit 11 and 16 tholeiitic sheet lavas each contain > 30 % modal abundance<br />
olivine and linear olivine CSDs. If I assume similar olivine and plagioclase growth<br />
rates, then the similarity of olivine and plagioclase CSD slopes indicates that<br />
they had similar residence times in magma chambers where crystallization was<br />
dominated by olivine (Figs. 3.4d,f). The single tholeiitic sheet flow recovered<br />
below the alkalic to tholeiitic transition (Unit 24) is devoid of large phenocrysts<br />
and has a steeper CSD slope than the upper sheet flows (Units 11 and 16), which<br />
indicates a short magmatic residence time and minimal partial crystallization.<br />
3.6.1.2 Site 1203 Pillow Basalts<br />
Each tholeiitic pillow basalt I examined except Site 1203 Unit 1 has a curved<br />
or kinked plagioclase CSD (Figs. 3.4, 3.5), which indicates that removal or accu-<br />
mulation of plagioclase was a significant process during the petrogenesis of Detroit<br />
Seamount basalts and was most prevalent during the formation of pillow basalts.<br />
122
The common occurrence of population B crystals in rounded and embayed crys-<br />
tals in Site 1203 Units 3, 14, and 31 and Site 884 Unit 8 basalts is a qualitative<br />
indication that these crystals were commonly out of equilibrium with their host<br />
basalts, which is also consistent with plagioclase accumulation.<br />
Huang et al. [72] specifically noted the significance of plagioclase accumulation<br />
in Unit 14 and 31 lavas from Site 1203 (i.e. Fig. 13 of [72]). My observations<br />
of strongly upward kinked plagioclase CSDs for these two Units (Fig. 3.4e,l) are<br />
consistent with their assertions of plagioclase accumulation. Although I provide<br />
seemingly independent evidence of plagioclase accumulation in these two lavas,<br />
the exact origin of the non-linear CSDs of these lavas is not straightforward. Both<br />
magma mixing and crystal accumulation can produce a non-linear CSDs (Fig. 3.3)<br />
[67]. Higgins [67] discussed a number of explanations for curved CSDs, including<br />
size dependent crystal growth rate, destruction of small crystals (i.e., fines destruc-<br />
tion), changes in cooling rate, or changes in the dominant crystallizing phases.<br />
Cashman and Marsh [20] and Marsh [99] presented sound arguments against size<br />
dependent growth. Fines destruction and changes in cooling rate cannot be ruled<br />
out based upon textural evidence alone. I have noted distinct compositional dif-<br />
ferences between population A and B crystals from Site 1203 Units 14 and Units<br />
31, which is evidence against these processes as noted by Higgins [67]. Huang et<br />
al. [72] suggested a significant role for olivine and plagioclase fractionation during<br />
DSM basalt petrogenesis, and there is little other evidence to indicate there was<br />
a change in the dominant crystallizing phases. Although I cannot rule out minor<br />
roles for any of these processes, I suggest accumulation and/or magma mixing are<br />
responsible for the majority of the CSD curvature I have noted.<br />
Higgins [67] noted that magma mixing would lead to compositional differences<br />
123
etween the different crystal populations (i.e., see Fig. 3.6). Entrainment of early<br />
formed crystals from the magma chamber floor would also lead to compositional<br />
differences related to partial crystallization (see also [19, 20, 96]. For example,<br />
early formed plagioclase crystals would likely contain higher abundances of Sr,<br />
because as plagioclase crystallization progresses the residual melt becomes Sr de-<br />
pleted. I suggest that DSM magmas, particularly those from Units 14 and 31,<br />
incorporated significant amounts of plagioclase during recharge and/or eruption.<br />
What is not is clear is the physical process by which this occurred. Was it via<br />
mixing of magmas with distinct mantle sources? Was it by mixing of genetically<br />
related magmas that had experienced different degrees of partial crystallization?<br />
Was it via accumulation of older genetically related (or unrelated) crystals? I<br />
chose samples from Site 1203 Units 3, 14 and 31 and Site 884 Unit 8 for a micro-<br />
analytical dissection of the crystals that populate distinct segments of non-linear<br />
CSDs to test the hypothesis that plagioclase accumulation affected the bulk com-<br />
positions of these basalts, to explore the possibility of a magma mixing scenario as<br />
an explanation for the non-linear CSDs and textures of DSM pillow basalts, and<br />
to better understand the physical process of plagioclase incorporation by rising<br />
DSM magmas.<br />
3.6.2 Insights from Plagioclase Major Element Compositions<br />
A dichotomy in the An contents of population A and B crystal cores is most<br />
pronounced in the Unit 14 and 31 basalts, where population B crystal cores are<br />
more An-rich than population A cores (Fig. 3.9). The combination of strongly<br />
kinked CSDs (Fig. 3.4e,l) and the distinct core compositions between the two<br />
populations supports the notion that population A and B crystals have separate<br />
124
origins via accumulation or magma mixing. Unit 3 population A and B crystal<br />
cores have overlapping An content, which suggests the two crystal populations<br />
could have formed under similar conditions. There are, however, two groups of<br />
Unit 3 population A crystals in terms of core An content. This grouping may<br />
be an artifact of limited sampling, as the population A crystals from Units 14<br />
and 31 span a similar range of An content. Experimental studies have shown<br />
that in low H2O magmas relatively albite-rich plagioclase crystallizes at elevated<br />
pressure, and growth of An-rich plagioclase is favored in high temperature magmas<br />
at lower pressures [3, 61, 137]. Based strictly upon An content, this suggests that<br />
population B crystals from Units 14 and 31 formed at lower mean pressures in<br />
shallower magma chambers relative to population B crystals from Unit 3 and all<br />
population A crystals.<br />
The lack of variation in Mg# [Mg/(Mg+total Fe)] between crystal populations<br />
is likely related to the poorly constrained manner in which Fe and Mg partition<br />
into plagioclase (i.e., partitioning into more than one site under different condi-<br />
tions; [7, 117]; Fig. 3.9d). The negative correlation of Ti abundance with An<br />
content is undoubtedly related to enhanced Ti partitioning into the more elastic<br />
structure of lower An plagioclase [11] (Fig. 3.9e). However, if each unit is consid-<br />
ered individually, there is minimal correlation of Ti abundance with An content<br />
at An > 70. Based upon this observation, I suggest Unit 3 population B crystals<br />
grew from a magma that was slightly more Ti-rich than parent magmas of popu-<br />
lation B crystals from Units 14 and 31 and much more Ti-rich than Site 884 Unit<br />
8 population B parent magmas.<br />
A working hypothesis based upon CSD results, mineral zoning, and major<br />
element compositions is that the Site 884 Unit 8 and 10 magmas and Site 1203<br />
125
Unit 14 and 31 magmas accumulated older plagioclase crystals. Based strictly<br />
upon CSD results, petrography, plagioclase An variations, and the conclusions of<br />
Huang et al. [72], I suggest that accumulation was the dominant mechanism for<br />
generation of non-linear CSDs. Magmas ascending from depth accumulated crys-<br />
tals from the margins of shallow magma chambers and/or conduits. This magma<br />
experienced minor partial crystallization in a a deeper magma chamber and/or<br />
partial crystallization related to cooling during ascent to form the population A<br />
crystals. As the population B crystals were stirred up and accumulated they were<br />
partially resorbed, which is consistent with my petrographic observations and the<br />
whole-rock results reported by Huang et al. [72]. The Unit 3 magma experienced<br />
minor plagioclase accumulation that was accentuated by flow sorting or plagio-<br />
clase flotation. Unit 3 population A and B crystals appear to share a common<br />
parent magma. At least two different parent magma compositions are recorded in<br />
Units 14 and 31 each, which I suggest were from the same source but had expe-<br />
rienced different degrees of plagioclase-dominated partial (fractional, equilibrium,<br />
or in-situ) crystallization. My limited sampling of Site 884 Unit 8 reflects only one<br />
unique parent magma composition (i.e., that of the population B crystals). Mea-<br />
sured trace element abundances and inferred parent magma compositions allow<br />
us to test this working hypothesis and constrain the parent magma compositions<br />
of each crystal population as well as assess potential differences in source affinity<br />
for each parent magma.<br />
126
3.6.3 Crustal Magma Evolution: Insights from Trace Elements<br />
3.6.3.1 Crystal Population Origins<br />
I use Y as a proxy for the heavy REE (HREE), because Y 3+ has a ionic ra-<br />
dius intermediate between Dy 3+ and Ho 3+ , and REE heavier than Eu are highly<br />
incompatible in plagioclase and thus at or below LA-ICP-MS analytical detection<br />
limits. Ratios of LREE such as La or Ce to Y provide insight into OIB (high<br />
La/Y) vs. MORB (low La/Y) source affinities (see Figs. 3.13, 3.12). Trivalent<br />
La and Ce 3+ have the largest ionic radii of the REE and are the two least com-<br />
patible REE in a crystallizing basaltic assemblage (e.g., plagioclase + olivine ±<br />
clinopyroxene). Lanthanum and Ce are difficult to fractionate from one another by<br />
partial crystallization, and in this sense they provide insight into mantle source<br />
affinity. If Unit 3 population A and B crystals indeed share a common parent<br />
magma, as indicated by their major element similarities, then parent magmas of<br />
these populations should have similar La/Ce and La/Y ratios.<br />
Parent magmas of Unit 3 population A and B crystal cores and Unit 3 whole-<br />
rock data reported by Huang et al. [72] have broadly similar Sr abundances,<br />
La/Ce and La/Y ratios (Figs. 3.12a, 3.13), which supports my initial hypothesis<br />
that population A and B crystals had compositionally similar parent magmas. The<br />
extension of Unit 3 population B parent magmas to slightly higher Sr abundance<br />
can be attributed to crystallization of these older crystals from less fractionated<br />
magmas with a source shared with the population A crystals. The gentle upward<br />
curvature of the plagioclase CSD from the top of Unit 3 supports this notion, as it<br />
provides evidence of minor accumulation of larger (i.e., older) crystals. Accumu-<br />
lation and partial resorption of crystalline debris (i.e., large rounded population<br />
B crystals) was volumetrically minor, such that the resultant bulk-rock compo-<br />
127
sition is similar to parent magmas of large and small crystals. There are three<br />
population A crystal core parent magmas that have notably higher La/Y ratios<br />
(but similar La/Ce to other population A and B parent magmas) that plot outside<br />
Site 1203 tholeiitic basalt field and within a field defined by Mauna Kea shield<br />
stage basalts (Fig. 3.13). Elevated La/Y in a residual magma can be generated<br />
in a region where partial crystallization was dominated by clinopyroxene due to<br />
the greater compatibility of Y relative to La in clinopyroxene. Based upon trace<br />
element data alone it is difficult to determine whether these magmas represent<br />
Hawaii-like end-member magma compositions or whether they came from some<br />
isolated environment where clinopyroxene crystallization dominated. I explore the<br />
latter possibility in the next section.<br />
Unit 14 population A parent magmas consistently range to lower La/Ce, lower<br />
La/Y, and lower Sr, which is consistent with derivation from a more depleted<br />
source than population B magmas (Figs. 3.12b, 3.13). This compositional divi-<br />
sion between population A and B parent magmas is not surprising considering<br />
the kinked nature of the Unit 14 plagioclase CSD relative to the gentle upward<br />
curvature of the Unit 3 CSD. If differences in trace element abundances between<br />
Unit 14 population A and B parent magmas were strictly related to partial crys-<br />
tallization, the lower Sr abundances of parent magmas of later formed crystals<br />
would be expected but not coupled with lower La/Ce and La/Y. I do point out,<br />
however, that while the Sr abundance in the low La/Ce - low La/Y population<br />
A parent magmas is slightly greater than EPR N-MORB and Garrett Transform-<br />
type basalts that were discussed by Huang et al. [72], the low La/Ce and La/Y<br />
ratios are consistent with a relatively depleted mantle source.<br />
On a plot of La/Ce vs. Sr, Unit 14 whole-rock compositions plot between low<br />
128
La/Ce<br />
La/Ce<br />
La/Ce<br />
O<br />
X<br />
Sr (ppm)<br />
Figure 3.12. a) There is little distinction between Unit 3 crystal populations<br />
and Unit 3 whole-rock La/Ce ratios. Population B crystals extend to higher<br />
Sr and population A crystals to lower Sr, which is likely related to degree of<br />
fractionation each parent magma experienced. b) Unit 14 population A and<br />
B parent magmas are distinct from one another. Population A parent<br />
magmas trend to distinctly lower La/Ce, which is consistent with derivation<br />
from a relatively depleted source. A 50-50 mixture of the end-member<br />
compositions shown as boxed X’s yields a hybrid shown as a black star. A<br />
60-40 mixture of the boxed circle and boxed X (higher La/Ce and Sr) yields<br />
a hybrid magma shown as an open star. This simple mixing model can<br />
explain the intermediate bulk-rock compositions of Unit 14 basalts shown as<br />
black triangles (bulk-rock data from [72]). c) Unit 31 Population B parent<br />
fall within a narrow range of La/Ce and extend to higher Sr than the single<br />
population A parent magma reported or Unit 31 whole-rock data [72].<br />
129<br />
A)<br />
B)<br />
C)<br />
X
Sr - low La/Ce population A parent magmas and high La/Ce - high Sr population<br />
B parent magmas, which is consistent with magma mixing (Fig. 3.12b). A simple<br />
binary 50-50 mixture of two compositional end-members, each shown as a boxed<br />
in X in figure 3.12b, yields a bulk-rock composition (shown as a black star in<br />
figure 3.12b) similar to Unit 14 bulk-rock compositions reported by Huang et al.<br />
[72]. The Unit 14 basalt sample I examined has 20% modal abundance plagioclase,<br />
where ∼ 73% of the plagioclase is from population A and ∼ 27% of the plagioclase<br />
is from population B. From this observation it seems unlikely that the bulk-rock<br />
is the a 50-50 mixture. The range of population A parent magma La/Ce indicates<br />
that not all of the population A crystals had similarly depleted parent magmas.<br />
If I represent population A parent magmas as a single hybrid magma with the<br />
La/Ce and Sr characteristics depicted in figure 3.12b as a boxed in circle, 60% of<br />
this magma mixed with 40% of the same population B end-member used previ-<br />
ously results in a bulk-rock composition shown by the open star in figure 3.12b.<br />
Although this may be an excessivley simple model, it does better reconcile the<br />
population A and B modal abundance data with the compositional data.<br />
Based upon the simple model above, I suggest that the Unit 14 basalt is a<br />
mixture of at least two end-member magmas, one slightly more depleted than the<br />
other. I cannot, however, exclude a role for plagioclase accumulation and partial<br />
resorption as was suggested by Huang et al. [72]. Marsh [98] suggested accumu-<br />
lation and partial resorption of crystalline debris is a more common process than<br />
generally recognized and certainly may have had a role during the genesis of the<br />
magma mixing end-members. Indeed, the rounded nature of Unit population B<br />
crystals indicates partial resorption of plagioclase occurred (Fig.3.7). It is appar-<br />
ent from the large compositional range of the Unit 14 population A crystals that<br />
130
division of the plagioclase crystals into two populations in this rock may be an<br />
oversimplification. It also may suggest that crystals and crystalline debris was<br />
recycled throughout the DSM magmatic system (e.g., [37, 98]).<br />
Figure 3.13. The majority of population A and B parent magmas are within<br />
analytical uncertainty of overlapping the field defined by tholeiitic basalts<br />
from Sites 1203 and 884 Fields (data from [72, 119]). Select samples extend<br />
to higher La/Y and plot within the field defined by Mauna Kea shield stage<br />
basalts. Elevated La/Y can also be explained by derivation of the crystal<br />
from an environment where late stage clinopyroxene crystallization was<br />
significant, which would elevate La/Y (i.e., D La<br />
cpx
The Unit 31 plagioclase CSD is kinked in manner similar to the Unit 14 basalt,<br />
which may indicate another instance of magma mixing. I successfully measured<br />
trace elements in only one Unit 31 population A crystal, which has lower Sr,<br />
similar La/Ce and La/Y in its parent magma relative to Unit 31 population B<br />
parent magmas. It is difficult to test this hypothesis due to a lack of population<br />
A compositional data. Unit 31 whole-rock data has similar La/Ce and La/Y as<br />
the population B parent magmas but is offset to lower Sr, which indicates that<br />
they were derived from a similar mantle source (Fig. 3.12c). I suggest plagioclase<br />
accumulation was an important process during the petrogenesis of the Unit 31<br />
basalt, although I cannot rule out magma mixing as a process at least partially<br />
responsible for the final texture and composition of this basalt.<br />
The two crystals I examined from Site 884 Unit 8 have distinctly lower La/Y<br />
ratios and Sr abundances in the calculated parent magmas than Site 1203 basalts<br />
(Fig. 3.13). The core of the two population B crystals I examined have similar<br />
La/Y ratios and greater Sr relative to bulk-rock samples reported by Regelous<br />
et al. [119]. This is consistent with accumulation scenario, as was suggested for<br />
Site 1203 Units 3 and 31, where the population B crystals were derived from<br />
a magma similar to that which produced the population A crystals, which was<br />
probably related to that represented by the bulk-rock composition. A depleted<br />
source component is most apparent in Site 884 basalts, and may be best recorded<br />
in the early formed population B crystals that clearly crystallized from a magma<br />
less modified by fractional crystallization than the bulk rock (i.e., higher Sr).<br />
132
3.6.4 The Crystal Record of Highly Evolved Magmas<br />
Upon magma emplacement and the onset of conductive cooling mushy bound-<br />
ary layers form along magma chamber margins and floors. Boundary mush layers<br />
are rheological elements of multiply saturated solidification fronts defined as hav-<br />
ing crystallinities between 25% and 50%-55% [98]. Crystallization within the so-<br />
lidification front in energetically favorable, and in this relatively stagnant environ-<br />
ment interstitial melts can evolve rapidly and significantly [84, 98]. Crystallization<br />
within the mush zone produces interstitial melts that are evolved relative to the<br />
magma in the chamber interior, and continued crystallization traps these evolved<br />
melts within the solidification front [84, 98]. Mineral phases with compositions out<br />
of equilibrium with main magma body can grow deep within solidification fronts<br />
where they are thermally and mechanically insulated from the hot magma cham-<br />
ber interior [84]. Capture of crystals by advancing solidification fronts is greatest<br />
along magma chamber floors due to gravitational settling, and the thickness of<br />
these cumulates in any given magma chamber may become quite significant if re-<br />
peated input and storage of crystal carrying magmas occurs from deeper magma<br />
chambers [98].<br />
Crystal debris may be mobilized from mushy cumulate layers and solidification<br />
fronts by erosion, density and convection driven plumes, or stirring by new magma<br />
input [83, 98]. If the introduction of mushy crystal debris and evolved interstitial<br />
liquid to the main magma body is small relative to the size of the magma body,<br />
the effect on bulk magma compositions would be negligible. Crystals that survive<br />
this movement of mushy debris into the main magma body thus may provide the<br />
only evidence of this process. I suggest plagioclase crystals with elevated parent<br />
magma La/Y and lower Sr grew deep within mush zones where crystallization<br />
133
was dominated by late stage clinopyroxene crystallization. I suggest there was<br />
minimal clinopyroxene crystallization outside of the mush layer interstitial spaces.<br />
3.6.5 Ba and Sr variations: Evidence for Polybaric Crystallization?<br />
Plagioclase parent magmas of the three Site 1203 basalts and the single Site<br />
884 basalt I examined plot within fields defined by Detroit Seamount basalts in<br />
Sr vs. Ba space (Fig. 3.14). This indicates there was not significant involvement<br />
of extreme magma compositions such as the low Sr type magmas from Garrett<br />
Transform fault (c.f., [72]). A number of linear trends are apparent in figure 3.14<br />
that can be explained by simple fractional crystallization of olivine and plagio-<br />
clase, which Huang et al. [72] suggested were the dominant crystallizing phases<br />
in DSM tholeiitic basalts. The slope of each fractionation trend is related to the<br />
proportions of plagioclase and olivine during crystallization. The steepest trends<br />
correspond to environments where partial crystallization was dominated by olivine<br />
(Fig. 3.14b, and the shallowest trends in figure 3.14 correspond to environments<br />
where partial crystallization was dominated by plagioclase. Hash marks on the<br />
model lines in figure 3.14b mark 10% increments of fractional crystallization. The<br />
three steepest trends (i.e., olivine dominated) in figure 3.14 consist of Unit 3, 14,<br />
and 31 population B parent magmas, although the majority of Unit 31 population<br />
B parent magmas exhibit a single shallower plagioclase dominated fractionation<br />
trend.<br />
Increased pressure increases Al2O3 in magmas along the olivine gabbro cotectic<br />
[66]. A physical manifestation of this relationship is a greater proportion plagio-<br />
clase in the crystallizing assemblage at increased pressure. Experimental results<br />
have demonstrated that relatively albite-rich plagioclase crystallizes at elevated<br />
134
Sr (ppm)<br />
Sr (ppm)<br />
A)<br />
B)<br />
Site 1203<br />
tholeiitic basalts<br />
Site 884<br />
tholeiitic basalts<br />
*<br />
*<br />
*<br />
*<br />
Ba (ppm)<br />
*<br />
*<br />
Site 883 and Site 1204<br />
alkalic basalts<br />
* PL:OL; Ba, Sr<br />
PL(%):OL(%); Ba (ppm at start), Sr (ppm at start)<br />
Figure 3.14. a) Population A and B parent magmas have Sr and Ba<br />
abundance that, by majority, overlap the field defined tholeiitic basalts from<br />
Sites 1203 and 884 (both whole-rock and glass sample data from [72, 119].<br />
Several linear trends are apparent, which are consistent with progressive Sr<br />
and Ba enrichment related to partial crystallization that was dominated by<br />
olivine and plagioclase. b) The steepest trends correspond to environments<br />
where crystallization was dominated by olivine, which is favored at lower<br />
mean pressures. The steep trends are consist primarily of population B<br />
parent magmas. The starting composition of each modeled trend is shown as<br />
a black star. The shallower trends that consiste largely of population A<br />
parent magmas correspond to environments where crystallization was<br />
dominated by plagioclase. Higher pressure increases Al2O3 along the olivine<br />
gabbro cotectic, which stabilizes greater plagioclase fractions at greater<br />
pressure [66]. From this I suggest that polybaric partial crystallization was<br />
significant during petrogenesis of Detroit Seamount lavas.<br />
135<br />
*<br />
*
pressure, and growth of An-rich plagioclase is favored in high temperature mag-<br />
mas at lower mean pressure (e.g., [3, 61, 137]). Population B crystals are An-rich<br />
and have parent magmas that make up the steepest fractionation trends in Sr vs.<br />
Ba space, whereas population A parent magmas constitute the shallowest trends<br />
(Fig. 3.14). From this I suggest that population B crystals formed in shallow<br />
magma chambers than population B crystals and were added to magmas carrying<br />
population A crystals either by accumulation (i.e., Site 1203 Units 3 and 31; Site<br />
884 Unit 8) or magma mixing (i.e., Unit 14). Each of the Units I examined from<br />
Site 1203 exhibit evidence of partial crystallization in at least two distinct envi-<br />
ronments, which can be easily explained by polybaric crystallization. Although<br />
my modeling considered only olivine and plagioclase fractionation, small amounts<br />
of clinopyroxene fractionation would not have significantly affected the slopes of<br />
the fractionation trends, as Sr is incompatible and Ba is highly incompatible in<br />
clinopyroxene.<br />
3.7 Summary and Conclusions: Insights Into the Petrogenesis of Depleted De-<br />
troit Seamount Basalts<br />
There is an undeniable role for plagioclase fractionation and accumulation in<br />
the petrogenesis of Detroit Seamount tholeiitic basalts. I see no evidence for a<br />
similar role during the genesis of alkalic basalts (i.e., Site 1203 alkalic basalts<br />
shown in Fig. 13 of Huang et al. [72]). I conclude that the Detroit Seamount<br />
magma chamber system was complex and consisted of extensive mush zones and<br />
multiple interconnected chambers. Evidence of mixing between relatively depleted<br />
and enriched end-member magmas recorded in the hybrid Unit 14 basalt do not<br />
contradict existing models seeking to explain the origin of the depleted component<br />
136
in Detroit Seamount basalts. Unit 14 magma mixing does suggest, however, that<br />
subtle variations in partial melting or source compositions do occur over relatively<br />
short time spans but may be easily overlooked in whole-rock compositional studies.<br />
I suggest this variation is consistent with subtle variations in partial melting of<br />
a heterogeneous mantle source that consisted of relatively depleted and relatively<br />
enriched components (cf. [50, 72, 119]) Subtle variations in partial melting are<br />
consistent with enhanced mantle flow and complex mantle dynamics in the near<br />
ridge hotspot environment as discussed by Pearce [114]. The nature of the depleted<br />
component in Detroit Seamount basalts is prominent in tholeiitic basalts from Site<br />
884, and perhaps most prominent in the cm-size plagioclase phenocrysts. These<br />
large crystals have low Sr parent magmas suggesting they were less evolved than<br />
their host basalt. A fruitful continuation of this research would be to conduct Sr<br />
and Pb isotope studies on these large crystals by in-situ microdrilling (e.g., [39])<br />
or plagioclase separation (e.g., [16]).<br />
137
138<br />
TABLE 3.3<br />
PLAGIOCLASE PHENOCRYST MAJOR <strong>AND</strong> TRACE ELEMENT<br />
DATA<br />
Sample Zone 1 2<br />
Pop. An FeOT P2O5 K2O TiO2 Na2O CaO MgO SiO2 Al2O3 Total Mg# Ti Rb Sr Y Ba La Ce Nd Sm Eu<br />
(mol%)<br />
3<br />
Site 1203 Unit 3<br />
A C B 80 0.63 0.15 0.03 0.06 2.20 15.91 0.19 47.15 33.81 100.13 0.19 275.2 – 393 0.14 10.2 0.28 0.76 0.33 0.05 0.23<br />
A I B 74 0.67 0.15 0.06 0.06 2.88 15.04 0.19 48.82 32.75 100.62 0.18 – – 378 0.15 10.4 0.28 0.77 0.26 0.08 0.28<br />
A I B 75 0.67 0.13 0.04 0.06 2.72 15.08 0.18 48.62 32.87 100.37 0.18 269.2 – 369 0.14 9.89 0.28 0.75 0.29 0.09 0.25<br />
A I B 80 0.71 0.13 0.02 0.01 2.20 16.16 0.21 46.89 33.47 99.80 0.18 277.0 – 391 0.10 9.92 0.29 0.72 0.30 0.05 0.25<br />
A I B 80 0.62 0.15 0.03 0.04 2.25 16.05 0.17 46.57 33.33 99.22 0.18 288.4 – 395 0.13 10.4 0.32 0.72 0.26 0.08 0.25<br />
A I B 80 0.64 0.15 0.02 0.07 2.20 16.03 0.18 46.44 33.68 99.41 0.18 293.2 – 400 0.14 10.5 0.31 0.77 0.33 0.08 0.25<br />
A I B 79 0.66 0.16 0.04 0.04 2.27 15.51 0.17 47.69 32.97 99.50 0.17 299.2 – 369 0.11 9.54 0.27 0.71 0.27 0.07 0.22<br />
A I B 78 0.64 0.16 0.03 0.03 2.34 15.60 0.18 46.43 34.05 99.46 0.18 277.0 – 360 0.11 9.43 0.28 0.68 0.25 0.03 0.23<br />
A I B 78 0.65 0.16 0.02 0.05 2.43 15.61 0.19 47.38 32.91 99.41 0.19 – – – – – – – – – –<br />
A R B 70 0.77 0.13 0.05 0.05 3.20 13.91 0.22 49.15 32.06 99.55 0.18 – – – – – – – – – –<br />
B C B 79 0.64 0.16 0.03 0.03 2.29 15.53 0.18 47.93 32.61 99.40 0.18 257.2 – 355 0.10 9.23 0.28 0.63 0.25 0.09 0.24<br />
continued...
139<br />
TABLE 3.3<br />
Continued<br />
Sample Zone Pop. An FeOT P2O5 K2O TiO2 Na2O CaO MgO SiO2 Al2O3 Total Mg# Ti Rb Sr Y Ba La Ce Nd Sm Eu<br />
(mol%)<br />
B I B 80 0.64 0.14 0.03 0.04 2.16 15.79 0.17 48.03 32.65 99.66 0.17 268.0 – 362 0.11 9.37 0.27 0.70 0.27 0.05 0.26<br />
B I B 80 0.64 0.14 0.03 0.04 2.19 15.68 0.18 48.44 32.77 100.12 0.17 257.8 – 358 0.11 9.28 0.27 0.72 0.29 0.05 0.25<br />
B I B 78 0.67 0.15 0.04 0.05 2.38 15.19 0.20 48.94 32.19 99.80 0.19 271.0 – 343 0.12 9.17 0.27 0.67 0.23 0.06 0.19<br />
B R B 73 0.68 0.13 0.05 0.06 2.75 13.84 0.21 49.87 31.52 99.12 0.19 – – – – – – – – – –<br />
C C B 81 0.65 0.12 0.04 0.03 2.09 16.17 0.18 47.29 33.86 100.44 0.18 296.2 – 366 0.11 9.14 0.29 0.70 0.35 0.04 0.25<br />
C C B 80 0.62 0.15 0.03 0.00 2.22 15.77 0.18 47.21 33.46 99.65 0.19 321.3 – 363 0.10 9.61 0.29 0.69 0.25 0.06 0.22<br />
C I B 79 0.61 0.13 0.03 0.03 2.26 15.79 0.17 46.96 33.34 99.33 0.18 314.7 – 362 0.10 9.41 0.29 0.67 0.23 0.05 0.23<br />
C I B 77 0.65 0.11 0.05 0.04 2.45 15.43 0.19 47.78 32.86 99.56 0.18 321.9 – 360 0.13 9.47 0.29 0.71 0.25 0.08 0.25<br />
C I B 71 0.67 0.11 0.06 0.06 3.20 14.12 0.23 49.34 31.70 99.48 0.21 375.3 – 336 0.09 9.85 0.24 0.63 0.24 0.06 0.21<br />
C I B 78 0.66 0.11 0.04 0.03 2.43 15.33 0.18 47.66 32.61 99.05 0.17 398.7 – 373 0.11 10.7 0.31 0.64 0.33 0.06 0.25<br />
C I B 77 0.66 0.11 0.05 0.05 2.51 14.98 0.19 48.20 32.47 99.21 0.18 343.5 – 353 0.08 9.8 0.25 0.71 0.25 0.05 0.22<br />
C I B 78 0.62 0.12 0.04 0.04 2.36 15.37 0.18 47.93 32.54 99.20 0.19 313.5 – 354 0.14 9.34 0.32 0.68 0.27 0.06 0.24<br />
C R B 69 0.67 0.11 0.04 0.05 3.37 13.67 0.22 49.62 31.29 99.04 0.2 410.1 – 334 0.11 10.3 0.25 0.68 0.24 0.06 0.25<br />
continued...
140<br />
TABLE 3.3<br />
Continued<br />
Sample Zone Pop. An FeOT P2O5 K2O TiO2 Na2O CaO MgO SiO2 Al2O3 Total Mg# Ti Rb Sr Y Ba La Ce Nd Sm Eu<br />
(mol%)<br />
D-L C B 80 0.69 0.16 0.03 0.03 2.30 16.45 0.18 48.49 33.04 101.37 0.17 272.2 – 373 0.12 9.84 0.30 0.67 0.29 0.04 0.26<br />
D-L C B 81 0.66 0.15 0.04 0.04 2.12 16.40 0.19 48.51 33.31 101.43 0.18 – – – – – – – – – –<br />
D-L I B 79 0.68 0.16 0.03 0.03 2.32 15.99 0.18 48.83 33.06 101.28 0.17 289.0 – 371 0.09 9.62 0.29 0.75 0.32 0.06 0.22<br />
D-L I B 78 0.65 0.15 0.04 0.04 2.33 15.50 0.18 48.39 32.07 99.36 0.18 286.6 – 364 0.13 9.74 0.28 0.72 0.29 0.07 0.21<br />
D-L I B 79 0.66 0.14 0.03 0.05 2.32 15.74 0.18 48.84 32.49 100.46 0.17 291.4 – 368 0.09 9.84 0.31 0.73 0.35 0.06 0.21<br />
D-L R B 73 0.72 0.13 0.05 0.06 2.83 13.85 0.21 51.15 30.48 99.49 0.19 – – – – – – – – – –<br />
D-S1 C A 75 0.67 0.14 0.05 0.02 2.71 15.05 0.22 48.86 32.57 100.30 0.2 – – – – – – – – – –<br />
D-S1 C A 76 0.68 0.11 0.04 0.01 2.65 14.98 0.20 48.91 32.47 100.05 0.18 321.9 – 367 0.06 10.6 0.28 0.68 0.24 0.12 0.20<br />
D-S1 I A 74 0.73 0.12 0.05 0.03 2.86 14.97 0.19 49.67 32.24 100.86 0.17 290.2 – 355 0.04 9.96 0.39 0.59 0.36 0.16 0.20<br />
D-S1 I A 75 0.62 0.15 0.03 0.05 2.70 14.84 0.17 49.53 32.35 100.45 0.18 308.2 – 373 0.11 10.6 0.28 0.63 0.22 0.13 0.31<br />
D-S1 I A 79 0.67 0.15 0.05 0.03 2.32 15.63 0.15 48.64 32.67 100.31 0.15 271.6 – 369 0.11 9.7 0.26 0.66 0.34 0.09 0.23<br />
D-S1 I A 78 0.68 0.14 0.05 0.03 2.42 15.68 0.18 47.76 32.82 99.75 0.17 – – – – – – – – – –<br />
D-S1 R A 68 0.73 0.12 0.06 0.07 3.48 13.81 0.21 49.76 30.92 99.17 0.18 402.3 – 372 0.07 13.2 0.33 0.87 0.36 0.08 0.22<br />
continued...
141<br />
TABLE 3.3<br />
Continued<br />
Sample Zone Pop. An FeOT P2O5 K2O TiO2 Na2O CaO MgO SiO2 Al2O3 Total Mg# Ti Rb Sr Y Ba La Ce Nd Sm Eu<br />
(mol%)<br />
D-S1 R A 66 0.75 0.13 0.07 0.08 3.75 13.12 0.22 50.88 29.97 98.97 0.18 446.0 – 364 0.14 12.8 0.34 0.63 0.24 0.08 0.24<br />
D-S2 C A 78 0.61 0.12 0.03 0.04 2.34 15.28 0.19 48.17 32.00 98.79 0.19 272.2 – 363 0.14 9.99 0.22 0.75 0.26 0.08 0.18<br />
D-S2 I A 73 0.67 0.12 0.04 0.04 2.98 14.49 0.22 49.32 31.55 99.43 0.2 344.7 – 365 0.04 9.71 0.30 0.68 0.09 0.13 0.32<br />
D-S2 I A 78 0.66 0.12 0.03 0.06 2.43 15.33 0.20 48.36 32.18 99.39 0.19 323.7 – 377 0.10 10.1 0.26 0.70 0.23 0.09 0.25<br />
D-S2 I A 79 0.71 0.13 0.04 0.07 2.26 15.37 0.18 47.79 32.25 98.79 0.16 297.4 – 363 0.08 9.48 0.25 0.81 0.28 0.12 0.25<br />
D-S2 R A 62 0.90 0.12 0.08 0.09 4.05 12.09 0.20 52.54 28.76 98.83 0.15 530.0 – 386 0.12 22.8 0.32 0.84 0.29 0.09 0.26<br />
E-1 I A 80 0.63 0.14 0.03 0.04 2.17 15.79 0.17 48.58 32.75 100.30 0.17 270.4 – 367 0.10 9.46 0.32 0.71 0.32 0.04 0.24<br />
E-1 I A 80 0.65 0.15 0.03 0.04 2.16 15.68 0.18 48.02 32.40 99.31 0.18 263.8 – 359 0.09 9.3 0.24 0.68 0.28 0.06 0.22<br />
E-1 I A 78 0.62 0.16 0.03 0.03 2.35 15.19 0.19 48.37 32.01 98.95 0.2 – – – – – – – – – –<br />
E-1 I A 81 0.67 0.18 0.03 0.04 2.07 15.82 0.17 47.62 32.80 99.40 0.17 267.4 – 358 0.10 9.47 0.29 0.72 0.22 0.05 0.20<br />
E-1 I A 80 0.63 0.15 0.03 0.05 2.09 15.75 0.17 47.69 32.68 99.23 0.17 288.4 – 379 0.11 9.7 0.28 0.72 0.32 0.06 0.26<br />
E-1 R A 69 0.70 0.15 0.07 0.07 3.52 14.03 0.22 51.15 31.00 100.90 0.2 – – – – – – – – – –<br />
F C A 80 0.70 0.12 0.02 0.01 2.15 15.79 0.18 48.11 33.69 100.76 0.16 280.0 – 358 0.09 8.75 0.31 0.69 0.28 0.04 0.21<br />
continued...
142<br />
TABLE 3.3<br />
Continued<br />
Sample Zone Pop. An FeOT P2O5 K2O TiO2 Na2O CaO MgO SiO2 Al2O3 Total Mg# Ti Rb Sr Y Ba La Ce Nd Sm Eu<br />
(mol%)<br />
F I A 81 0.63 0.15 0.02 0.04 2.13 16.09 0.17 47.78 33.43 100.44 0.17 285.4 – 367 0.10 8.91 0.34 0.66 0.25 0.05 0.24<br />
F I A 73 0.63 0.13 0.04 0.03 2.97 14.35 0.23 49.71 31.98 100.06 0.22 305.2 – 342 0.13 9.64 0.30 0.57 0.32 0.05 0.23<br />
F I A 80 0.64 0.15 0.02 0.07 2.15 15.93 0.16 47.48 33.83 100.41 0.16 266.2 – 363 0.12 8.79 0.32 0.68 0.31 0.07 0.24<br />
F I A 78 0.61 0.14 0.03 0.08 2.38 15.53 0.19 47.94 33.22 100.12 0.19 269.2 – 355 0.11 8.97 0.30 0.66 0.31 0.07 0.21<br />
F I A 79 0.64 0.11 0.02 0.02 2.34 15.56 0.18 48.36 33.22 100.45 0.18 304.0 – 367 0.14 9.81 0.27 0.71 0.31 0.05 0.25<br />
F R A 64 0.77 0.10 0.06 0.08 3.97 12.72 0.22 52.29 30.22 100.43 0.18 565.9 – 428 0.16 26.3 0.43 1.02 0.33 0.06 0.35<br />
H I A 77 0.64 0.14 0.04 0.04 2.50 15.08 0.20 48.88 32.21 99.73 0.2 285.4 – 362 0.09 9.89 0.28 0.70 0.29 0.07 0.22<br />
H I A 78 0.62 0.12 0.03 0.02 2.34 15.48 0.19 47.60 32.63 99.04 0.19 276.4 – 360 0.16 9.29 0.28 0.73 0.28 0.06 0.25<br />
H I A 81 0.64 0.15 0.05 0.03 2.04 15.64 0.18 48.76 32.88 100.36 0.18 285.4 – 369 0.11 9.87 0.25 0.66 0.26 0.08 0.23<br />
H I A 80 0.60 0.18 0.03 0.03 2.16 15.78 0.18 47.92 33.04 99.91 0.19 245.8 – 364 0.13 9.13 0.29 0.68 0.28 0.04 0.25<br />
H R A 64 0.70 0.12 0.06 0.07 3.79 12.57 0.21 50.58 29.72 97.82 0.19 – – – – – – – – – –<br />
J C B 78 0.65 0.12 0.04 0.04 2.37 15.18 0.18 47.27 33.38 99.25 0.18 293.8 – 353 0.11 8.6 0.31 0.63 0.25 0.04 0.21<br />
J I B 75 0.62 0.11 0.05 0.04 2.77 14.85 0.19 48.37 32.71 99.70 0.19 296.2 – 346 0.11 8.55 0.32 0.63 0.26 0.10 0.22<br />
continued...
143<br />
TABLE 3.3<br />
Continued<br />
Sample Zone Pop. An FeOT P2O5 K2O TiO2 Na2O CaO MgO SiO2 Al2O3 Total Mg# Ti Rb Sr Y Ba La Ce Nd Sm Eu<br />
(mol%)<br />
J I B 82 0.60 0.12 0.02 0.03 1.95 15.87 0.16 46.59 33.67 99.01 0.17 234.4 – 351 0.11 7.7 0.29 0.67 0.28 0.07 0.22<br />
J I B 78 0.59 0.12 0.03 0.01 2.32 15.31 0.16 48.34 32.68 99.56 0.17 283.0 – 351 0.11 8.82 0.28 0.59 0.27 0.05 0.24<br />
J I B 77 0.61 0.12 0.04 0.04 2.43 14.68 0.18 47.98 32.94 99.02 0.18 277.6 – 340 0.12 8.84 0.26 0.67 0.27 0.07 0.23<br />
J R B 61 0.84 0.10 0.08 0.09 4.34 12.58 0.18 53.41 28.05 99.67 0.14 – – – – – – – – – –<br />
PL-A C A 64 0.85 0.08 0.07 0.11 4.07 13.03 0.22 51.35 29.89 99.68 0.17 – – – – – – – – – –<br />
PL-B C A 62 0.86 0.10 0.08 0.09 4.23 12.45 0.19 52.17 29.65 99.81 0.15 – – – – – – – – – –<br />
PL-C C A 65 0.86 0.12 0.06 0.10 3.96 13.31 0.21 52.31 29.95 100.88 0.16 – – – – – – – – – –<br />
PL-C R A 59 0.86 0.11 0.18 0.09 4.47 12.04 0.19 53.20 29.63 100.78 0.14 – – – – – – – – – –<br />
PL-D C A 62 0.85 0.10 0.08 0.06 4.17 12.51 0.21 52.48 30.04 100.50 0.16 449.0 – 381 0.16 17.6 0.31 0.76 0.28 0.09 0.27<br />
PL-E C A 64 0.85 0.08 0.06 0.09 3.99 13.13 0.20 51.43 30.37 100.22 0.15 – – – – – – – – – –<br />
PL-G C A 64 0.68 0.10 0.07 0.09 3.98 12.72 0.25 50.57 30.60 99.06 0.22 398.1 – 354 0.10 14.8 0.44 0.74 0.30 0.10 0.26<br />
PL-G R A 66 0.64 0.10 0.05 0.04 3.76 13.60 0.21 50.67 31.03 100.11 0.2 388.5 – 352 0.07 12.7 0.27 0.69 0.30 0.08 0.27<br />
PL-F I B 80 0.71 0.15 0.04 0.03 2.13 16.01 0.17 48.00 33.49 100.72 0.16 225.4 – 355 0.13 8.64 0.24 0.67 0.25 0.12 0.23<br />
continued...
144<br />
TABLE 3.3<br />
Continued<br />
Sample Zone Pop. An FeOT P2O5 K2O TiO2 Na2O CaO MgO SiO2 Al2O3 Total Mg# Ti Rb Sr Y Ba La Ce Nd Sm Eu<br />
(mol%)<br />
PL-F C B 74 0.61 0.12 0.04 0.07 2.93 15.12 0.20 49.83 32.19 101.11 0.2 – – – – – – – – – –<br />
PL-F R B 66 0.83 0.10 0.08 0.03 3.90 13.63 0.22 51.73 31.01 101.52 0.17 – – – – – – – – – –<br />
PL-H C A 63 0.78 0.08 0.06 0.08 4.16 12.77 0.24 52.15 29.83 100.17 0.19 489.2 – 405 0.09 22.2 0.41 0.93 0.33 0.09 0.42<br />
X1 C B 81 0.67 0.21 0.03 0.01 1.98 15.54 0.11 47.20 33.93 99.68 0.12 – – – – – – – – – –<br />
X1 I B 75 0.70 0.17 0.05 0.05 2.66 14.35 0.14 49.30 32.60 100.03 0.14 – – – – – – – – – –<br />
X1 R B 65 0.73 0.13 0.07 0.06 3.72 12.77 0.21 51.81 30.72 100.22 0.18 – – – – – – – – – –<br />
X4 C B 79 0.58 0.17 0.04 0.04 2.16 14.75 0.17 49.12 32.84 99.88 0.18 – – – – – – – – – –<br />
X4 I B 77 0.60 0.17 0.04 0.04 2.34 14.46 0.17 48.98 32.93 99.73 0.18 – – – – – – – – – –<br />
X4 R B 68 0.69 0.14 0.07 0.05 3.39 13.10 0.20 52.05 30.45 100.14 0.18 – – – – – – – – – –<br />
X2-1 C B 79 0.72 0.16 0.03 0.04 2.26 15.47 0.13 48.98 32.41 100.21 0.12 – – – – – – – – – –<br />
X2-1 C B 79 0.71 0.16 0.04 0.04 2.26 15.42 0.13 49.19 32.32 100.28 0.13 – – – – – – – – – –<br />
X2-1 I B 70 0.72 0.15 0.05 0.05 3.11 13.53 0.16 51.99 30.35 100.12 0.15 – – – – – – – – – –<br />
X2-1 I B 77 0.75 0.17 0.05 0.05 2.40 14.81 0.14 50.03 31.82 100.22 0.13 – – – – – – – – – –<br />
continued...
145<br />
TABLE 3.3<br />
Continued<br />
Sample Zone Pop. An FeOT P2O5 K2O TiO2 Na2O CaO MgO SiO2 Al2O3 Total Mg# Ti Rb Sr Y Ba La Ce Nd Sm Eu<br />
(mol%)<br />
X2-1 R B 71 0.75 0.15 0.06 0.05 3.05 13.56 0.16 51.92 30.55 100.25 0.14 – – – – – – – – – –<br />
Site 1203 Unit 14<br />
A I B 87 0.55 0.16 0.03 0.03 1.43 17.54 0.14 45.00 34.94 99.82 0.16 193.0 – 394 0.16 7.3 0.32 0.69 0.34 0.06 0.25<br />
A C B 82 0.60 0.15 0.04 0.02 2.03 16.62 0.17 47.23 34.06 100.93 0.18 – – – – – – – – – –<br />
A I B 83 0.63 0.13 0.03 0.00 1.90 16.87 0.19 46.33 33.43 99.51 0.19 249.4 – 403 0.12 7.9 0.32 0.59 0.29 0.09 0.24<br />
A I B 86 0.53 0.14 0.02 0.04 1.49 17.21 0.13 45.84 34.56 99.96 0.16 227.2 – 387 0.14 7.2 0.32 0.69 0.33 0.06 0.22<br />
A I B 83 0.64 0.13 0.01 0.01 1.84 16.54 0.16 47.23 33.38 99.95 0.17 226.6 – 380 0.11 7.2 0.28 0.64 0.29 0.05 0.21<br />
A I B 81 0.58 0.16 0.03 0.03 2.08 16.48 0.17 47.43 33.16 100.12 0.18 261.4 – 375 0.11 7.1 0.31 0.55 0.26 0.08 0.22<br />
A I B 82 0.59 0.18 0.01 0.03 2.02 16.44 0.19 47.54 33.62 100.63 0.2 275.8 – 376 0.09 7.4 0.26 0.63 0.31 0.09 0.25<br />
A R B 73 0.59 0.15 0.04 0.09 3.04 14.86 0.21 48.99 31.90 99.86 0.22 245.2 – 333 0.10 6.6 0.26 0.53 0.25 0.05 0.21<br />
A R B 78 0.72 0.13 0.02 0.04 2.41 15.74 0.21 48.37 32.76 100.40 0.18 – – – – – – – – – –<br />
A R B 67 0.81 0.17 0.06 0.00 3.77 13.86 0.29 51.11 30.39 100.47 0.22 – – – – – – – – – –<br />
continued...
146<br />
TABLE 3.3<br />
Continued<br />
Sample Zone Pop. An FeOT P2O5 K2O TiO2 Na2O CaO MgO SiO2 Al2O3 Total Mg# Ti Rb Sr Y Ba La Ce Nd Sm Eu<br />
(mol%)<br />
B C B 81 0.54 0.13 0.04 0.00 2.11 16.14 0.18 47.67 32.91 99.72 0.21 176.3 – 375 0.07 6.3 0.25 0.43 0.19 0.05 0.21<br />
B I B 82 0.61 0.13 0.04 0.04 2.02 16.79 0.19 47.61 33.21 100.64 0.19 226.6 – 377 0.12 6.5 0.27 0.53 0.25 0.10 0.23<br />
B I B 82 0.56 0.12 0.01 0.06 2.08 17.02 0.16 47.32 33.30 100.63 0.18 241.0 – 402 0.14 6.9 0.30 0.53 0.32 0.04 0.22<br />
B I B 81 0.53 0.19 0.03 0.10 2.16 16.76 0.17 47.20 33.60 100.74 0.2 225.4 – 397 0.13 7.3 0.29 0.56 0.27 0.04 0.23<br />
B I B 83 0.61 0.17 0.02 0.03 1.93 17.23 0.14 46.99 33.69 100.82 0.15 245.2 – 396 0.16 7.2 0.36 0.70 0.34 0.10 0.24<br />
B I B 83 0.57 0.18 0.02 0.04 1.92 17.12 0.17 47.49 33.72 101.23 0.19 254.8 – 418 0.16 8.4 0.34 0.63 0.34 0.03 0.25<br />
C1 C B 83 0.57 0.15 0.03 0.03 1.93 16.66 0.17 46.33 33.35 99.22 0.18 260.2 – 357 0.11 6.4 0.30 0.57 0.26 0.07 0.19<br />
C1 I B 83 0.52 0.16 0.05 0.02 1.83 16.70 0.17 45.99 33.80 99.24 0.2 251.8 – 360 0.13 6.2 0.27 0.49 0.27 0.04 0.23<br />
C1 I B 83 0.61 0.16 0.02 0.00 1.90 16.80 0.18 46.91 33.73 100.30 0.19 251.2 – 362 0.14 6.1 0.28 0.57 0.29 0.05 0.17<br />
C1 I B 81 0.60 0.17 0.02 0.03 2.11 16.80 0.17 46.17 33.49 99.57 0.18 278.8 – 375 0.14 7.2 0.32 0.55 0.29 0.06 0.28<br />
D1 C B 83 0.63 0.16 0.01 0.01 1.89 16.58 0.15 46.03 33.56 99.02 0.16 220.6 – 381 0.12 6.1 0.26 0.49 0.26 0.06 0.20<br />
D1 I B 81 0.61 0.20 0.04 0.01 2.14 16.73 0.19 46.92 33.25 100.09 0.2 202.6 – 374 0.12 6.3 0.24 0.48 0.26 0.07 0.22<br />
D1 I B 83 0.58 0.15 0.02 0.04 1.86 16.89 0.15 46.75 33.73 100.15 0.16 226.6 – 388 0.11 6.5 0.25 0.49 0.26 0.08 0.24<br />
continued...
147<br />
TABLE 3.3<br />
Continued<br />
Sample Zone Pop. An FeOT P2O5 K2O TiO2 Na2O CaO MgO SiO2 Al2O3 Total Mg# Ti Rb Sr Y Ba La Ce Nd Sm Eu<br />
(mol%)<br />
D1 I B 83 0.52 0.16 0.03 0.04 1.88 17.19 0.16 46.80 34.19 100.97 0.19 235.6 – 381 0.15 6.8 0.33 0.55 0.28 0.04 0.28<br />
D1 R B 77 0.71 0.19 0.03 0.04 2.63 15.89 0.20 48.25 33.04 100.97 0.18 – – – – – – – – – –<br />
E C B 82 0.58 0.16 0.02 0.04 1.98 16.65 0.19 47.08 32.80 99.50 0.2 271.6 – 390 0.14 7.4 0.26 0.53 0.28 0.06 0.23<br />
E I B 72 0.60 0.12 0.04 0.08 3.03 14.54 0.20 48.76 31.98 99.37 0.21 259.6 – 343 0.11 6.7 0.32 0.56 0.30 0.03 0.18<br />
E R B 73 0.65 0.13 0.05 0.05 3.05 14.82 0.21 49.83 31.48 100.28 0.2 – – – – – – – – – –<br />
E R B 60 1.05 0.10 0.10 0.12 4.62 12.47 0.25 53.18 29.17 101.05 0.15 – – – – – – – – – –<br />
PG1 C A 79 0.80 0.14 0.02 0.08 2.40 16.01 0.19 48.19 32.35 100.18 0.16 – – – – – – – – – –<br />
PG1 R A 67 0.91 0.13 0.05 0.10 3.73 13.56 0.24 51.10 30.18 100.01 0.17 – – – – – – – – – –<br />
PG2 CTR A 72 0.74 0.14 0.04 0.06 3.14 14.39 0.22 49.25 31.30 99.28 0.19 387.3 – 365 0.18 10.2 0.26 0.52 0.45 0.11 0.16<br />
PG3 CTR A 66 0.88 0.13 0.07 0.06 3.75 13.51 0.24 51.56 30.20 100.39 0.17 – – – – – – – – – –<br />
PG4 CTR A 68 0.76 0.14 0.06 0.05 3.61 13.83 0.21 50.70 30.48 99.84 0.18 – – – – – – – – – –<br />
PG5 C A 70 0.77 0.13 0.08 0.04 3.34 14.29 0.20 49.68 31.02 99.55 0.17 – – – – – – – – – –<br />
PG5 R A 66 0.94 0.11 0.06 0.08 3.75 13.59 0.24 50.73 30.70 100.20 0.17 – – – – – – – – – –<br />
continued...
148<br />
TABLE 3.3<br />
Continued<br />
Sample Zone Pop. An FeOT P2O5 K2O TiO2 Na2O CaO MgO SiO2 Al2O3 Total Mg# Ti Rb Sr Y Ba La Ce Nd Sm Eu<br />
(mol%)<br />
PG8 C A 68 0.89 0.13 0.08 0.10 3.68 14.03 0.26 50.27 30.53 99.96 0.18 – – – – – – – – – –<br />
PG8 R A 65 1.00 0.14 0.07 0.08 3.94 13.16 0.27 51.50 30.09 100.24 0.17 – – – – – – – – – –<br />
PG9 C A 70 0.73 0.13 0.06 0.06 3.36 14.48 0.21 50.01 31.00 100.04 0.19 370.5 – 376 0.10 11.9 0.27 0.60 0.35 0.14 0.27<br />
PG9 R A 67 0.94 0.10 0.06 0.10 3.75 13.62 0.27 51.01 29.87 99.73 0.18 – – – – – – – – – –<br />
PG10 CTR A 69 0.81 0.12 0.09 0.07 3.57 14.78 0.25 49.48 31.60 100.79 0.19 – – – – – – – – – –<br />
PG11 CTR A 69 0.96 0.15 0.05 0.07 3.60 14.33 0.28 49.33 30.65 99.42 0.18 – – – – – – – – – –<br />
PG12 CTR A 73 0.81 0.15 0.04 0.07 3.10 15.26 0.23 48.69 32.04 100.40 0.18 – – – – – – – – – –<br />
PG13 CTR A 71 0.81 0.13 0.05 0.06 3.36 14.99 0.24 49.14 31.80 100.59 0.18 – – – – – – – – – –<br />
X1 C B 85 0.58 0.28 0.05 0.02 1.64 16.61 0.18 46.71 34.19 100.27 0.2 – – – – – – – – – –<br />
X1 I B 82 0.58 0.19 0.03 0.04 1.98 16.09 0.17 48.02 33.72 100.82 0.19 – – – – – – – – – –<br />
X2 C B 83 0.57 0.21 0.04 0.03 1.85 16.64 0.16 47.94 33.23 100.67 0.18 – – – – – – – – – –<br />
X2 I B 83 0.57 0.20 0.04 0.02 1.84 16.44 0.17 47.91 33.02 100.21 0.19 – – – – – – – – – –<br />
X2 R B 75 0.67 0.18 0.03 0.05 2.79 14.96 0.22 50.52 31.38 100.80 0.2 – – – – – – – – – –<br />
continued...
149<br />
TABLE 3.3<br />
Continued<br />
Sample Zone Pop. An FeOT P2O5 K2O TiO2 Na2O CaO MgO SiO2 Al2O3 Total Mg# Ti Rb Sr Y Ba La Ce Nd Sm Eu<br />
(mol%)<br />
Y3A CTR A 82 0.69 0.16 0.06 0.09 1.76 14.39 0.26 51.38 30.99 99.79 0.22 – – – – – – – – – –<br />
Y3B C B 81 0.68 0.16 0.04 0.05 1.93 15.08 0.25 50.01 31.67 99.88 0.22 – – – – – – – – – –<br />
Y3B R B 73 0.68 0.18 0.04 0.06 2.96 14.79 0.22 51.29 30.72 100.94 0.2 – – – – – – – – – –<br />
Y3C C A 73 0.67 0.17 0.05 0.06 2.98 14.73 0.24 50.37 30.75 100.02 0.22 – – – – – – – – – –<br />
Y3C I A 75 0.65 0.18 0.05 0.05 2.75 15.13 0.23 50.66 31.23 100.93 0.21 – – – – – – – – – –<br />
Y3D CTR B 74 0.69 0.21 0.04 0.04 2.87 15.04 0.23 50.63 31.20 100.94 0.2 – – – – – – – – – –<br />
Y3E C B 73 0.73 0.15 0.06 0.08 2.97 14.90 0.26 51.06 30.43 100.64 0.22 – – – – – – – – – –<br />
Y3E R B 68 0.81 0.17 0.05 0.08 3.59 14.07 0.27 52.41 29.33 100.78 0.2 – – – – – – – – – –<br />
Y3F C A 74 0.70 0.19 0.04 0.08 2.98 15.45 0.23 49.13 31.47 100.27 0.2 – – – – – – – – – –<br />
Y3F I A 80 0.68 0.19 0.04 0.04 2.30 16.73 0.20 47.55 32.59 100.33 0.18 – – – – – – – – – –<br />
Y3F R A 67 0.87 0.16 0.07 0.10 3.74 13.70 0.26 51.89 29.77 100.55 0.19 – – – – – – – – – –<br />
Y4A CTR A 77 0.67 0.21 0.04 0.04 2.56 16.06 0.21 49.08 31.85 100.74 0.2 – – – – – – – – – –<br />
Y4D C A 73 0.70 0.18 0.05 0.06 3.05 15.31 0.23 49.51 31.29 100.39 0.2 – – – – – – – – – –<br />
continued...
150<br />
TABLE 3.3<br />
Continued<br />
Sample Zone Pop. An FeOT P2O5 K2O TiO2 Na2O CaO MgO SiO2 Al2O3 Total Mg# Ti Rb Sr Y Ba La Ce Nd Sm Eu<br />
(mol%)<br />
Y4D R A 67 0.94 0.18 0.07 0.11 3.59 13.55 0.28 52.27 29.50 100.49 0.19 – – – – – – – – – –<br />
Y4E C A 71 0.68 0.14 0.05 0.07 3.40 15.00 0.25 50.38 30.57 100.54 0.22 – – – – – – – – – –<br />
Y4E R A 56 1.09 0.13 0.11 0.13 4.96 11.51 0.14 54.30 28.01 100.40 0.09 – – – – – – – – – –<br />
Y4F CTR A 69 0.65 0.18 0.06 0.06 3.55 14.72 0.25 50.46 30.79 100.72 0.23 – – – – – – – – – –<br />
Y4G CTR B 71 0.68 0.18 0.04 0.09 3.40 15.01 0.25 50.02 30.83 100.51 0.22 – – – – – – – – – –<br />
Y5A C B 85 0.56 0.23 0.02 0.04 1.69 17.89 0.16 46.29 33.61 100.50 0.18 – – – – – – – – – –<br />
Y5A I B 73 0.65 0.17 0.05 0.04 3.13 15.18 0.23 49.59 31.14 100.20 0.22 – – – – – – – – – –<br />
Y5A R B 66 0.80 0.17 0.07 0.09 3.86 13.80 0.26 51.19 30.06 100.30 0.2 – – – – – – – – – –<br />
Y5B CTR A 72 0.70 0.19 0.05 0.05 3.20 15.39 0.26 48.71 31.07 99.65 0.23 – – – – – – – – – –<br />
Y2A C B 72 0.70 0.19 0.05 0.05 3.23 14.91 0.24 49.48 30.75 99.61 0.21 – – – – – – – – – –<br />
Y2A C B 72 0.62 0.16 0.05 0.06 3.20 15.16 0.23 49.37 30.82 99.66 0.22 – – – – – – – – – –<br />
Y2B CTR A 66 0.85 0.18 0.06 0.07 3.90 14.07 0.30 50.48 29.69 99.61 0.22 – – – – – – – – – –<br />
Y2C R A 71 0.77 0.19 0.06 0.04 3.32 14.79 0.25 49.41 30.77 99.63 0.2 – – – – – – – – – –<br />
continued...
151<br />
TABLE 3.3<br />
Continued<br />
Sample Zone Pop. An FeOT P2O5 K2O TiO2 Na2O CaO MgO SiO2 Al2O3 Total Mg# Ti Rb Sr Y Ba La Ce Nd Sm Eu<br />
(mol%)<br />
Y2C C A 68 0.75 0.23 0.16 0.08 3.62 14.17 0.24 50.21 30.27 99.73 0.2 – – – – – – – – – –<br />
Y2D CTR A 68 0.80 0.15 0.07 0.06 3.69 14.44 0.26 50.59 30.36 100.45 0.2 – – – – – – – – – –<br />
X4 C B 82 0.60 0.19 0.04 0.03 2.09 17.06 0.19 47.83 32.60 100.64 0.2 – – – – – – – – – –<br />
X4 R B 74 0.58 0.21 0.04 0.08 2.97 15.70 0.22 48.70 31.41 99.91 0.22 – – – – – – – – – –<br />
X3 C B 84 0.54 0.20 0.05 0.04 1.83 17.47 0.15 46.22 33.51 100.01 0.18 – – – – – – – – – –<br />
X3 I B 83 0.57 0.23 0.04 0.03 1.99 17.50 0.16 47.92 32.41 100.87 0.18 – – – – – – – – – –<br />
XLE1 C A 69 0.55 0.14 0.05 0.05 3.37 13.80 0.23 50.32 31.42 99.93 0.25 367.5 – 348 0.09 9.2 0.23 0.56 0.32 0.06 0.18<br />
XLE2 C A 68 0.67 0.14 0.05 0.06 3.45 13.65 0.24 50.02 31.07 99.35 0.22 469.4 – 371 0.18 8.5 0.32 0.49 0.15 0.12 0.24<br />
XLE3 C A 68 0.65 0.15 0.04 0.05 3.56 13.81 0.24 50.97 31.34 100.82 0.23 494.6 – 362 0.16 10.2 0.30 0.58 0.33 0.12 0.25<br />
XLE4 C A 70 0.64 0.16 0.04 0.05 3.26 14.10 0.23 50.19 31.92 100.59 0.21 472.4 – 385 0.16 10.8 0.30 0.86 0.16 0.10 0.28<br />
XLB1 C A 70 0.66 0.16 0.08 0.04 3.27 13.88 0.26 50.71 30.62 99.68 0.24 429.3 – 406 0.10 16.1 0.35 0.73 0.33 0.08 0.26<br />
XLB1 C A 67 0.60 0.10 0.05 0.06 3.57 12.98 0.25 50.61 31.40 99.62 0.25 401.1 – 382 0.08 14.9 0.32 0.70 0.33 0.05 0.24<br />
XLB2 C A 68 0.63 0.18 0.07 0.08 3.39 13.29 0.22 50.80 32.00 100.66 0.22 371.7 – 373 0.11 10.4 0.33 0.63 0.28 0.05 0.21<br />
continued...
152<br />
TABLE 3.3<br />
Continued<br />
Sample Zone Pop. An FeOT P2O5 K2O TiO2 Na2O CaO MgO SiO2 Al2O3 Total Mg# Ti Rb Sr Y Ba La Ce Nd Sm Eu<br />
(mol%)<br />
XLB2 C A 69 0.60 0.09 0.02 0.10 3.38 13.46 0.24 50.34 32.01 100.23 0.24 359.1 – 368 0.12 9.9 0.29 0.61 0.30 0.03 0.24<br />
XLB3 C A 65 0.62 0.13 0.05 0.07 3.77 12.92 0.23 51.22 31.31 100.32 0.22 444.8 – 338 0.10 9.7 0.20 0.60 0.20 0.17 0.30<br />
XLB3 C A 64 0.62 0.15 0.05 0.02 3.85 12.57 0.24 51.55 31.02 100.08 0.23 392.1 – 378 0.09 12.6 0.29 0.59 0.22 0.03 0.26<br />
XLB4 C A 66 0.65 0.12 0.04 0.07 3.50 12.57 0.23 50.22 32.25 99.66 0.22 451.4 – 320 0.18 9.8 0.32 0.58 0.05 0.12 0.14<br />
XLC1 C A 69 0.63 0.15 0.03 0.04 3.37 13.68 0.20 50.31 32.51 100.93 0.2 377.7 – 379 0.09 11.6 0.31 0.70 0.32 0.05 0.25<br />
XLC1 C A 68 0.61 0.14 0.05 0.06 3.49 13.36 0.24 50.27 32.10 100.32 0.23 456.2 – 373 0.18 11.2 0.26 0.72 0.24 0.12 0.25<br />
XLC2 C A 66 0.63 0.14 0.06 0.09 3.68 13.03 0.24 50.95 31.90 100.71 0.23 507.8 – 357 0.16 11.3 0.20 0.73 0.26 0.14 0.19<br />
XLC2 C A 67 0.56 0.16 0.05 0.09 3.53 13.02 0.21 50.06 31.89 99.56 0.22 365.7 – 370 0.08 10.7 0.28 0.60 0.31 0.05 0.24<br />
XLC3 C A 71 0.63 0.14 0.04 0.05 3.13 13.74 0.24 50.05 32.65 100.66 0.23 365.7 – 374 0.09 9.8 0.26 0.60 0.22 0.03 0.26<br />
XLC4 C A 67 0.66 0.12 0.10 0.06 3.48 12.86 0.26 50.55 31.59 99.68 0.23 420.9 – 336 0.16 9.6 0.28 0.58 0.24 0.20 0.28<br />
XLC5 C A 66 0.66 0.14 0.04 0.05 3.60 12.82 0.23 50.36 31.89 99.79 0.21 480.8 – 338 0.13 12.1 0.28 0.67 0.19 0.08 0.26<br />
XLD1 C A 68 0.70 0.13 0.03 0.08 3.45 13.44 0.25 50.25 32.00 100.33 0.22 380.7 – 399 0.11 13.8 0.34 0.64 0.31 0.05 0.24<br />
XLD1 C A 68 0.61 0.11 0.07 0.06 3.50 13.39 0.23 49.02 32.03 99.03 0.23 386.7 – 390 0.08 12.3 0.28 0.65 0.28 0.06 0.28<br />
continued...
153<br />
TABLE 3.3<br />
Continued<br />
Sample Zone Pop. An FeOT P2O5 K2O TiO2 Na2O CaO MgO SiO2 Al2O3 Total Mg# Ti Rb Sr Y Ba La Ce Nd Sm Eu<br />
(mol%)<br />
XLD2 C A 70 0.57 0.14 0.05 0.07 3.26 13.83 0.20 50.28 32.45 100.84 0.21 375.3 – 398 0.13 14.1 0.35 0.72 0.31 0.06 0.26<br />
C C B 84 0.57 0.17 0.03 0.02 1.71 16.74 0.15 46.66 33.41 99.45 0.17 – – – – – – – – – –<br />
C I B 80 0.58 0.16 0.02 0.01 2.26 16.01 0.19 47.42 32.86 99.51 0.2 – – – – – – – – – –<br />
C I B 82 0.51 0.16 0.02 0.01 1.96 16.62 0.18 46.69 33.60 99.75 0.22 – – – – – – – – – –<br />
C R B 74 0.69 0.15 0.05 0.07 2.91 15.01 0.21 49.40 31.69 100.17 0.19 – – – – – – – – – –<br />
B2 C B 85 0.57 0.18 0.01 0.04 1.75 17.45 0.14 45.96 33.63 99.73 0.15 – – – – – – – – – –<br />
B2 I B 84 0.55 0.15 0.02 0.00 1.76 17.14 0.19 46.13 33.80 99.72 0.21 – – – – – – – – – –<br />
B2 R B 75 0.80 0.12 0.04 0.05 2.82 15.36 0.21 48.76 32.36 100.53 0.17 – – – – – – – – – –<br />
SB1 C A 72 0.61 0.12 0.04 0.06 3.13 14.84 0.22 49.89 31.36 100.28 0.22 – – – – – – – – – –<br />
SB1 I A 77 0.80 0.12 0.01 0.03 2.57 15.48 0.32 48.75 32.61 100.70 0.24 – – – – – – – – – –<br />
SB1 R A 62 0.86 0.13 0.05 0.06 4.37 13.10 0.28 52.61 29.30 100.76 0.2 – – – – – – – – – –<br />
A2 C B 84 0.55 0.15 0.02 0.03 1.74 17.00 0.17 46.54 32.99 99.19 0.2 – – – – – – – – – –<br />
A2 C B 84 0.56 0.15 0.03 0.00 1.82 16.93 0.18 46.70 32.95 99.32 0.2 – – – – – – – – – –<br />
continued...
154<br />
TABLE 3.3<br />
Continued<br />
Sample Zone Pop. An FeOT P2O5 K2O TiO2 Na2O CaO MgO SiO2 Al2O3 Total Mg# Ti Rb Sr Y Ba La Ce Nd Sm Eu<br />
(mol%)<br />
A2 I B 84 0.59 0.21 0.00 0.03 1.86 17.27 0.17 46.43 33.40 99.97 0.19 – – – – – – – – – –<br />
A2 R B 72 0.72 0.13 0.04 0.09 3.11 14.85 0.22 49.56 31.21 99.94 0.2 – – – – – – – – – –<br />
A2 R B 63 0.95 0.10 0.06 0.12 4.19 12.86 0.34 52.68 28.96 100.26 0.22 – – – – – – – – – –<br />
Site 1203 Unit 31<br />
A C B 86 0.57 0.14 0.02 0.03 1.52 16.72 0.16 46.07 33.91 99.15 0.18 192.4 – 336 0.11 5.4 0.25 0.54 0.30 0.07 0.19<br />
A C B 85 0.61 0.13 0.01 0.05 1.60 16.54 0.15 46.23 33.68 99.01 0.16 191.8 – 330 0.13 5.4 0.24 0.50 0.25 0.08 0.18<br />
A C B 82 0.56 0.13 0.02 0.02 1.98 15.90 0.19 47.16 33.29 99.24 0.21 224.2 – 321 0.12 5.7 0.23 0.45 0.23 0.05 0.22<br />
A I B 83 0.55 0.16 0.03 0.03 1.87 16.33 0.18 46.87 33.86 99.87 0.2 – – – – – – – – – –<br />
A I B 79 0.56 0.14 0.03 0.05 2.28 15.48 0.22 48.01 33.06 99.84 0.23 – – – – – – – – – –<br />
A R B 86 0.58 0.12 0.03 0.03 1.50 16.77 0.15 46.51 33.61 99.39 0.17 197.2 – 328 0.16 7.0 0.22 0.53 0.29 0.04 0.20<br />
Bsm C B 85 0.56 0.15 0.02 – 1.63 17.35 0.17 46.30 34.43 100.61 0.19 – – – – – – – – – –<br />
Bsm R B 72 0.55 0.14 0.10 0.07 3.12 15.05 0.25 49.58 32.19 101.03 0.26 – – – – – – – – – –<br />
continued...
155<br />
TABLE 3.3<br />
Continued<br />
Sample Zone Pop. An FeOT P2O5 K2O TiO2 Na2O CaO MgO SiO2 Al2O3 Total Mg# Ti Rb Sr Y Ba La Ce Nd Sm Eu<br />
(mol%)<br />
C C B 81 0.64 0.16 0.04 0.04 2.07 16.14 0.18 48.01 33.21 100.48 0.18 – – – – – – – – – –<br />
C C B 81 0.60 0.17 0.03 0.03 2.11 15.92 0.18 47.97 33.55 100.56 0.19 241.0 – 341 0.10 6.4 0.29 0.57 0.21 0.05 0.22<br />
C C B 82 0.63 0.18 0.03 0.04 1.99 16.23 0.17 47.38 33.81 100.47 0.17 – – – – – – – – – –<br />
C C B 82 0.63 0.10 0.03 0.04 1.92 15.89 0.17 47.63 34.18 100.63 0.17 244.0 – 334 0.12 5.9 0.25 0.44 0.21 0.06 0.19<br />
C I B 81 0.57 0.17 0.04 0.06 2.04 15.58 0.17 48.24 33.78 100.65 0.19 217.0 – 323 0.10 5.3 0.22 0.44 0.21 0.03 0.17<br />
C I B 80 0.57 0.15 0.02 0.02 2.08 15.50 0.19 47.46 33.81 99.80 0.21 221.8 – 318 0.09 5.4 0.23 0.41 0.24 0.04 0.17<br />
C I B 85 0.54 0.17 0.01 0.01 1.62 16.24 0.18 45.58 34.88 99.24 0.21 – – – – – – – – – –<br />
C I B 87 0.52 0.17 0.02 0.02 1.33 16.68 0.18 44.97 35.25 99.13 0.21 191.8 – 345 0.12 5.6 0.24 0.45 0.27 0.06 0.21<br />
C I B 84 0.59 0.16 0.03 0.04 1.78 16.76 0.19 47.32 33.83 100.69 0.2 225.4 – 357 0.14 6.3 0.28 0.56 0.28 0.05 0.20<br />
C R B 82 0.63 0.17 0.03 0.02 1.94 15.98 0.18 47.70 33.84 100.49 0.18 – – – – – – – – – –<br />
D C B 82 0.54 0.14 0.02 0.04 1.95 16.25 0.18 48.50 32.28 99.90 0.21 177.5 – 323 0.09 5.5 0.15 0.38 0.13 0.03 0.18<br />
D C B 81 0.59 0.15 0.02 – 2.05 15.93 0.18 48.76 33.06 100.74 0.19 168.5 – 324 0.09 5.4 0.20 0.47 0.19 0.02 0.21<br />
D C B 86 0.56 0.15 0.01 0.02 1.51 16.79 0.16 47.34 34.13 100.65 0.18 195.4 – 330 0.11 5.5 0.24 0.57 0.20 0.07 0.22<br />
continued...
156<br />
TABLE 3.3<br />
Continued<br />
Sample Zone Pop. An FeOT P2O5 K2O TiO2 Na2O CaO MgO SiO2 Al2O3 Total Mg# Ti Rb Sr Y Ba La Ce Nd Sm Eu<br />
(mol%)<br />
D I B 84 0.52 0.17 0.02 0.03 1.76 16.27 0.19 47.79 33.71 100.45 0.22 210.4 – 328 0.11 5.9 0.24 0.53 0.21 0.06 0.20<br />
D I B 83 0.55 0.15 0.02 0.04 1.83 16.09 0.18 48.18 33.65 100.70 0.2 216.4 – 325 0.10 5.9 0.22 0.47 0.25 0.04 0.22<br />
D R B 84 0.54 0.13 0.03 0.03 1.77 16.42 0.18 47.88 33.75 100.72 0.21 – – – – – – – – – –<br />
E C B 84 0.61 0.16 0.03 0.02 1.78 16.89 0.17 47.18 33.95 100.79 0.18 – – – – – – – – – –<br />
E I B 71 0.63 0.10 0.04 0.05 3.20 14.24 0.26 50.66 31.49 100.67 0.24 – – – – – – – – – –<br />
E I B 82 0.61 0.13 0.02 0.01 1.96 16.60 0.21 47.23 33.76 100.52 0.21 214.6 – 338 0.14 6.2 0.24 0.47 0.27 0.04 0.24<br />
E I B 84 0.64 0.15 0.02 0.03 1.78 16.47 0.20 45.90 34.12 99.32 0.2 253.6 – 336 0.10 8.4 0.26 0.48 0.22 0.08 0.22<br />
E R B 72 0.66 0.11 0.21 0.05 2.96 14.12 0.25 49.33 31.85 99.54 0.23 204.4 – 346 0.08 6.6 0.21 0.52 0.24 0.06 0.18<br />
G C B 80 0.58 0.17 0.02 0.02 2.22 16.51 0.23 46.63 34.09 100.46 0.23 223.6 – 351 0.12 6.5 0.25 0.51 0.25 0.04 0.22<br />
G I B 85 0.60 0.12 0.00 0.02 1.63 16.73 0.18 45.70 34.28 99.27 0.19 232.0 – 330 0.10 6.7 0.21 0.52 0.24 0.06 0.21<br />
I C B 83 0.63 0.15 0.03 0.03 1.89 16.43 0.20 46.82 33.79 99.97 0.2 229.6 – 327 0.13 6.6 0.25 0.51 0.25 0.03 0.20<br />
I I B 83 0.61 0.12 0.03 0.02 1.79 16.22 0.20 46.28 34.01 99.27 0.2 220.6 – 318 0.11 6.3 0.22 0.51 0.27 0.07 0.24<br />
I I B 82 0.59 0.15 0.03 0.02 1.86 15.82 0.19 46.62 33.24 98.53 0.2 – – – – – – – – – –<br />
continued...
157<br />
TABLE 3.3<br />
Continued<br />
Sample Zone Pop. An FeOT P2O5 K2O TiO2 Na2O CaO MgO SiO2 Al2O3 Total Mg# Ti Rb Sr Y Ba La Ce Nd Sm Eu<br />
(mol%)<br />
I R B 71 0.51 0.13 0.05 0.04 3.18 14.02 0.21 48.88 31.78 98.80 0.24 – – – – – – – – – –<br />
J C B 84 0.58 0.10 0.03 0.04 1.70 16.76 0.20 46.24 34.70 100.34 0.21 241.0 – 353 0.14 6.0 0.26 0.51 0.29 0.04 0.22<br />
SPL3 C A 70 0.73 0.11 0.05 0.05 3.29 14.15 0.26 49.56 31.11 99.31 0.22 – – – – – – – – – –<br />
SPL1 C A 69 0.79 0.12 0.05 0.04 3.42 13.64 0.27 50.53 31.81 100.66 0.21 – – – – – – – – – –<br />
SPL5 C A 67 0.77 0.12 0.06 0.09 3.62 13.34 0.23 49.96 31.01 99.20 0.19 – – – – – – – – – –<br />
SPL5 R A 70 0.76 0.11 0.07 0.05 3.25 13.69 0.21 50.47 30.55 99.17 0.17 – – – – – – – – – –<br />
SPL2 C A 71 0.72 0.12 0.05 0.09 3.17 14.14 0.23 49.13 31.68 99.32 0.2 – – – – – – – – – –<br />
SPL6 R A 70 0.83 0.13 0.08 0.06 3.33 14.44 0.28 50.30 31.38 100.83 0.21 548.6 – 337 0.22 9.7 0.32 0.55 0.18 0.04 0.30<br />
SPL7 C A 68 0.79 0.12 0.18 0.07 3.47 13.77 0.30 50.97 30.85 100.52 0.23 – – – – – – – – – –<br />
SPL7 R A 68 0.81 0.12 0.05 0.09 3.57 13.73 0.26 51.18 31.15 100.95 0.2 – – – – – – – – – –<br />
SPL8 C A 72 1.59 0.16 0.11 0.18 3.03 14.10 0.89 50.11 29.45 99.61 0.3 – – – – – – – – – –<br />
SPL9 C A 68 0.90 0.10 0.12 0.09 3.49 13.83 0.40 49.97 30.65 99.57 0.26 – – – – – – – – – –<br />
SPL9 R A 71 0.71 0.11 0.27 0.08 3.00 14.22 0.25 48.54 31.88 99.06 0.22 – – – – – – – – – –<br />
continued...
158<br />
TABLE 3.3<br />
Continued<br />
Sample Zone Pop. An FeOT P2O5 K2O TiO2 Na2O CaO MgO SiO2 Al2O3 Total Mg# Ti Rb Sr Y Ba La Ce Nd Sm Eu<br />
(mol%)<br />
SPL10 C A 67 1.02 0.14 0.10 0.13 3.73 13.70 0.41 50.56 30.11 99.91 0.24 – – – – – – – – – –<br />
Y1 C A 77 0.61 0.15 0.08 0.06 2.37 14.71 0.23 50.30 32.27 100.78 0.23 – – – – – – – – – –<br />
Y2B C A 74 0.76 0.14 0.20 0.06 2.54 13.92 0.29 50.43 30.73 99.07 0.23 – – – – – – – – – –<br />
Y3 C A 73 0.80 0.16 0.05 0.06 2.88 14.47 0.28 50.80 31.35 100.86 0.21 – – – – – – – – – –<br />
Y4A C A 74 0.90 0.14 0.06 0.07 2.59 13.34 0.34 51.92 29.82 99.18 0.23 – – – – – – – – – –<br />
Y4B C A 74 0.88 0.14 0.06 0.06 2.60 13.70 0.26 51.21 30.57 99.49 0.19 – – – – – – – – – –<br />
Y6C C A 72 0.81 0.16 0.09 0.08 2.87 13.67 0.32 51.85 30.73 100.59 0.24 – – – – – – – – – –<br />
Y6B C A 73 0.56 0.15 0.09 0.06 2.81 14.04 0.23 50.31 31.03 99.29 0.25 – – – – – – – – – –<br />
Y7A C A 73 0.77 0.16 0.06 0.06 2.88 14.20 0.57 50.61 31.35 100.65 0.36 – – – – – – – – – –<br />
Y5L C B 84 0.58 0.18 0.02 0.03 1.75 16.55 0.18 47.81 33.81 100.93 0.2 – – 336 – 6.5 – – – – –<br />
Y5L I B 80 0.60 0.16 0.03 0.04 2.18 15.74 0.21 48.63 32.64 100.23 0.22 – – 344 – 7.6 – – – – –<br />
Y5L I B 83 0.56 0.18 0.02 0.01 1.80 16.48 0.18 47.75 33.88 100.87 0.2 – – 327 – 6.7 – – – – –<br />
Y5L I B 84 0.55 0.17 0.02 0.04 1.65 16.35 0.19 47.87 33.25 100.10 0.21 – – 342 – 7.4 – – – – –<br />
continued...
159<br />
TABLE 3.3<br />
Continued<br />
Sample Zone Pop. An FeOT P2O5 K2O TiO2 Na2O CaO MgO SiO2 Al2O3 Total Mg# Ti Rb Sr Y Ba La Ce Nd Sm Eu<br />
(mol%)<br />
Y5L I B 81 0.57 0.17 0.03 0.02 2.03 15.39 0.21 49.10 32.60 100.13 0.22 – – – – – – – – – –<br />
Y5L I B 84 0.56 0.18 0.02 0.02 1.71 16.42 0.18 47.69 33.74 100.53 0.2 – – 317 – 6.0 – – – – –<br />
Y5L R B 71 0.70 0.13 0.06 0.06 2.92 12.89 0.28 53.49 29.88 100.41 0.24 – – – – – – – – – –<br />
Y10 C B 82 0.55 0.16 0.26 0.02 1.65 15.44 0.20 48.81 33.52 100.61 0.22 – – 324 – 6.3 – – – – –<br />
Y10 I B 82 0.56 0.16 0.02 0.01 1.94 15.89 0.18 48.22 33.54 100.54 0.2 – – 324 – 6.3 – – – – –<br />
Y10 I B 83 0.57 0.18 0.02 0.02 1.77 16.16 0.19 47.84 33.99 100.72 0.2 – – 331 – 6.6 – – – – –<br />
Y10 I B 82 0.55 0.19 0.02 0.03 1.86 15.98 0.19 47.97 33.68 100.48 0.21 – – 329 – 6.9 – – – – –<br />
Y10 R B 73 0.61 0.17 0.08 0.06 2.73 13.78 0.23 50.35 31.25 99.25 0.23 – – – – – – – – – –<br />
Y11 C B 84 0.54 0.18 0.02 0.03 1.74 16.20 0.19 47.74 33.62 100.25 0.21 – – 307 – 5.6 – – – – –<br />
Y11 C B 84 0.52 0.18 0.02 0.03 1.65 16.23 0.18 47.54 33.60 99.95 0.21 – – 327 – 6.0 – – – – –<br />
Y11 I B 84 0.53 0.20 0.02 0.03 1.67 16.15 0.19 47.23 33.63 99.64 0.21 – – 310 – 6.1 – – – – –<br />
Y11 I B 83 0.57 0.19 0.03 0.03 1.80 15.79 0.19 47.74 32.94 99.27 0.2 – – – – – – – – – –<br />
continued...
160<br />
TABLE 3.3<br />
Continued<br />
Sample Zone Pop. An FeOT P2O5 K2O TiO2 Na2O CaO MgO SiO2 Al2O3 Total Mg# Ti Rb Sr Y Ba La Ce Nd Sm Eu<br />
(mol%)<br />
Site 884 Unit 8<br />
9R2A C B 86 0.50 – 0.01 – 1.54 17.7 0.2 46.1 34.2 100.25 0.24 153.2 0.07 201 0.16 2.9 0.12 0.27 0.21 0.13 0.17<br />
9R2A R B 82 0.51 – 0.02 – 2 16.9 0.2 48 33.2 100.83 0.23 125.3 0.09 207 0.21 2.8 0.09 0.29 0.23 0.16 0.16<br />
9R3B C B 85 0.52 – 0.01 – 1.61 17.2 0.18 46.2 34.9 100.62 0.21 191.8 0.12 207 0.11 3.5 0.14 0.26 0.14 0.15 0.17<br />
9R3B R B 84 0.53 – 0.01 – 1.8 16.8 0.21 47.2 33.8 100.35 0.24 124.1 0.10 195 0.11 2.5 0.13 0.22 0.20 0.18 0.17<br />
1 Interm. = Intermediate area between core and rim of largest discernible plagioclase crystal in each xenolith<br />
2 Fe reported as total FeO<br />
3 Major elements in wt.% and trace elements in ppm
161<br />
TABLE 3.4<br />
PLAGIOCLASE TRACE ELEMENT PARTITION COEFFICIENTS <strong>AND</strong><br />
CALCULATED PARENT LIQUID COMPOSITIONS<br />
Sample Zone Pop. An DSr DBa DLa DCe DNd DSm DY Sr Ba La Ce Nd Sm Y<br />
(mol%)<br />
4<br />
Site 1203 Unit 3<br />
A C B 80 1.46 0.19 0.1 0.08 0.06 0.03 0.01 268.9 53.4 2.84 9.01 5.94 1.5 15.9<br />
A I B 74 1.61 0.23 0.1 0.09 0.06 0.03 0.01 235.3 44.5 2.79 8.97 4.66 2.48 16.5<br />
A I B 75 1.58 0.22 0.1 0.09 0.06 0.03 0.01 234 44 2.81 8.7 5.27 2.54 16.1<br />
A I B 80 1.45 0.19 0.1 0.08 0.06 0.03 0.01 268.8 52.4 2.93 8.46 5.35 1.32 11.4<br />
A I B 80 1.47 0.19 0.1 0.08 0.06 0.03 0.01 269.2 54 3.19 8.5 4.61 2.33 15<br />
A I B 80 1.46 0.19 0.1 0.08 0.06 0.03 0.01 274.6 55.3 3.16 9.04 5.92 2.4 16.6<br />
A I B 79 1.48 0.2 0.1 0.08 0.06 0.03 0.01 248.5 48.3 2.68 8.34 4.74 2 12.2<br />
A I B 78 1.49 0.2 0.1 0.09 0.06 0.03 0.01 241 47.1 2.81 7.96 4.51 0.73 12.1<br />
B C B 79 1.49 0.2 0.1 0.09 0.06 0.03 0.01 238.8 46.6 2.79 7.42 4.42 2.51 11.8<br />
B I B 80 1.46 0.19 0.1 0.08 0.06 0.03 0.01 248.5 49.4 2.7 8.24 4.83 1.54 13.3<br />
B I B 80 1.47 0.19 0.1 0.08 0.06 0.03 0.01 244.3 48.3 2.69 8.45 5.11 1.57 12.2<br />
continued...
162<br />
TABLE 3.4<br />
Continued<br />
Sample Zone Pop. An DSr DBa DLa DCe DNd DSm DY Sr Ba La Ce Nd Sm Y<br />
(mol%)<br />
B I B 78 1.51 0.21 0.1 0.09 0.06 0.03 0.01 226.7 44.6 2.68 7.84 4.07 1.71 13.7<br />
C C B 81 1.44 0.18 0.1 0.08 0.06 0.04 0.01 254.7 49.5 2.93 8.24 6.26 1.24 13<br />
C C B 80 1.47 0.19 0.1 0.08 0.06 0.03 0.01 247.2 49.8 2.92 8.08 4.43 1.6 11.3<br />
C I B 79 1.47 0.19 0.1 0.08 0.06 0.03 0.01 245.5 48.3 2.91 7.87 4.13 1.53 12<br />
C I B 77 1.52 0.21 0.1 0.09 0.06 0.03 0.01 236.9 45.6 2.87 8.33 4.43 2.2 14.7<br />
C I B 71 1.69 0.26 0.1 0.09 0.05 0.03 0.01 198.3 37.6 2.33 7.25 4.33 1.97 9.9<br />
C I B 78 1.52 0.21 0.1 0.09 0.06 0.03 0.01 245.7 51.7 3.06 7.48 5.86 1.68 12.2<br />
C I B 77 1.54 0.21 0.1 0.09 0.06 0.03 0.01 228.8 45.7 2.52 8.26 4.48 1.43 8.8<br />
C I B 78 1.5 0.2 0.1 0.09 0.06 0.03 0.01 235.5 46 3.21 8.01 4.78 1.81 15.8<br />
C R B 69 1.74 0.28 0.1 0.09 0.05 0.03 0.01 191.9 37.1 2.39 7.85 4.48 1.88 12.6<br />
D-L C B 80 1.47 0.19 0.1 0.08 0.06 0.03 0.01 254.5 51.2 3.04 7.92 5.19 1.25 13.6<br />
D-L I B 79 1.48 0.2 0.1 0.08 0.06 0.03 0.01 250.7 49 2.89 8.86 5.75 1.83 11<br />
D-L I B 78 1.5 0.2 0.1 0.09 0.06 0.03 0.01 243.4 48.5 2.78 8.4 5.16 1.91 14.8<br />
continued...
163<br />
TABLE 3.4<br />
Continued<br />
Sample Zone Pop. An DSr DBa DLa DCe DNd DSm DY Sr Ba La Ce Nd Sm Y<br />
(mol%)<br />
D-L I B 79 1.49 0.2 0.1 0.09 0.06 0.03 0.01 247.4 49.6 3.12 8.61 6.31 1.87 10.3<br />
D-S1 C A 76 1.57 0.22 0.1 0.09 0.06 0.03 0.01 234.1 47.8 2.82 7.97 4.22 3.54 6.8<br />
D-S1 I A 74 1.61 0.23 0.1 0.09 0.06 0.03 0.01 221.2 42.7 3.83 6.83 6.55 4.66 5.1<br />
D-S1 I A 75 1.58 0.23 0.1 0.09 0.06 0.03 0.01 236.2 47.1 2.82 7.37 4 3.91 12.3<br />
D-S1 I A 79 1.49 0.2 0.1 0.09 0.06 0.03 0.01 247.5 48.6 2.64 7.78 6.06 2.49 12.8<br />
D-S1 R A 68 1.75 0.28 0.1 0.09 0.05 0.03 0.01 212 46.8 3.22 10.08 6.61 2.51 8.3<br />
D-S1 R A 66 1.83 0.31 0.1 0.09 0.05 0.03 0.01 198.6 41.3 3.26 7.23 4.51 2.54 15.3<br />
D-S2 C A 78 1.5 0.2 0.1 0.09 0.06 0.03 0.01 241.5 49.3 2.18 8.76 4.66 2.2 16.2<br />
D-S2 I A 73 1.64 0.24 0.1 0.09 0.06 0.03 0.01 222.6 39.8 2.9 7.92 1.59 3.92 4.3<br />
D-S2 I A 78 1.52 0.21 0.1 0.09 0.06 0.03 0.01 248.4 48.8 2.58 8.2 4.09 2.63 11.3<br />
D-S2 I A 79 1.49 0.2 0.1 0.09 0.06 0.03 0.01 244.2 47.8 2.51 9.54 4.99 3.41 9.7<br />
D-S2 R A 62 1.94 0.35 0.11 0.09 0.05 0.03 0.01 199.3 65.2 3.05 9.64 5.44 2.9 13.1<br />
E-1 I A 80 1.46 0.19 0.1 0.08 0.06 0.03 0.01 251.6 49.7 3.23 8.42 5.62 1.12 12.1<br />
continued...
164<br />
TABLE 3.4<br />
Continued<br />
Sample Zone Pop. An DSr DBa DLa DCe DNd DSm DY Sr Ba La Ce Nd Sm Y<br />
(mol%)<br />
E-1 I A 80 1.46 0.19 0.1 0.08 0.06 0.03 0.01 245.7 48.7 2.48 8.06 5.03 1.78 10<br />
E-1 I A 81 1.44 0.19 0.1 0.08 0.06 0.04 0.01 248.6 51.1 2.97 8.46 3.94 1.54 11.6<br />
E-1 I A 80 1.45 0.19 0.1 0.08 0.06 0.03 0.01 262 51.9 2.8 8.51 5.68 1.78 12.5<br />
F C A 80 1.45 0.19 0.1 0.08 0.06 0.03 0.01 246.3 46.3 3.13 8.1 4.92 1.26 10.8<br />
F I A 81 1.44 0.19 0.1 0.08 0.06 0.04 0.01 254.2 47.8 3.51 7.82 4.37 1.51 11.6<br />
F I A 73 1.64 0.25 0.1 0.09 0.06 0.03 0.01 208 39.3 2.97 6.67 5.71 1.54 14.4<br />
F I A 80 1.45 0.19 0.1 0.08 0.06 0.03 0.01 250.3 46.8 3.23 8.03 5.56 2.08 14<br />
F I A 78 1.5 0.2 0.1 0.09 0.06 0.03 0.01 236.3 44.3 2.97 7.73 5.48 2.14 12.8<br />
F I A 79 1.49 0.2 0.1 0.09 0.06 0.03 0.01 245.8 49.1 2.67 8.37 5.48 1.39 15.8<br />
F R A 64 1.89 0.33 0.1 0.09 0.05 0.03 0.01 226.7 79.5 4.09 11.78 6.17 1.93 17.1<br />
H I A 77 1.54 0.21 0.1 0.09 0.06 0.03 0.01 235.5 46.5 2.82 8.14 5.12 2.15 10.3<br />
H I A 78 1.5 0.2 0.1 0.09 0.06 0.03 0.01 240.4 46.2 2.79 8.6 4.91 1.71 18.7<br />
H I A 81 1.44 0.19 0.1 0.08 0.06 0.04 0.01 256.2 53.2 2.53 7.78 4.58 2.14 13.2<br />
continued...
165<br />
TABLE 3.4<br />
Continued<br />
Sample Zone Pop. An DSr DBa DLa DCe DNd DSm DY Sr Ba La Ce Nd Sm Y<br />
(mol%)<br />
H I A 80 1.46 0.19 0.1 0.08 0.06 0.03 0.01 249.7 48 2.99 8 5.01 1.16 15<br />
J C B 78 1.51 0.21 0.1 0.09 0.06 0.03 0.01 233.4 41.8 3.09 7.35 4.52 1.04 12.6<br />
J I B 75 1.59 0.23 0.1 0.09 0.06 0.03 0.01 217.3 37.3 3.2 7.32 4.65 2.96 12.3<br />
J I B 82 1.42 0.18 0.1 0.08 0.06 0.04 0.01 247.8 43.1 2.99 7.89 4.87 1.87 13.3<br />
J I B 78 1.5 0.2 0.1 0.09 0.06 0.03 0.01 234.5 43.9 2.85 6.92 4.78 1.41 12.6<br />
J I B 77 1.54 0.21 0.1 0.09 0.06 0.03 0.01 221.1 41.5 2.64 7.81 4.87 2.12 14.1<br />
PL-D C A 62 1.93 0.35 0.1 0.09 0.05 0.03 0.01 197 50.5 2.95 8.72 5.21 2.98 17.5<br />
PL-G C A 64 1.89 0.33 0.1 0.09 0.05 0.03 0.01 187.3 44.7 4.2 8.52 5.64 3.17 11.3<br />
PL-G R A 66 1.81 0.3 0.1 0.09 0.05 0.03 0.01 194.5 42.1 2.62 7.93 5.53 2.43 8<br />
PL-F I B 80 1.45 0.19 0.1 0.08 0.06 0.03 0.01 245.3 46.2 2.48 7.87 4.46 3.52 15<br />
PL-H C A 63 1.92 0.34 0.1 0.09 0.05 0.03 0.01 211.4 65 3.89 10.76 6.16 3.08 10.2<br />
Site 1203 Unit 14<br />
continued...
166<br />
TABLE 3.4<br />
Continued<br />
Sample Zone Pop. An DSr DBa DLa DCe DNd DSm DY Sr Ba La Ce Nd Sm Y<br />
(mol%)<br />
A I B 87 1.29 0.15 0.1 0.08 0.06 0.04 0.01 304.4 49.3 3.32 8.25 5.91 1.75 19.6<br />
A I B 83 1.39 0.17 0.1 0.08 0.06 0.04 0.01 290.5 45.9 3.27 6.98 5.07 2.51 14.1<br />
A I B 86 1.31 0.15 0.1 0.08 0.06 0.04 0.01 295.6 47.2 3.34 8.2 5.83 1.82 17<br />
A I B 83 1.38 0.17 0.1 0.09 0.06 0.03 0.01 274.8 42.2 2.8 7.52 5.19 1.48 12.9<br />
A I B 81 1.43 0.18 0.1 0.08 0.06 0.04 0.01 262.8 39.1 3.21 6.59 4.59 2.09 12.7<br />
A I B 82 1.42 0.18 0.1 0.08 0.06 0.04 0.01 265.7 41.6 2.68 7.58 5.51 2.62 10.7<br />
A R B 73 1.64 0.24 0.1 0.09 0.06 0.03 0.01 203.3 27 2.59 6.15 4.54 1.54 11.3<br />
B C B 81 1.44 0.19 0.1 0.08 0.06 0.04 0.01 260.5 34.2 2.51 5.07 3.29 1.45 8.7<br />
B I B 82 1.41 0.18 0.1 0.08 0.06 0.04 0.01 267.1 36.5 2.77 6.23 4.41 2.75 13.6<br />
B I B 82 1.41 0.18 0.1 0.08 0.06 0.04 0.01 284.6 38.6 3.08 6.28 5.61 1.13 16.2<br />
B I B 81 1.43 0.18 0.1 0.08 0.06 0.03 0.01 276.9 39.7 2.97 6.59 4.76 1.04 15<br />
B I B 83 1.39 0.17 0.1 0.08 0.06 0.04 0.01 285.9 42.3 3.78 8.36 5.9 2.79 18.8<br />
B I B 83 1.38 0.17 0.09 0.08 0.06 0.04 0.01 301.9 49.2 3.56 7.54 5.89 0.76 19.4<br />
continued...
167<br />
TABLE 3.4<br />
Continued<br />
Sample Zone Pop. An DSr DBa DLa DCe DNd DSm DY Sr Ba La Ce Nd Sm Y<br />
(mol%)<br />
C1 C B 83 1.4 0.17 0.1 0.08 0.06 0.04 0.01 255.5 36.7 3.08 6.8 4.51 2.08 12.7<br />
C1 I B 83 1.38 0.17 0.1 0.08 0.06 0.04 0.01 260.8 36.6 2.72 5.75 4.7 1.03 15.5<br />
C1 I B 83 1.39 0.17 0.1 0.08 0.06 0.04 0.01 261 35.8 2.91 6.85 5.01 1.47 16.7<br />
C1 I B 81 1.42 0.18 0.1 0.08 0.06 0.04 0.01 263.2 39.6 3.33 6.54 5.07 1.62 16.9<br />
D1 C B 83 1.39 0.17 0.1 0.08 0.06 0.04 0.01 274.2 35.6 2.63 5.78 4.56 1.68 13.6<br />
D1 I B 81 1.43 0.18 0.1 0.08 0.06 0.04 0.01 261 34.1 2.44 5.71 4.54 1.85 14.2<br />
D1 I B 83 1.38 0.17 0.1 0.08 0.06 0.04 0.01 281.1 38.5 2.54 5.8 4.62 2.15 12.5<br />
D1 I B 83 1.38 0.17 0.1 0.09 0.05 0.03 0.01 276.4 40.1 3.24 6.34 5.07 1.09 17.3<br />
E C B 82 1.41 0.18 0.1 0.08 0.06 0.04 0.01 277.4 41.7 2.66 6.27 4.98 1.56 16.7<br />
E I B 72 1.65 0.25 0.1 0.09 0.05 0.03 0.01 208.1 26.9 3.17 6.45 5.37 0.76 12.1<br />
PG2 CTR A 72 1.67 0.25 0.1 0.08 0.06 0.04 0.01 218.4 40.1 2.65 6.22 7.89 2.97 21.6<br />
PG9 C A 70 1.71 0.27 0.1 0.09 0.05 0.03 0.01 220.2 44.7 2.64 6.99 6.4 4.37 11.1<br />
XLE1 C A 69 1.73 0.28 0.1 0.09 0.05 0.03 0.01 200.6 33.4 2.25 6.48 5.86 1.73 9.8<br />
continued...
168<br />
TABLE 3.4<br />
Continued<br />
Sample Zone Pop. An DSr DBa DLa DCe DNd DSm DY Sr Ba La Ce Nd Sm Y<br />
(mol%)<br />
XLE2 C A 68 1.75 0.28 0.1 0.09 0.05 0.03 0.01 211.4 30 3.1 5.69 2.82 3.71 20.1<br />
XLE3 C A 68 1.77 0.29 0.1 0.09 0.05 0.03 0.01 204.9 35.6 2.87 6.73 6.14 3.88 18.2<br />
XLE4 C A 70 1.7 0.26 0.1 0.09 0.05 0.03 0.01 226 40.8 2.95 9.99 2.93 3.1 17.9<br />
XLB1 C A 70 1.72 0.27 0.1 0.09 0.05 0.03 0.01 236.3 59.7 3.44 8.46 6.06 2.41 11.5<br />
XLB1 C A 67 1.81 0.3 0.1 0.09 0.05 0.03 0.01 211.5 49.6 3.11 8.04 6.13 1.64 9.3<br />
XLB2 C A 68 1.76 0.29 0.1 0.09 0.05 0.03 0.01 211.6 36.5 3.23 7.24 5.18 1.72 11.8<br />
XLB2 C A 69 1.75 0.28 0.1 0.09 0.05 0.03 0.01 210.5 35.3 2.82 7.08 5.48 0.96 12.8<br />
XLB3 C A 65 1.84 0.31 0.1 0.09 0.05 0.03 0.01 183.4 31 1.94 6.96 3.73 5.29 10.4<br />
XLB3 C A 64 1.87 0.33 0.1 0.09 0.05 0.03 0.01 201.6 38.7 2.73 6.79 4.09 1.06 9.7<br />
XLB4 C A 66 1.81 0.3 0.1 0.09 0.05 0.03 0.01 176.5 32.3 3.04 6.65 1.01 3.71 19.3<br />
XLC1 C A 69 1.74 0.28 0.1 0.09 0.05 0.03 0.01 218 41.9 2.98 8.06 5.81 1.44 9.9<br />
XLC1 C A 68 1.78 0.29 0.1 0.09 0.05 0.03 0.01 210.1 38.7 2.48 8.28 4.36 3.67 19.9<br />
XLC2 C A 66 1.82 0.31 0.1 0.09 0.05 0.03 0.01 195.8 36.9 1.93 8.42 4.82 4.39 17.7<br />
continued...
169<br />
TABLE 3.4<br />
Continued<br />
Sample Zone Pop. An DSr DBa DLa DCe DNd DSm DY Sr Ba La Ce Nd Sm Y<br />
(mol%)<br />
XLC2 C A 67 1.8 0.3 0.1 0.09 0.05 0.03 0.01 205.9 36 2.71 6.89 5.65 1.65 9.1<br />
XLC3 C A 71 1.7 0.26 0.1 0.09 0.05 0.03 0.01 220.6 37.5 2.58 6.98 3.95 1.05 10.2<br />
XLC4 C A 67 1.8 0.3 0.1 0.09 0.05 0.03 0.01 186.4 32 2.7 6.64 4.47 6.23 17.4<br />
XLC5 C A 66 1.82 0.3 0.1 0.09 0.05 0.03 0.01 185.9 39.7 2.73 7.79 3.48 2.47 14.7<br />
XLD1 C A 68 1.76 0.29 0.1 0.09 0.05 0.03 0.01 226.4 48.4 3.3 7.41 5.73 1.68 12.6<br />
XLD1 C A 68 1.78 0.29 0.1 0.09 0.05 0.03 0.01 219.4 42.4 2.72 7.47 5.1 1.98 9.1<br />
XLD2 C A 70 1.72 0.27 0.1 0.09 0.05 0.03 0.01 232 52.4 3.39 8.39 5.71 1.75 14.8<br />
Site 1203 Unit 31<br />
A C B 86 1.32 0.15 0.13 0.11 0.07 0.05 0.01 254.1 34.9 1.95 4.96 4 1.42 9.5<br />
A C B 85 1.34 0.16 0.13 0.11 0.07 0.05 0.01 246.5 34.3 1.86 4.54 3.32 1.74 11.3<br />
A C B 82 1.42 0.18 0.13 0.11 0.07 0.05 0.01 225.9 31.6 1.81 4.08 3.1 1.13 11<br />
A R B 86 1.32 0.15 0.13 0.11 0.07 0.05 0.01 248.7 45.3 1.79 4.82 3.88 0.92 14.4<br />
continued...
170<br />
TABLE 3.4<br />
Continued<br />
Sample Zone Pop. An DSr DBa DLa DCe DNd DSm DY Sr Ba La Ce Nd Sm Y<br />
(mol%)<br />
C C B 81 1.44 0.19 0.13 0.11 0.07 0.05 0.01 236 34.4 2.24 5.15 2.82 1.16 9.1<br />
C C B 82 1.41 0.18 0.13 0.11 0.07 0.05 0.01 236.6 33.2 1.94 3.96 2.84 1.2 10.5<br />
C I B 81 1.44 0.19 0.13 0.11 0.07 0.05 0.01 224 28.6 1.7 3.97 2.77 0.64 8.8<br />
C I B 80 1.45 0.19 0.13 0.11 0.07 0.05 0.01 219.5 28.7 1.77 3.69 3.24 0.86 8<br />
C I B 87 1.29 0.15 0.12 0.11 0.07 0.05 0.01 267.8 37.9 1.94 4.12 3.66 1.27 11.2<br />
C I B 84 1.37 0.17 0.13 0.11 0.07 0.05 0.01 260.8 38 2.18 5.03 3.78 1.05 12.9<br />
D C B 82 1.41 0.18 0.13 0.11 0.07 0.05 0.01 229.3 31 1.15 3.44 1.8 0.6 8.4<br />
D C B 81 1.43 0.18 0.13 0.11 0.07 0.05 0.01 226 29.4 1.52 4.2 2.52 0.5 7.7<br />
D C B 86 1.32 0.15 0.13 0.11 0.07 0.05 0.01 250.6 36 1.91 5.16 2.73 1.46 10<br />
D I B 84 1.37 0.17 0.13 0.11 0.07 0.05 0.01 238.8 35.1 1.86 4.8 2.78 1.21 10.2<br />
D I B 83 1.39 0.17 0.13 0.11 0.07 0.05 0.01 233.8 34.2 1.68 4.25 3.32 0.89 8.6<br />
E I B 82 1.4 0.17 0.13 0.11 0.07 0.05 0.01 241.1 35.5 1.84 4.22 3.66 0.96 12.6<br />
E I B 84 1.37 0.17 0.13 0.11 0.07 0.05 0.01 244.6 49.8 2.01 4.37 2.9 1.76 9.2<br />
continued...
171<br />
TABLE 3.4<br />
Continued<br />
Sample Zone Pop. An DSr DBa DLa DCe DNd DSm DY Sr Ba La Ce Nd Sm Y<br />
(mol%)<br />
E R B 72 1.67 0.25 0.13 0.11 0.07 0.04 0.01 207.1 25.8 1.56 4.54 3.31 1.3 7.2<br />
G C B 80 1.45 0.19 0.13 0.11 0.07 0.05 0.01 242.2 34.7 1.9 4.57 3.42 0.85 10.4<br />
G I B 85 1.34 0.16 0.13 0.11 0.07 0.05 0.01 246.3 42.2 1.7 4.71 3.17 1.32 8.8<br />
I C B 83 1.4 0.17 0.13 0.11 0.07 0.05 0.01 234.3 37.8 1.93 4.56 3.41 0.62 11.7<br />
I I B 83 1.38 0.17 0.13 0.11 0.07 0.05 0.01 230.2 37.1 1.76 4.58 3.67 1.4 10.2<br />
J C B 84 1.35 0.16 0.13 0.11 0.07 0.05 0.01 260.7 36.9 2.01 4.6 3.87 0.82 12.3<br />
SPL6 R A 70 1.71 0.27 0.13 0.11 0.07 0.04 0.01 197.5 36.4 2.39 4.88 2.5 1.03 18.3<br />
SPL6 I B 83 1.37 0.17 – – – – – 245.9 38.9 – – – – –<br />
SPL6 I B 84 1.46 0.19 – – – – – 235.4 39.6 – – – – –<br />
SPL6 I B 81 1.38 0.17 – – – – – 237.6 39.8 – – – – –<br />
SPL6 I B 84 1.35 0.16 – – – – – 252.9 45.6 – – – – –<br />
SPL6 R B 71 1.44 0.19 – – – – – – – – – – – –<br />
Y10 C B 82 1.36 0.16 – – – – – 232.7 36.5 – – – – –<br />
continued...
172<br />
TABLE 3.4<br />
Continued<br />
Sample Zone Pop. An DSr DBa DLa DCe DNd DSm DY Sr Ba La Ce Nd Sm Y<br />
(mol%)<br />
Y10 I B 83 1.4 0.17 – – – – – 231.5 36.3 – – – – –<br />
Y10 I B 82 1.42 0.18 – – – – – 229 35.5 – – – – –<br />
Y10 R B 73 1.38 0.17 – – – – – 240.4 39.2 – – – – –<br />
Y11 C B 84 1.40 0.17 – – – – – 235.2 39.7 – – – – –<br />
Y11 I B 84 1.37 0.17 – – – – – 223.9 33.7 – – – – –<br />
Y11 I B 83 1.35 0.16 – – – – – 241.5 36.8 – – – – –<br />
Y11 I B 83 1.36 0.16 – – – – – 228.1 37 – – – – –<br />
4 Major elements in wt.% and trace elements in ppm
CHAPTER 4<br />
CRUSTAL CONTAMINATION <strong>OF</strong> BASALTIC MAGMAS REVEALED<br />
THROUGH <strong>MICROANALYSIS</strong> <strong>OF</strong> MAJOR, MINOR, <strong>AND</strong> TRACE<br />
ELEMENTS <strong>AND</strong> Sr ISOTOPES IN PLAGIOCLASE: IMPLICATIONS FOR<br />
ELAN BANK MAGMAS, KERGUELEN PLATEAU, INDIAN OCEAN<br />
4.1 Introduction<br />
Large Igneous Provinces (LIPs) are voluminous emplacements of basaltic magma<br />
that occur over geologically short spans of time [32, 42]. The submarine Kergue-<br />
len Plateau (KP) and Broken Ridge constitute the second largest oceanic LIP on<br />
Earth and rise up to 4 km above the surrounding Indian Ocean basin (Fig. 4.1).<br />
Studies of LIPs such as the expansive KP are important for several reasons includ-<br />
ing: 1) LIPs sample portions of the mantle not tapped during normal mid-ocean<br />
ridge spreading and help us better understand the broader mantle, 2) during the<br />
Cretaceous LIP volcanism may have represented as much as 50% of the global<br />
volcanic output, whereas LIPs currently represent < 10% of the output possibly<br />
signifying large scale changes in mantle dynamics, 3) rapid formation of LIPs such<br />
as the KP may have had catastrophic effects on the environment [32, 33]. Oceanic<br />
LIPs such as the KP are among the least understood geologic features on the<br />
planet, which is due in part to the practical difficulties of sampling these largely<br />
submerged oceanic plateaus. Current sampling of the Cretaceous portion of the<br />
173
KP has been done via drilling at 11 drillsites during Ocean Drilling Program Legs<br />
119, 120, and 183.<br />
Prior to drilling during Leg 183 a number of workers suggested that continen-<br />
tal crust was involved during the petrogenesis some KP basalts (e.g., [51, 92]).<br />
Drilling at Site 1137 on Elan Bank confirmed hypotheses of continental crust<br />
involvement when clasts of garnet-biotite gneiss were recovered from a fluvial con-<br />
glomerate unit (Unit 6 in Fig. 4.2) [33, 74]. Nicolaysen et al. [111] and Frey<br />
et al. [49] suggested that during the break up of the Gondwana supercontinent<br />
fragments of old continental crust were stranded amongst the Indian Ocean litho-<br />
sphere including fragments within the KP crust.<br />
One of the scientific objectives of Leg 183 drilling was to constrain the post-<br />
melting evolution of Kerguelen magmas, of which crustal assimilation was clearly<br />
an important process. In this study I explore the timing and nature of crustal con-<br />
tamination of KP magmas by focusing on the compositional and isotopic record of<br />
assimilation contained within zoned plagioclase phenocrysts in two basalts from<br />
Leg 183 Site 1137 Units 4 and 10. Ingle et al. [75] placed the Unit 4 basalt in a<br />
relatively uncontaminated upper basalt group and and the Unit 10 basalt in a rel-<br />
atively contaminated lower basalt group. Examination of plagioclase phenocrysts<br />
from Units 4 and 10 provide snapshots of the magmatic processes that were oc-<br />
curring when both when crustal contamination was significant and when it was<br />
not. From this work I suggest that Unit 4 and 10 plagioclase phenocrysts origi-<br />
nated from the shallowest magma chambers of what was likely a complex system<br />
of interconnected dikes and sills. I contend that crustal assimilation was not an<br />
active process in these shallowest chambers but rather pre-dated plagioclase dom-<br />
inated partial crystallization. Crustal assimilation occurred deeper in the crust<br />
174
Figure 4.1. Map of the Indian Ocean showing the Kerguelen Plateau<br />
(KP) and other features attributed to the Kerguelen plume, and an<br />
inset free-air gravity map of Elan Bank and the location of ODP Site<br />
1137. NKP is Northern KP, CKP is the Central KP, and SKP is the<br />
Southern KP. Maps adapted from [33].<br />
175
and over time crustal wall-rocks became armored, which minimized progressive<br />
crustal assimilation.<br />
4.1.1 Geologic Background of the Kerguelen Plateau and Elan Bank<br />
The bulk of the 2 x 10 6 km 2 Kerguelen Plateau formed during the Cretaceous<br />
[31, 32, 42]. Formation of the KP has been ascribed to surfacing of the Kerguelen<br />
plume and is closely spaced in time with the break up of India and Australia at<br />
∼ 132 Ma [80]. Broken Ridge was separated from the KP during the Early Ter-<br />
tiary with the onset of spreading at the Southeast Indian Ridge [109] (Fig. 4.1).<br />
The Kerguelen Plateau has been divided into distinct sections, which include the<br />
Southern KP, Central KP, Northern KP, and Elan Bank [49] (Fig. 4.1). Heard and<br />
McDonald Islands represent the most recent volcanism ascribed to the Kerguelen<br />
plume, and the northerly trending Ninetyeast Ridge has been attributed to Ker-<br />
guelen plume tail volcanism (e.g., [125]). Elan Bank is a salient that extends from<br />
western edge of the KP and contains a number of seismic reflections consistent<br />
with the presence of continental crust [33] (Fig. 4.5). The presence of continental<br />
crust at Elan Bank was confirmed by drilling [33] (Fig. 4.5).<br />
4.2 Samples<br />
Unit 4 consists of a single ∼ 27 m thick variably vesicular subaerial plagioclase<br />
phyric inflated pahoehoe flow [33]. I selected a single sample from a portion of<br />
the Unit 4 flow that exhibited the least alteration and lowest vesicle content (183-<br />
1137A-32R-05W-22-27; Fig. 4.2). Unit 10 is at the bottom of the Site 1137 cored<br />
section. Unit 10 consists of the top of a subaerial massive plagioclase phyric basalt<br />
176
Figure 4.2. The cored section of igneous rocks from ODP Site 1137.<br />
The locations of each sample used in this study is shown as a boxed in<br />
X. Figure adapted from [33].<br />
177
flow [33]. I selected a single sample from the Unit 10 flow with minimal alteration<br />
(183-1137A-46R-01W-20-35; Fig. 4.2).<br />
4.3 Analytical Techniques<br />
4.3.1 Sample Preparation<br />
Basalt samples were prepared as polished thin sections using a microdiamond<br />
slurry and final grit size of 0.5 µm. Prior to analytical work the slides were rinsed<br />
in ethanol in an ultrasonic bath to remove remnants of the polishing compounds<br />
followed by three 30 minute rinses in ultrapure water in an ultrasonic bath. Sam-<br />
ples were carbon coated for EPMA work. After completion of EPMA work the<br />
carbon coats were removed with 3 µm and 1 µm diamond polishing clothes under<br />
ethanol followed by three 30 minutes rinses in ultrapure water in an ultrasonic<br />
bath. The surface of each slide was inspected under a reflected light optical mi-<br />
croscope to confirm that all vestiges of the carbon coat had been removed prior to<br />
LA-ICP-MS work. Slides were re-polished and re-cleaned after LA-ICP-MS and<br />
prior to Sr isotope microdrilling.<br />
4.3.2 Electron Probe Microanalysis (EPMA) and Scanning Electron Microscopy<br />
Backscatter electron images and major element analyses were performed us-<br />
ing a JEOL JXA-8600 Superprobe electron microprobe at the University of Notre<br />
Dame. Backscatter electron images were collected using a 1 µm beam, an acceler-<br />
ating voltage of 20 kV, and a probe current of 25-50 nA. Microprobe analyses were<br />
performed using a 10 µm defocused beam, accelerating voltage of 15 kV, a probe<br />
current of 20 nA, 15 second on-peak counting time, and two background measure-<br />
ments per peak. Sodium was measured first to minimize loss via volatilization.<br />
178
During core to rim line scans a point was measured every 6 µm using a 5 µm<br />
diameter beam. Microprobe data were corrected for matrix effects using a ZAF<br />
correction routine. Data points near Fe-rich phases such as melt inclusions and<br />
alteration-filled fractures were discarded.<br />
4.3.3 Laser Ablation Inductively Coupled Plasma Mass Spectrometry (LA-ICP-<br />
MS)<br />
Scandium, Ti V, Rb, Sr, Y, Ba, La, Ce, Nd, Sm, Eu, and Pb were measured in<br />
plagioclase crystals using a New Wave UP-213 UV laser ablation system interfaced<br />
with a ThermoFinnigan Element 2 ICP-MS operated in fast magnet scanning<br />
mode at the University of Notre Dame. I used a laser frequency of 5 Hz, pulse<br />
energy of 0.02-0.03 mJ pulse −1 , 30 µm diameter pits, and helium as the carrier<br />
gas (∼ 0.7 l min −1 ) mixed with argon (∼ 1.0 l min −1 ) before introduction to the<br />
plasma. Due to the transient nature of the laser ablation signal, analyses were<br />
conducted in peak jumping mode with one point quantified per mass. The LA-<br />
ICP-MS spots were coincident with previous EPMA analyses, and Ca measured by<br />
EPMA was used as an internal standard for each spot analysis. The trace element<br />
glass NIST 612 was used as a calibration standard for all laser ablation analyses.<br />
Although heterogeneity for certain elements has been documented in the widely<br />
used NIST 612 glass i.e., [44], Eggins et al. [44] considered it a reliable calibration<br />
standard for the elements examined in this study. The analytical protocols of<br />
Longerich et al. [88] were used for LA-ICP-MS data reduction.<br />
179
4.3.4 Major and Trace Element Data quality<br />
The quality of EPMA data were monitored by major element and cation totals.<br />
Data points where major element totals were greater than 101.5% or less than<br />
98.5% are not used in further discussion nor are points with cation totals greater<br />
or less than 20 ± 0.1 cations (based on 32 O). All laser ablation analyses were<br />
collected in time-resolved mode so that signal from inclusions and alteration-filled<br />
fractures could be easily identified. Results from laser ablation spots close to<br />
fractures or that penetrated into underlying fractures were discarded. The rate of<br />
laser ablation was tested using a 100 µm thick plagioclase wafer prior to sampling,<br />
which allowed optimization of operating conditions to yield desired sensitivity and<br />
sampling depth (< 30 µm).<br />
4.3.5 Microdrilling and Sr isotope microanalysis<br />
Microdrilling for Sr isotope microanalysis was performed using a Merchantek<br />
MicroMill at the University of Durham, UK after completion of EPMA and LA-<br />
ICP-MS work. We used a highly tapered tungsten carbide drill bit for all drilling,<br />
which provided < 50 µm diameter single drill pits. Microdrilling was performed by<br />
setting precision scans consisting of grids and lines of drill points, which allowed<br />
us to target zones of interest to maximize the amount of Sr recovered in order to<br />
ensure as accurate and precise 87 Sr/ 86 Sr measurements as possible (see Fig. 4.3).<br />
Prior to microdrilling, a square 4 cm x 4 cm piece of parafilm pre-cleaned in<br />
ultrapure water with a ∼ 2 cm center hole was adhered to the polished sample<br />
surface. A droplet of ultrapure water was then placed over the center hole and area<br />
to be drilled. The parafilm was used to minimize dispersion of the water droplet<br />
and to minimize sample loss. Microdrilling was then performed within the water<br />
180
droplet, which generated a slurry as sample material was removed. The slurry was<br />
removed using a micropipette and placed in a 3.5 mL Teflon beaker. The sample<br />
was then subjected to a hotplate digestion with concentrated HF and HNO3.<br />
Strontium was extracted using a scaled-down ion exchange column method. The<br />
samples were run Re filaments with a TaF activator and 87 Sr/ 86 Sr ratios were<br />
measured using a Finnigan Triton thermal ionization mass spectrometer (TIMS).<br />
Davidson et al. [39] and Tepley et al. [135] provide more thorough discussions<br />
about of the micro-Sr isotope method.<br />
4.3.6 Choosing Partition Coefficients (D)<br />
Blundy [9] noted that inversion of magma compositions from mineral data<br />
using appropriate trace element D values is a robust means of estimating parent<br />
magma compositions and suggested that trace element D values derived from<br />
microbeam techniques were more accurate than those derived from bulk crystal-<br />
matrix analyses. Blundy and Wood [10, 11] and Bindeman et al. [7] showed<br />
that the dominant factors controlling the trace element D vaues for plagioclase<br />
are An content and crystallization temperature. Bindeman et al. [7] applied this<br />
relationship to a variety of major and trace elements and produced values for the<br />
constants “a” and “b” in their Equation 2 (equation 4.1 below) for calculating<br />
plagioclase partition coefficients via the expression:<br />
RT ln(Di) = aXAn + b (4.1)<br />
where R is the gas constant, T is temperature (Kelvin), i is the element of interest,<br />
and XAn is the mole fraction of anorthite. Using equation 4.1, Ginibre et al.<br />
[59] noted that temperatures in the range of 850-1,000 ◦ C had miniscule effect on<br />
181
B)<br />
C)<br />
parafilm<br />
splash guard<br />
A)<br />
tapered<br />
tungsten<br />
carbide bit<br />
1 mm<br />
1 mm<br />
Figure 4.3. A) Drilling into a droplet of ultra-pure water. B) Unit 10<br />
crystal 10-1C-A core drill site. Individual drill spots are ∼ 50 µm in<br />
diameter and are arranged into finely controlled point and line scans.<br />
C) A drill zone in Unit 10 crystal 10-1D-A. See figure 4.9 for more<br />
details and results.<br />
182
calculated melt concentrations for Sr and Ba (within their analytical uncertainty).<br />
Likewise, Bindeman et al. [7] showed that variations of ∼150 ◦ C produce < 10%<br />
differences for particular partition coefficients, which were often within error of<br />
the respective D values.<br />
Blundy and Wood [11] presented an alternative model for quantitative predic-<br />
tion of D values based upon thermodynamic principles and lattice strain theory<br />
(i.e., [15]). Specifically, they noted the dominant roles of cation size, lattice site<br />
size, and elasticity of the lattice site related to cation substitution in minerals.<br />
The elastic response of a lattice site to cation substitution is measured by Young’s<br />
Modulus (E), and the value of E plag is dependent upon plagioclase An content<br />
and the charge of the substituent cation [11, 12]. Equation 4.2 (Equation 2 of<br />
Blundy and Wood [11]) is the basis of their predictive D model that I apply to<br />
plagioclase,<br />
Di = D z+<br />
o<br />
∗ exp<br />
−4πEplagNA<br />
<br />
ro<br />
2 (r2 o − r2 i ) + 1<br />
3 (r3 i − r3 o) <br />
RT<br />
(4.2)<br />
where Di of a trace element (i) is a function of the strain compensated partition<br />
coefficient for the divalent (D 2+<br />
0<br />
) or trivalent (D3+ 0 ) substituent cation, Young’s<br />
Modulus for the plagioclase M lattice site (E plag), NA (Avogadro’s Number), the<br />
radius of the plagioclase M site (ro), the radius of the substituent cation (ri),<br />
the gas constant (R), and crystallization temperature (T). For a more thorough<br />
discussion of this model see Blundy and Wood [11, 12].<br />
4.3.6.1 Partition coefficients for Elan Bank Plagioclase Crystals<br />
I used equation 4.2 and the parameterizations of Blundy and Wood [11, 12]<br />
to calculate D values for Rb, Sr, Y, Ba, La, Ce, Pr, Nd, and Sm, as partitioning<br />
183
of these elements are the better constrained through experimental studies (see<br />
Tables 4.5 and 4.5). Estimates of Sc DSc are unrealistically low (< 0.001) using the<br />
Blundy and Wood [11] method, which is most likely due to inadequate estimation<br />
of the strain-free partition coefficient. The partitioning behavior of Fe and Eu are<br />
strongly affected by oxygen fugacity f O2, and due to f O2 constraints I did not<br />
attempt to estimate DFe or DEu values. Magnesium is known to substitute in more<br />
than one plagioclase cation site, and based upon this complex partitioning I did<br />
not calculate DMg [7]. Blundy and Wood [11] noted that predictive approaches are<br />
inaccurate for Pb, which has a lone pair of electrons. I assumed a crystallization<br />
temperature of 1150 ◦ C to calculate D values. The validity of this assumption<br />
was examined using the MELTS program [2, 55] to determine the temperature<br />
at which plagioclase arrives on the liquidus during crystallization of a typical<br />
Elan Bank basalt sample. I input four upper group and lower group Site 1137<br />
whole-rock basalt compositions with 4.4 wt% MgO, 5.9 wt% MgO, 6.0 wt% MgO,<br />
and 7.3 wt% MgO reported by Shipboard Scientific Party [33] into the MELTS<br />
program. During equilibrium crystallization of the lowest MgO basalt, plagioclase<br />
appeared on the liquidus at 1080 ◦ C and at at 1180 ◦ C from the highest MgO<br />
sample. The use of 1080 ◦ C vs. 1180 ◦ C in D calculations yields < 10% differences<br />
in trace element concentrations of parent liquids, which is within the analytical<br />
error for my analyses. The effects of pressure on plagioclase D values are not<br />
well documented for most elements, and where they were documented for DSr by<br />
Vander Auwera et al. [137] they were negligible. I used a crystallization pressure<br />
of 0.001 kbar for D calculations. I assume the strain compensated (i.e., strain free)<br />
partition coefficient D 2+<br />
0 in plagioclase is best approximated by DCa (c.f., [12]),<br />
and to estimate DCa I used equation 4.1 and the “a” and “b” constants reported<br />
184
for Ca by Bindeman et al. [7]. I used equation 4.1 and the “a” and “b” constants<br />
reported for Na by Bindeman et al. [7] to estimate D 1+<br />
0 . Estimation of D 3+<br />
0 is less<br />
straightforward. I assumed D 3+<br />
0 to be ∼ 7.5% of D 2+<br />
0 , which was derived from<br />
experimental data reported in Blundy [9]. I used equation 4.1 and the “a” and<br />
“b” constants reported for Ti by Bindeman et al. [7] to estimate DTi.<br />
4.4 Results<br />
4.4.1 Petrography<br />
Unit 4 plagioclase phenocrysts are typically euhedral and occur as clusters of<br />
crystals but most prominently as individual crystals (Fig. 4.4a). Unit 10 plagio-<br />
clase phenocrysts are large relative to Unit 4 phenocrysts and occur most com-<br />
monly as clusters of euhedral to sub-rounded crystals (Fig. 4.4a). Plagioclase<br />
phenocrysts from both Units 4 and 10 exhibit distinct zonation in cross polar-<br />
ized light (e.g., Figs. 4.8, 4.9). The interiors of plagioclase phenocrysts frequently<br />
exhibit oscillatory type zoning (e.g., crystal 10-1D-A; Fig. 4.9), and most have<br />
obvious core and rim sections. Sections of zoned plagioclase crystals are divided<br />
into three types: 1) cores, 2) intermediate zones, and 3) rims. Dissolution sur-<br />
faces are abundant in crystals from both Units 4 and 10, and frequently enclose<br />
crystal core regions (e.g., Fig. 4.10). Glass and partially crystallized inclusions are<br />
present along some dissolution surfaces. It is important to note that the labeling<br />
of cores and intermediate zones may be purely artificial, as geometric distortions<br />
introduced during sectioning of basalt samples make it difficult to know when a<br />
true crystal core is being sampled [140].<br />
185
5 mm<br />
5 mm<br />
Figure 4.4. Cross polarized light petrographic thin section photographs<br />
of the A) the Unit 4 basalt (183-1137A-32R-05W-22-27) examined in<br />
this study, and B) the Unit 10 basalt (183-1137A-46R-01W-20-35)<br />
examined in this study. Plagioclase phenocrysts in the Unit 4 basalt<br />
occur as individual euhedral crystals and as glomerocrysts. Plagioclase<br />
phenocrysts in the Unit 10 basalt occur most commonly as parts of<br />
glomerocrysts.<br />
186<br />
A)<br />
B)
187<br />
TABLE 4.1<br />
UNIT 4 PLAGIOCLASE MAJOR <strong>AND</strong> TRACE ELEMENT<br />
ABUNDANCES<br />
Sample Zone An FeOT P2O5 K2O TiO2 Na2O CaO MgO SiO2 Al2O3 Total Sc Ti V Rb Sr Y Ba La Ce Pr Nd Sm Eu Pb<br />
(mol%)<br />
K C 69 0.62 0.12 0.18 0.05 3.47 14.29 0.16 51 31 100.95 2 642 3.5 0.37 829 0.33 99 0.92 2.2 0.21 0.77 0.07 0.59 0.76<br />
K I 71 0.67 0.08 0.17 0.04 3.17 14.78 0.18 50.6 31.2 100.91 1.4 522 3.3 0.22 850 0.27 81 1.07 2.4 0.23 1.03 0.15 0.61 0.67<br />
K R 66 0.67 0.05 0.21 0.09 3.78 13.7 0.18 51.5 30.8 100.99 1.9 565 3.1 0.17 839 0.17 79 0.95 2 0.2 0.68 0.09 0.59 0.6<br />
L C 61 0.63 0.1 0.25 0.09 4.23 12.41 0.19 52.9 29.9 100.73 1.2 566 2.8 0.30 797 0.07 73 0.94 1.7 0.18 0.52 0.14 0.52 0.55<br />
L I 62 0.68 0.1 0.27 0.1 4.23 12.8 0.2 52.7 29.7 100.84 1.4 630 3.4 0.42 804 0.33 84 0.77 1.7 0.16 0.48 0.14 0.63 0.67<br />
L R 68 0.65 0.09 0.18 0.08 3.55 14.17 0.17 50.9 31 100.79 1.1 481 3.8 0.23 803 0.23 68 0.84 1.8 0.18 0.67 0.16 0.53 0.71<br />
Q C 66 0.6 0.07 0.24 0.07 3.7 13.68 0.18 52 30.1 100.59 1.5 478 5.1 0.34 852 0.12 70 0.74 1.8 0.16 0.48 0.1 0.63 0.86<br />
Q I 65 0.65 0.08 0.22 0.03 3.9 13.37 0.18 52.5 29.5 100.49 1.6 483 4 0.24 882 0.13 69 0.87 1.8 0.17 0.7 0.05 0.55 0.7<br />
Q R 60 0.73 0.05 0.26 0.08 4.34 12.47 0.16 53.4 28.9 100.39 2.8 581 3.4 – 922 0.08 91 1.01 2 0.23 0.73 0.12 0.59 0.78<br />
P C 66 0.65 0.1 0.21 0 3.63 13.34 0.18 52.1 30.2 100.48 2.1 445 3.8 0.34 856 0.14 68 0.69 1.5 0.16 0.48 0.07 0.51 0.89<br />
P I 65 0.08 0.21 0 3.82 13.04 0.15 53 29.9 100.17 1.4 462 4.6 0.35 825 0.13 67 0.78 1.8 0.17 0.69 0.07 0.56 0.65<br />
J C 68 0.6 0.04 0.2 0.08 3.6 14.43 0.2 51.3 30.4 100.92 1.5 499 4.4 0.30 924 0.09 71 0.86 1.8 0.2 0.61 0.08 0.58 0.44<br />
J I 68 0.62 0.09 0.19 0.08 3.66 14.26 0.17 51.4 30.7 101.21 1.6 479 4.2 0.29 909 0.1 72 0.9 1.9 0.17 0.57 0.12 0.55 0.48<br />
J R 62 0.79 0.08 0.25 0.07 4.23 12.91 0.19 53 29.4 100.9 1.8 580 3.9 0.34 925 0.09 98 1.05 1.9 0.2 0.68 0.05 0.73 0.64<br />
N C 64 0.65 0.08 0.2 0.28 3.92 13.22 0.19 52.4 30 100.94 1.7 501 3.3 0.26 849 0.1 70 0.84 1.7 0.18 0.66 0.14 0.57 0.63<br />
N R 61 0.8 0.06 0.26 0 4.23 12.71 0.19 52.9 29.7 100.88 1.5 845 6.9 0.59 1040 0.21 132 1.53 2.8 0.26 1.22 0.21 1.33 0.97<br />
O C 67 1.24 0.07 0.2 0 3.57 13.57 0.18 51.1 31 100.97 1.2 429 3.8 0.31 874 0.13 69 0.84 1.8 0.14 0.68 0.1 0.61 0.54<br />
O I 67 0.68 0.11 0.2 0.04 3.58 13.43 0.16 51.9 30.7 100.72 2.2 535 4.1 0.40 934 0.11 92 0.96 1.9 0.19 0.73 0.1 0.72 0.82<br />
O I 57 0.71 0.06 0.3 0.09 4.6 11.6 0.16 54.2 29.1 100.73 1.5 660 3.5 0.51 905 0.1 91 0.92 2.1 0.21 0.8 0.1 0.55 0.53<br />
O I 62 0.73 0.1 0.25 0.11 4.09 12.56 0.16 53 29.6 100.62 1.2 713 4.9 0.48 983 0.1 116 1.26 2.3 0.2 0.93 0.2 0.9 0.67<br />
O R 54 0.87 0.09 0.33 0.13 4.83 10.67 0.38 55.2 28 100.46 2 785 7.2 0.69 917 0.13 125 1.15 2.1 0.2 0.72 0.15 0.98 0.69<br />
D C 67 0.67 0.1 0.2 0 3.65 13.98 0.17 51.6 30.3 100.7 1.1 522 4 0.18 929 0.13 69 0.88 1.7 0.18 0.77 0.12 0.59 0.46<br />
D R 64 0.6 0.08 0.21 0.07 3.96 12.9 0.19 52.1 30 100.13 1.5 534 4.5 0.34 906 0.12 71 0.88 1.6 0.17 0.56 0.1 0.64 0.48<br />
A C 63 0.6 0.08 0.22 0.09 4.1 12.83 0.19 53 29.2 100.21 1.7 492 3 0.36 949 0.08 77 0.87 1.8 0.19 0.64 0.1 0.44 1.21<br />
A I 64 0.65 0.06 0.22 0.08 4.07 13.28 0.19 52.7 29 100.24 2 519 3.6 0.40 929 0.09 84 0.82 2.1 0.2 0.64 0.07 0.57 0.53<br />
A I 64 0.68 0.07 0.22 0.08 4.01 13.3 0.21 52.9 28.8 100.23 2.4 525 3.4 0.36 942 0.11 80 0.88 2.1 0.22 0.73 0.1 0.6 0.46<br />
A R 64 0.71 0.08 0.23 0.09 3.85 12.84 0.17 52.8 28.9 99.66 2.2 474 3.9 0.33 836 0.1 73 0.74 1.8 0.16 0.6 0.12 0.6 0.46<br />
C C 71 0.65 0.08 0.18 0.04 3.24 15.04 0.14 50.5 30.3 100.16 1.2 447 3.2 0.27 945 0.21 89 1.05 2.2 0.22 0.87 0.09 0.59 0.67<br />
C I 66 0.6 0.07 0.2 0.09 3.8 13.78 0.18 52.3 29.2 100.15 1.5 502 3.5 0.31 904 0.15 74 0.99 1.9 0.18 0.78 0.11 0.55 0.64<br />
C R 59 0.69 0.05 0.28 0.07 4.58 12.52 0.17 53.7 28.3 100.31 2.4 594 3.8 0.60 904 0.09 97 1 2 0.21 0.61 0.08 0.65 0.68<br />
1 C = core; I = Intermediate Zone; R = rim<br />
2 total Fe as FeO<br />
3 [An = Ca / (Ca+Na+K)]*100
4.4.2 Electron Probe Microanalysis (EPMA) - Major Elements<br />
The An-Ab-Or compositions of zones within Unit 4 and 10 plagioclase phe-<br />
nocrysts that were targeted for trace element microanalysis are shown in figure 4.5.<br />
The An content of Unit 4 plagioclase zones range from An54 to An71, and Unit<br />
10 crystals span a narrower An57 to An67 range. Unit 4 plagioclase cores trend<br />
to higher An content, and rims trend to lower An content and greater Or con-<br />
tent (Fig. 4.5a). Intermediate zones are nearly identical to Unit 4 cores in terms<br />
of An-Ab-Or composition (Fig. 4.5b). The lowest An zone sampled in a Unit 4<br />
plagioclase was An54 along a crystal rim, whereas the highest An zones are an<br />
An71 intermediate zone near a crystal core and an An71 core. Unit 10 plagioclase<br />
cores and intermediate zones trend to lower An content than rim zones (Fig. 4.5b).<br />
The highest An zones sampled in Unit 10 plagioclase phenocrysts are an An67 rim<br />
zone and an An67 intermediate zone that is adjacent to a crystal rim, and the<br />
lowest An zones sampled include two near-core An57 zones and an An58 crystal<br />
core (Fig. 4.5b).<br />
Core-to-rim EPMA point traverses reveal that each of the Unit 4 and 10 pla-<br />
gioclase crystals analyzed in this study contain major element oscillations, which<br />
is consistent with oscillatory zoning apparent in cross polarized light and backscat-<br />
ter electron images (e.g., Figs. 4.9b,c). Half of the Unit 4 plagioclase phenocrysts<br />
examined exhibit normal zoning patterns (Fig. 4.6b,d,g,h,j). Crystals from Units<br />
4 and 10 have ubiquitous thin (5-10 µm thick) low An rims that are not obvious<br />
for each crystal in figures 4.6 and 4.7. One Unit 4 crystal examined in this study<br />
exhibits little significant core to rim change in An content (Fig. 4.6c). Four of the<br />
ten Unit 4 plagioclase phenocrysts examined in this study exhibit reverse zoning<br />
(Fig. 4.6a,e,f,i). Each of the Unit 10 plagioclase phenocrysts examined in this<br />
188
Figure 4.5. A) An-Ab-Or compositions of Unit 4 plagioclase phenocryst<br />
core, intermediate, and rim zones. Unit 4 rim zones trend to the lowest<br />
An contents. B) An-Ab-Or compositions of Unit 10 plagioclase<br />
phenocryst core, intermediate, and rim zones. Unit 10 plagioclase cores<br />
trend to the lowest An contents of all zones sampled.<br />
189
An (mol %)<br />
An (mol %)<br />
An (mol %)<br />
An (mol %)<br />
An (mol %)<br />
crystal A<br />
crystal C<br />
crystal D<br />
crystal J<br />
crystal K<br />
Unit 4<br />
A)<br />
B)<br />
C)<br />
D)<br />
E)<br />
crystal L<br />
crystal N<br />
crystal O<br />
crystal P<br />
crystal Q<br />
1 mm 1 mm<br />
core rim core rim<br />
Figure 4.6. Core to rim profiles of ten Unit 4 plagioclase phenocrysts.<br />
Other major and trace element data measured at various points along<br />
the core to rim transects are presented in table 4.1.<br />
190<br />
F)<br />
G)<br />
H)<br />
I)<br />
J)
An (mol %)<br />
An (mol %)<br />
An (mol %)<br />
An (mol %)<br />
10-1D-A<br />
10-1C-A<br />
10-1C-B1<br />
10-1C-B2<br />
A)<br />
B)<br />
C)<br />
D)<br />
Unit<br />
10<br />
10-2A-C<br />
10-1C-D<br />
10-2A-D<br />
2 mm 2 mm<br />
core rim core rim<br />
Figure 4.7. Core to rim profiles of seven Unit 10 plagioclase<br />
phenocrysts. Other major and trace element data measured at various<br />
points along the core to rim transects are presented in table 4.2.<br />
191<br />
F)<br />
E)<br />
G)
study exhibit their highest An at the crystal rim (Fig. 4.7). With the exception of<br />
crystal 10-1C-B2 (Fig. 4.6d), each of the Unit 10 crystals exhibits reverse zonation<br />
(Fig. 4.7). Crystal 10-1C-A exhibits complex zonation, but has an overall reversed<br />
zoning pattern (Fig. 4.7b). In summary Unit 4 plagioclase phenocrysts are a mix-<br />
ture of normal zoned crystals, reversely zoned crystals, and a few unzoned crystals.<br />
Unit 10 plagioclase phenocrysts are are dominantly reversely zoned.<br />
192
193<br />
TABLE 4.2<br />
UNIT 10 PLAGIOCLASE MAJOR <strong>AND</strong> TRACE ELEMENT<br />
ABUNDANCES<br />
Sample Zone An FeOT P2O5 K2O TiO2 Na2O CaO MgO SiO2 Al2O3 Total Sc Ti V Rb Sr Y Ba La Ce Pr Nd Sm Eu Pb<br />
(mol%)<br />
10-1C-A C 60 0.63 0.11 0.33 0.16 4.48 12.98 0.14 52.7 29.4 100.93 1.5 654 6 0.7 862 0.09 133 1.10 2.5 0.22 0.83 0.13 1.09 1.18<br />
10-1C-A I 65 0.58 0.09 0.27 0.03 4.03 13.85 0.14 52 30.1 101.09 1.9 695 4.7 0.62 890 0.13 106 1.08 2.2 0.21 0.78 0.15 0.88 1.21<br />
10-1C-A I 62 0.59 0.06 0.31 0.1 4.19 13.18 0.16 52.6 29.1 100.29 1.6 797 5.8 0.79 911 0.12 142 1.16 2.5 0.24 0.88 0.15 0.97 1.07<br />
10-1C-A R 66 0.59 0.1 0.23 0.06 3.9 14.06 0.17 51.8 29.6 100.41 1.8 648 5.3 0.54 836 0.12 96.9 1.03 2.1 0.19 0.71 0.08 0.79 1.06<br />
10-1C-B1 C 65 0.55 0.1 0.25 0.07 3.82 13.6 0.14 52.4 28.8 99.68 1.8 779 5.9 0.67 895 0.13 142 1.16 2.8 0.27 0.99 0.13 1.22 1.16<br />
10-1C-B1 I 61 0.56 0.11 0.27 0.08 4.31 12.96 0.15 53.7 27.8 99.86 2.5 845 6.5 0.97 905 0.17 147 1.23 2.8 0.23 0.97 0.14 1.09 1.24<br />
10-1C-B1 I 65 0.62 0.09 0.25 0.09 3.86 13.78 0.16 51.5 29.9 100.19 2.1 695 5.8 0.5 846 0.09 112 1.07 2.6 0.22 0.82 0.15 0.97 1.15<br />
10-1C-B1 I 64 0.64 0.11 0.23 0.05 3.92 13.29 0.17 51.9 29.5 99.78 1.9 689 5.5 0.55 804 0.14 110 1.00 2.4 0.2 0.84 0.13 0.8 1.21<br />
10-1C-B1 R 66 0.66 0.08 0.22 0.13 3.82 14.14 0.18 51.2 29.7 100.16 2.3 731 5.4 0.47 848 0.11 111 1.07 2.6 0.22 0.87 0.09 0.88 1.15<br />
10-1C-B2 C 58 0.59 0.06 0.37 0.12 4.61 12.35 0.16 52.8 28.4 99.46 2.2 995 7.1 1.11 913 0.2 151 1.39 3.1 0.29 0.91 0.16 0.95 1.27<br />
10-1C-B2 I 64 0.62 0.11 0.28 0.03 4.06 13.42 0.17 52.1 29 99.82 1.7 701 5.3 0.57 806 0.13 105 1.04 2.5 0.23 0.9 0.12 0.8 1.24<br />
10-1C-B2 I 62 0.63 0.09 0.29 0.07 4.33 13.2 0.15 51.8 29.1 99.63 2.2 719 5.3 0.5 800 0.13 113 1.06 2.5 0.23 0.79 0.11 0.85 1.05<br />
10-1C-B2 R 59 0.61 0.13 0.32 0.09 4.49 12.12 0.17 52.9 28.7 99.51 2.6 761 5.1 0.88 813 0.13 113 1.02 2.2 0.21 0.68 0.08 0.71 1.30<br />
10-2A-D C 59 0.47 0.03 0.32 0.08 4.35 11.99 0.17 54.2 28.6 100.15 1 803 5 0.66 885 0.2 127 1.34 2.2 0.23 0.86 0.18 1.09 1.42<br />
10-2A-D R 67 0.48 0.05 0.23 0.1 3.54 13.27 0.12 52.2 29.7 99.66 1.6 636 4.1 0.47 777 0.21 84.6 1.21 1.9 0.2 0.75 0.12 0.75 0.78<br />
10-2A-C C 58 0.53 0.06 0.37 0.11 4.47 11.77 0.17 54.3 28.2 100 1 785 5 0.71 862 0.16 120 1.36 2.2 0.25 0.93 0.17 1.04 0.78<br />
10-2A-C I 62 0.48 0.11 0.32 0.06 4.07 12.61 0.19 53.4 29.1 100.29 1.3 917 5.5 0.85 941 0.2 139 1.44 2.4 0.27 0.86 0.13 1.2 0.93<br />
10-2A-C I 67 0.49 0.07 0.27 0.05 3.62 13.97 0.17 52 29.3 99.91 0.9 654 4.2 0.36 772 0.16 84 1.12 2 0.23 0.81 0.12 0.79 0.65<br />
10-2A-C R 65 0.56 0.08 0.25 0.07 3.79 13.52 0.17 52.1 29.3 99.83 1.2 755 6.2 0.46 845 0.19 101 1.30 2.1 0.23 0.81 0.15 0.99 0.89<br />
10-1C-D C 0 0.48 0.08 0.27 0.1 3.96 12.83 0.18 53 29.4 100.36 1.9 737 5.3 0.55 801 0.15 114 0.97 2.3 0.21 0.77 0.1 1.01 0.83<br />
10-1C-D I 60 0.47 0.08 0.32 0.12 4.38 12.2 0.2 53.6 28 99.35 1.7 887 6.1 0.76 801 0.07 146 1.08 2.5 0.2 0.59 0.09 0.99 0.96<br />
10-1C-D I 63 0.44 0.05 0.28 0.11 3.97 12.71 0.16 52.9 29.3 99.92 1.8 827 5.4 0.8 797 0.15 141 1.05 2.4 0.21 0.7 0.1 0.93 0.99<br />
10-1C-D I 59 0.5 0.11 0.33 0.07 4.38 11.99 0.19 53.9 27.8 99.26 2.3 911 6.5 0.86 845 0.08 143 1.05 2.5 0.23 0.94 0.11 0.95 1.00<br />
10-1C-D R 62 0.46 0.11 0.28 0.12 4.15 12.64 0.17 53.3 27.8 98.96 1.4 839 6.8 0.51 785 0.13 119 1.03 2.4 0.23 0.74 0.09 1.06 1.34<br />
10-1D-A I 57 0.53 0.09 0.34 0.14 4.48 11.42 0.17 54.8 28.8 100.68 1.5 833 5.8 0.65 797 0.11 121 1.06 2.3 0.22 0.61 0.13 0.89 0.95<br />
10-1D-A I 57 0.41 0.07 0.36 0.14 4.49 11.53 0.18 54.5 28 99.68 1.6 947 5.7 0.79 815 0.1 142 1.01 2.3 0.23 0.66 0.05 0.87 0.87<br />
10-1D-A R 66 0.46 0.1 0.25 0.11 3.65 13.44 0.17 52.5 29 99.6 1.4 803 6.1 0.52 832 0.11 118 1.02 2.5 0.26 0.69 0.13 0.82 0.70<br />
BCR-2G – – – – – 2.30 – – – – – – 33.1 – 402.2 46.9 335.4 33.5 706.9 26.2 52.6 6.9 28.7 6.7 2.0 10.0<br />
– – – – – – ±0.36 – – – – – – ±0.74 – ±22.9±3.7 ±16.2±1.23±47.2±1.1 ±3.0 ±0.29±1.7 ±0.43±0.06±0.79<br />
BCR-2<br />
cert.<br />
– – – – – 2.24 – – – – – – 32.6 – 407 47.5 337 32.5 684 25.3 53.6 6.8 28.6 6.7 2.0 10.34<br />
1 C = core; I = Intermediate Zone; R = rim<br />
2 total Fe as FeO<br />
3 [An = Ca / (Ca+Na+K)]*100
4.4.3 LA-ICP-MS - Trace Elements<br />
Anorthite content is a controlling factor of trace element substitution in pla-<br />
gioclase (hence negative correlations with An content in Figs. 4.11 and 4.12; e.g.,<br />
[10]), so comparisons of core, rim, and intermediate zones with similar An con-<br />
tents are most informative. Given the narrow An range exhibited by Unit 4 and<br />
10 crystals this manner of comparison is possible.<br />
4.4.3.1 Scandium, Ti, V, and Pb<br />
Negative correlations of Ti, V, and Pb abundance with An content are ap-<br />
parent for crystals from both Units 4 and 10. There is little obvious correlation<br />
of Sc abundance with An content for crystals from either Unit. (Fig. 4.11a-c,e;<br />
Tables 4.4), 4.5). In terms of Sc abundance there is little distinction between Unit<br />
4 and Unit 10 plagioclase crystals (Fig. 4.11a). For a given An content, Unit 10<br />
phenocrysts have greater Ti, V, and Pb abundances than Unit 4 plagioclase crys-<br />
tals (Fig. 4.11b,c,f). There is little distinction in Sc, Ti, V, and Pb abundances<br />
between plagioclase zones from either Unit.<br />
4.4.3.2 Barium, Sr, and Rb<br />
. Crystals from Units 4 and 10 exhibit negative correlations of Ba and Rb with<br />
An content and no correlation of Sr abundance with An content (Figs. 4.11d,e<br />
and 4.12a). At a given An content, Unit 10 crystals have greater Ba and Rb<br />
abundances than Unit 4 phenocrysts. Unit 4 and 10 phenocrysts have similar Sr<br />
overlapping Sr abundance, but Unit 10 crystals tend to have lower Sr at a given An<br />
content (Fig. 4.12a). Where Unit 10 phenocryst interiors (cores and intermediate<br />
zones) and rims have overlapping An content, rims tend to have the lowest Ba<br />
194
87<br />
Sr/<br />
86<br />
SrI = 0.704937(10)<br />
Ba/Sr = 0.08<br />
Rb/Sr = 0.0004<br />
crystal A<br />
crystal J<br />
87<br />
Sr/<br />
86<br />
SrI = 0.704951(14)<br />
Ba/Sr = 0.08<br />
Rb/Sr = 0.0003<br />
1 mm<br />
87<br />
Sr/<br />
86<br />
SrI = 0.704902(10)<br />
Ba/Sr = 0.08<br />
Rb/Sr = 0.0003<br />
1 mm<br />
87<br />
Sr/<br />
86<br />
SrI = 0.704845(6)<br />
Ba/Sr = 0.09<br />
Rb/Sr = 0.0004<br />
87<br />
Sr/<br />
86<br />
SrI = 0.704849(12)<br />
Ba/Sr = 0.07<br />
Rb/Sr = 0.0002<br />
87 86<br />
Sr/ SrI = 0.704985(68)<br />
Ba/Sr = 0.08<br />
Rb/Sr = 0.0004<br />
1 mm<br />
A)<br />
B)<br />
crystal D<br />
Figure 4.8. Diagrams of zoning features in the three of five Unit 4<br />
plagioclase phenocrysts that were subjects of EPMA, LA-ICP-MS and<br />
micro Sr isotope analyses. Thin dotted black lines mark the locations of<br />
core to rim EPMA transects. 87 Sr/ 86 SrI results are shown for each<br />
along with the measured 2σ error in parentheses. Measured Ba/Sr and<br />
Rb/Sr ratios are shown for each zone examined. A) The core of crystal<br />
A is bounded by a resorption surface that is marked with a dotted<br />
white line. Anorthite content increases from ∼ An65 to > An70 (see<br />
Fig. 4.6a). B)The core of crystal D is bounded by a resorption surface<br />
with an a change from ∼ An63 to > An67 across the surface (see<br />
Fig. 4.6c). C) Crystal J is a normal zoned crystal. There is a change in<br />
the zoning pattern marked noted by a white dotted line but no obvious<br />
resorption surface. (see also Fig. 4.6j).<br />
195<br />
C)
87 86<br />
Sr/ SrI = 0.705722(8)<br />
Ba/Sr = 0.12<br />
Rb/Sr = 0.0007<br />
Ba/Sr = 0.12<br />
Rb/Sr = 0.0006<br />
1 mm<br />
87 86<br />
Sr/ SrI = 0.705575(10)<br />
Ba/Sr = 0.18<br />
Rb/Sr = 0.0009<br />
10-1D-A<br />
87 86<br />
Sr/ SrI = 0.705637(12)<br />
Ba/Sr = 0.17<br />
Rb/Sr = 0.0010<br />
87 86<br />
Sr/ SrI = 0.705536(8)<br />
Ba/Sr = 0.14<br />
Rb/Sr = 0.0006<br />
87 86<br />
Sr/ SrI = 0.705735(10)<br />
Ba/Sr = 0.15<br />
Rb/Sr = 0.0008<br />
87 86<br />
Sr/ SrI = 0.705685(6)<br />
Ba/Sr = 0.16<br />
Rb/Sr = 0.0009<br />
Ba/Sr = 0.14<br />
Rb/Sr = 0.0007<br />
Ba/Sr = 0.18<br />
Rb/Sr = 0.001<br />
1 mm<br />
1 mm<br />
Ba/Sr = 0.15<br />
Rb/Sr = 0.0006<br />
87<br />
Sr/<br />
86<br />
SrI = 0.705620(10)<br />
Ba/Sr = 0.17<br />
Rb/Sr = 0.0010<br />
Ba/Sr = 0.15<br />
Rb/Sr = 0.0008<br />
A)<br />
10-1C-A<br />
B)<br />
10-1C-D<br />
Figure 4.9. Diagrams of zoning features in the two of five Unit 10<br />
plagioclase phenocrysts that were subjects of EPMA, LA-ICP-MS and<br />
micro Sr isotope analyses. Thin dotted black lines mark the locations of<br />
core to rim EPMA transects. 87 Sr/ 86 SrI results are shown for each<br />
along with the measured 2σ error in parentheses. Measured Ba/Sr and<br />
Rb/Sr ratios are shown for each zone examined. A) Crystal 10-1C-A<br />
contains four distinct zones that were sampled. These zones are visible<br />
in the cross polarized light photo. These zones, which were each<br />
sampled, are ∼An60 in the core, an ∼An65 intermediate zone, an ∼An60<br />
intermediate zone, and an > An65 rim zone (see Fig. 4.7b). B) Crystal<br />
10-1C-D contains abundant oscillatory zoning but has an overall reverse<br />
zonation pattern and at least two zones, which were each sampled,<br />
where An content is higher (up to An65 than the core An61−62 (see<br />
Fig. 4.7f). C) Crystal 10-1D-A appears to be a fragment of a large<br />
crystal with an oscillatory zoned interior. This crystal has an obvious<br />
resorption surface near the rim that in accompanied by a change in<br />
from An62−63 to > An66.<br />
196<br />
C)
87 Sr/ 86 SrI = 0.705542(8)<br />
Ba/Sr = 0.14<br />
Rb/Sr = 0.0008<br />
87 Sr/ 86 SrI = 0.705510(8)<br />
Ba/Sr = 0.11<br />
Rb/Sr = 0.0006<br />
2 mm<br />
Ba/Sr = 0.15<br />
Rb/Sr = 0.0009<br />
2 mm<br />
A)<br />
10-2A-C<br />
10-2A-D 87 Sr/ 86 SrI = 0.705572(10)<br />
Ba/Sr = 0.14<br />
Rb/Sr = 0.0007<br />
Figure 4.10. Diagrams of zoning features in the three Unit 10<br />
plagioclase phenocrysts that were subjects of EPMA, LA-ICP-MS and<br />
micro Sr isotope analyses. Thin dotted black lines mark the locations of<br />
core to rim EPMA transects. 87 Sr/ 86 SrI results are shown for each<br />
along with the measured 2σ error in parentheses. Measured Ba/Sr and<br />
Rb/Sr ratios are shown for each zone examined. A) Crystal 10-2A-C<br />
has an ∼ An60 core bounded by a resorption surface and an An65−66<br />
rim. Both the core and rim were sampled. B) Crystal 10-2A-D has an<br />
∼ An60 core bounded by a dissolution surface and an An65−67 rim. Both<br />
the core and rim were sampled.<br />
197<br />
B)
and Rb (Fig. 4.11d,e).<br />
4.4.3.3 Yttrium and the Rare Earth Elements La, Ce, Pr, Nd, Sm, and Eu<br />
The highest Y abundances were measured in Unit 4 crystal cores and inter-<br />
mediate zones (Fig. 4.12b). There is no other obvious systematic variation in Y<br />
abundance between phenocryst zones in crystals from either Unit. At a given An<br />
content, Unit 10 phenocrysts have greater La, Ce, Pr, Nd, Sm, and Eu. Where core<br />
and interior sections of Unit 4 phenocrysts overlap, they tend to have lower overall<br />
REE abundances relative to the instances where there is no overlap (Fig. 4.12).<br />
The opposite relationship holds true or Unit 10 phenocryst zones with overlap-<br />
ping An, where core and intermediate zones tend to have greater REE abundances<br />
(Fig. 4.12).<br />
4.4.4 Sr Isotope Microdrilling<br />
There are subtle variations in 87 Sr/ 86 SrI between crystals zones in Unit 4 and<br />
10 crystals (Figs. 4.13, 4.8, 4.9, and 4.10; Table 4.3). Unit 4 crystals have much<br />
less radiogenic 87 Sr/ 86 SrI than Unit 10 crystals (Fig. 4.13). The rim of Unit 4<br />
crystal D bears the most radiogenic 87 Sr/ 86 SrI observed in a Unit 4 crystal and<br />
exhibits a higher 87 Sr/ 86 SrI than all Site 1137 upper group whole-rock samples<br />
reported by Ingle et al. [75] (Fig. 4.8b). The rim zone of crystal D is bounded by a<br />
resorption surface and a change from An67 in the intermediate zone to An64 at the<br />
rim. All other Unit 4 plagioclase zones overlap Site 1137 upper group whole-rock<br />
87 Sr/ 86 SrI reported by Ingle et al. [75]. There is little other distinction in terms<br />
of 87 Sr/ 86 SrI between core, intermediate, and rim zones (Fig. 4.13).<br />
Site 1137 lower group whole-rock samples reported by Ingle et al. [75] extend<br />
198
Sc (ppm)<br />
Ti (ppm)<br />
V (ppm)<br />
An (mol %)<br />
A)<br />
B)<br />
C)<br />
Rb (ppm)<br />
Ba (ppm)<br />
Pb (ppm)<br />
Unit 4 plagioclase cores<br />
Unit 4 plagioclase intermediate zones<br />
Unit 4 plagioclase rims<br />
An (mol %)<br />
Unit 10 plagioclase cores<br />
Unit 10 plagioclase intermediate zones<br />
Unit 10 plagioclase rims<br />
Figure 4.11. Trace element abundances (in ppm) measured in core,<br />
intermediate, and rim zones of Unit 4 and 10 plagioclase phenocrysts<br />
plotted against anorthite. A) Sc, B) Ti C) V, D) Rb, E) Ba, and F) Pb.<br />
199<br />
D)<br />
E)<br />
F)
Sr (ppm)<br />
Y (ppm)<br />
La (ppm)<br />
Ce (ppm)<br />
An (mol %)<br />
A)<br />
B)<br />
C)<br />
D)<br />
Pr (ppm)<br />
Nd (ppm)<br />
Sm (ppm)<br />
Eu (ppm)<br />
Unit 4 plagioclase cores<br />
Unit 4 plagioclase intermediate zones<br />
Unit 4 plagioclase rims<br />
An (mol %)<br />
Unit 10 plagioclase cores<br />
Unit 10 plagioclase intermediate zones<br />
Unit 10 plagioclase rims<br />
Figure 4.12. Trace and rare earth element element abundances (in ppm)<br />
measured in core, intermediate, and rim zones of Unit 4 and 10<br />
plagioclase phenocrysts plotted against anorthite. A) Sr, B) Y C) La,<br />
D) Ce, E) Pr, F) Nd G) Sm, and H) Eu.<br />
200<br />
E)<br />
F)<br />
G)<br />
H)
TABLE 4.3<br />
UNIT 4 <strong>AND</strong> 10 87 Sr/ 86 Sr DATA<br />
Sample Zone<br />
Site 1137 Unit 4 Plagioclase<br />
87 Sr/ 86 SrM Rb/Sr<br />
87 Sr/ 86 SrI<br />
J C rep1 0.704940(12) – 0.704939<br />
J C rep2 0.704965(14) – 0.704964<br />
J C avg 0.704953(13) 0.0003 0.70495<br />
J I 0.704903(10) 0.0003 0.704902<br />
D C 0.704850(12) 0.0002 0.704849<br />
D R 0.704987(68) 0.0004 0.704985<br />
A C rep1 0.704941(12) – 0.704939<br />
A C rep2 0.704936(8) – 0.704934<br />
A C avg 0.704939(10) 0.0004 0.704937<br />
A R 0.704847(6) 0.0004 0.704845<br />
Site 1137 Unit 10 Plagioclase<br />
10-1C-A C 0.705738(10) 0.0008 0.705735<br />
10-1C-A I 0.705725(8) 0.0007 0.705722<br />
10-1C-A I 0.705689(6) 0.0009 0.705685<br />
10-2A-D C 0.705575(10) 0.0007 0.705572<br />
10-2A-D R 0.705513(8) 0.0006 0.705510<br />
10-2A-C C 0.705545(8) 0.0008 0.705542<br />
10-1C-D I 0.705577(10) 0.0009 0.705575<br />
10-1C-D I 0.705623(10) 0.0010 0.705620<br />
10-1D-A I 0.705640(12) 0.0010 0.705637<br />
10-1D-A R 0.705539(8) 0.0006 0.705536<br />
1 A 107.7 Ma age of Site 1137 basalts from [42] was used to correct Sr isotope ratios for in-situ decay. I subscript denotes<br />
initial 87 Sr/ 86 Sr ratio.<br />
2 values in parentheses are errors reported as measured 2σ in the last two decimal places of 87 Sr/ 86 SrM.<br />
3 C = core, I = intermediate zone, R = rim.<br />
4 Rb/Sr measured at coincident microdrill site by LA-ICP-MS.<br />
201
Unit 4<br />
plagioclase rims<br />
plagioclase intermediate zones<br />
plagioclase cores<br />
Site 1137 Upper Group whole-rock<br />
Unit 10<br />
plagioclase rims<br />
plagioclase intermediate zones<br />
plagioclase cores<br />
Site 1137 Lower Group<br />
whole-rock<br />
0.704500 0.705000 0.705500 0.706000 0.706500<br />
Figure 4.13. The range of 87 Sr/ 86 SrI of Unit 4 and Unit 10 phenocrysts<br />
are shown relative to their respective host basalt groups as defined by<br />
Ingle et al. [75]. Note that plagioclase phenocrysts from each unit are<br />
similar to whole-rock 87 Sr/ 86 SrI reported by Ingle et al. [75]. Unit 10<br />
plagioclase rims are less radiogenic but still overlap intermediate and<br />
rim zones.<br />
to more radiogenic 87 Sr/ 86 SrI than any Unit 10 plagioclase zone sampled in this<br />
study (Fig. 4.13). Unit 10 plagioclase rims exhibit the least radiogenic 87 Sr/ 86 SrI<br />
of the three zones (Fig. 4.13). The core of crystal 10-1C-A has the most radiogenic<br />
87 Sr/ 86 SrI any Unit 10 crystal zone sampled (Fig. 4.9a), and the rim of crystal 10-<br />
2A-D has the least 87 Sr/ 86 SrI of any Unit 10 crystal zone (Fig. 4.10b). In summary,<br />
crystals from both Units 4 and 10 have 87 Sr/ 86 SrI similar to Site 1137 upper group<br />
(less radiogenic) and lower group (more radiogenic) whole-rock samples (i.e., their<br />
host basalts) reported by Ingle et al. [75].<br />
4.4.5 Inferred Parent Magma Compositions<br />
Plagioclase parent magmas from Units 4 and 10 have Ba/Sr ratios and Rb<br />
abundances that overlap Site 1137 upper group and lower group basalts. (Fig. 4.14),<br />
although this overlap is less apparent when a smaller subset of Site 1137 basalts<br />
202
are considered (i.e., those where 87 Sr/ 86 Sr ratios were also measured (Fig. 4.14b).<br />
Rare earth element abundances and ratios (including Y) in Unit 4 and 10 plagio-<br />
clase parent magmas are distinctly lower than Site 1137 basalts (Tables 4.4, 4.5;<br />
(Fig. 4.14c). The origins of these low abundances are explored below.<br />
203
204<br />
TABLE 4.4<br />
UNIT 4 PLAGIOCLASE PARTITION COEFFICIENTS <strong>AND</strong><br />
INFERRED PARENT MAGMA COMPOSITIONS<br />
Sample Zone An DRb DSr DY DBa DLa DCe DP r DNd DSm Rb Sr Y Ba La Ce Pr Nd Sm<br />
(mol%)<br />
K C 69 0.01 1.77 0.01 0.27 0.10 0.09 0.07 0.05 0.03 33.1 467.4 39.4 367.3 8.8 25.6 3.0 14.3 2.2<br />
K I 71 0.01 1.70 0.01 0.25 0.10 0.09 0.07 0.05 0.03 20.0 499.7 31.9 327.6 10.4 27.3 3.3 18.9 4.8<br />
K R 66 0.01 1.86 0.01 0.30 0.10 0.09 0.07 0.05 0.03 14.9 452.1 19.9 265.2 9.1 23.5 2.8 12.8 3.0<br />
L C 61 0.01 2.00 0.01 0.35 0.11 0.09 0.07 0.05 0.03 25.6 397.6 8.2 208.4 8.8 19.9 2.6 10.0 4.9<br />
L I 62 0.01 1.98 0.01 0.34 0.11 0.09 0.07 0.05 0.03 35.3 405.3 38.0 244.8 7.3 19.8 2.4 9.3 4.9<br />
L R 68 0.01 1.79 0.01 0.28 0.10 0.09 0.07 0.05 0.03 20.6 448.0 26.5 246.0 8.0 20.3 2.6 12.4 5.0<br />
Q C 66 0.01 1.85 0.01 0.29 0.10 0.09 0.07 0.05 0.03 30.0 461.2 13.6 238.6 7.1 20.1 2.3 9.0 3.3<br />
Q I 65 0.01 1.89 0.01 0.31 0.11 0.09 0.07 0.05 0.03 20.8 465.9 15.4 221.7 8.3 21.1 2.5 13.3 1.6<br />
Q R 60 0.01 2.02 0.01 0.36 0.11 0.09 0.07 0.05 0.03 0.0 456.4 8.8 254.1 9.5 23.2 3.4 14.1 4.0<br />
P C 66 0.01 1.85 0.01 0.29 0.10 0.09 0.07 0.05 0.03 30.2 463.2 16.1 232.0 6.6 17.7 2.3 9.0 2.4<br />
P I 65 0.01 1.90 0.01 0.31 0.11 0.09 0.07 0.05 0.03 30.7 435.2 14.8 216.3 7.4 20.1 2.4 13.1 2.4<br />
J C 68 0.01 1.79 0.01 0.28 0.10 0.09 0.07 0.05 0.03 26.4 515.8 10.3 256.8 8.3 20.9 2.8 11.3 2.7<br />
J I 68 0.01 1.81 0.01 0.28 0.10 0.09 0.07 0.05 0.03 25.4 502.8 11.6 255.6 8.6 21.8 2.5 10.6 3.8<br />
J R 62 0.01 1.98 0.01 0.34 0.11 0.09 0.07 0.05 0.03 29.0 468.2 10.3 288.0 9.9 22.1 2.9 13.0 1.8<br />
N C 64 0.01 1.90 0.01 0.31 0.11 0.09 0.07 0.05 0.03 22.9 446.4 11.8 223.1 8.0 19.6 2.6 12.5 4.5<br />
N R 61 0.01 1.99 0.01 0.34 0.11 0.09 0.07 0.05 0.03 49.8 523.2 23.8 382.6 14.4 32.1 3.8 23.4 7.1<br />
O C 67 0.01 1.83 0.01 0.29 0.10 0.09 0.07 0.05 0.03 27.3 478.7 15.2 240.9 8.1 20.3 2.1 12.6 3.3<br />
O I 67 0.01 1.83 0.01 0.29 0.10 0.09 0.07 0.05 0.03 35.0 509.5 12.3 318.2 9.2 22.0 2.8 13.7 3.1<br />
O I 57 0.01 2.12 0.01 0.40 0.11 0.09 0.07 0.05 0.03 41.8 426.6 11.0 229.6 8.6 23.9 3.1 15.7 3.4<br />
O I 62 0.01 1.97 0.01 0.34 0.11 0.09 0.07 0.05 0.03 40.9 498.4 11.3 342.0 11.9 26.6 2.9 17.8 6.9<br />
O R 54 0.01 2.23 0.01 0.44 0.11 0.09 0.07 0.05 0.03 55.1 411.6 14.8 282.2 10.7 24.2 3.0 14.4 5.6<br />
D C 67 0.01 1.82 0.01 0.28 0.10 0.09 0.07 0.05 0.03 16.0 510.6 14.8 241.2 8.4 19.5 2.6 14.4 3.9<br />
D R 64 0.01 1.93 0.01 0.32 0.11 0.09 0.07 0.05 0.03 29.6 470.3 13.4 220.0 8.4 17.9 2.4 10.6 3.3<br />
A C 63 0.01 1.95 0.01 0.33 0.11 0.09 0.07 0.05 0.03 31.1 485.4 9.3 232.3 8.2 21.2 2.7 12.1 3.2<br />
A I 64 0.01 1.93 0.01 0.32 0.11 0.09 0.07 0.05 0.03 34.0 482.2 10.4 259.1 7.8 23.9 2.9 12.2 2.4<br />
A I 64 0.01 1.92 0.01 0.32 0.11 0.09 0.07 0.05 0.03 30.9 491.7 13.2 252.5 8.3 24.0 3.2 13.8 3.3<br />
A R 64 0.01 1.91 0.01 0.32 0.11 0.09 0.07 0.05 0.03 28.2 437.0 11.9 229.7 7.0 20.8 2.2 11.4 4.0<br />
C C 71 0.01 1.70 0.01 0.25 0.10 0.09 0.07 0.05 0.03 24.5 554.3 24.5 357.9 10.2 25.9 3.1 16.1 2.8<br />
C I 66 0.01 1.85 0.01 0.30 0.10 0.09 0.07 0.05 0.03 27.0 487.4 17.0 250.3 9.4 21.5 2.6 14.6 3.6<br />
C R 59 0.01 2.06 0.01 0.37 0.11 0.09 0.07 0.05 0.03 50.1 439.3 9.9 261.6 9.4 23.4 3.1 11.9 2.6<br />
1 C = core; I = Intermediate Zone; R = rim<br />
2 [An = Ca / (Ca+Na+K)]*100
205<br />
TABLE 4.5<br />
UNIT 10 PLAGIOCLASE PARTITION COEFFICIENTS <strong>AND</strong><br />
INFERRED PARENT MAGMA COMPOSITIONS<br />
Sample Zone An DRb DSr DY DBa DLa DCe DP r DNd DSm Rb Sr Y Ba La Ce Pr Nd Sm<br />
(mol%)<br />
10-1C-A C 60 0.01 2.02 0.01 0.36 0.11 0.09 0.07 0.05 0.03 58.3 426.8 10.3 372.3 10.3 28.5 3.2 16 4.5<br />
10-1C-A I 65 0.01 1.9 0.01 0.31 0.11 0.09 0.07 0.05 0.03 53.9 469.3 14.5 340.4 10.3 25.8 3 14.8 5<br />
10-1C-A I 62 0.01 1.96 0.01 0.33 0.11 0.09 0.07 0.05 0.03 67.3 464.7 13.9 424.3 11 29.1 3.5 16.7 5<br />
10-1C-A R 66 0.01 1.86 0.01 0.3 0.1 0.09 0.07 0.05 0.03 47 449.3 14.1 324.2 9.8 24.5 2.8 13.4 2.7<br />
10-1C-B1 C 65 0.01 1.87 0.01 0.3 0.11 0.09 0.07 0.05 0.03 58.8 478.1 14.8 468.9 11 32.7 3.9 18.6 4.3<br />
10-1C-B1 I 61 0.01 1.99 0.01 0.35 0.11 0.09 0.07 0.05 0.03 82.2 455.2 19.6 426 11.6 32.3 3.3 18.6 4.7<br />
10-1C-B1 I 65 0.01 1.87 0.01 0.3 0.11 0.09 0.07 0.05 0.03 43.8 452.4 10.9 370.8 10.2 30.1 3.2 15.4 5<br />
10-1C-B1 I 64 0.01 1.9 0.01 0.31 0.11 0.09 0.07 0.05 0.03 47.9 422.7 16.2 351 9.5 27.5 2.9 16 4.3<br />
10-1C-B1 R 66 0.01 1.84 0.01 0.29 0.1 0.09 0.07 0.05 0.03 40.9 460 12.4 378.9 10.2 29.9 3.2 16.4 2.8<br />
10-1C-B2 C 58 0.01 2.08 0.01 0.38 0.11 0.09 0.07 0.05 0.03 91.4 438.6 22.5 395.9 13 35.4 4.2 17.9 5.4<br />
10-1C-B2 I 64 0.01 1.92 0.01 0.32 0.11 0.09 0.07 0.05 0.03 49.1 419.1 14.8 327 9.9 29 3.3 17.1 3.9<br />
10-1C-B2 I 62 0.01 1.98 0.01 0.34 0.11 0.09 0.07 0.05 0.03 42.4 404.2 14.5 330.6 10 28.3 3.3 15.1 3.9<br />
10-1C-B2 R 59 0.01 2.07 0.01 0.38 0.11 0.09 0.07 0.05 0.03 72.5 392.3 14.1 299.2 9.6 25.2 3.1 13.2 2.9<br />
10-2A-D C 59 0.01 2.06 0.01 0.37 0.11 0.09 0.07 0.05 0.03 54.8 430.1 22.3 341.5 12.6 25.8 3.4 16.8 6.3<br />
10-2A-D R 67 0.01 1.84 0.01 0.29 0.1 0.09 0.07 0.05 0.03 41 422.8 24.6 290.8 11.6 21.4 2.8 14 3.8<br />
10-2A-C C 58 0.01 2.1 0.01 0.39 0.11 0.09 0.07 0.05 0.03 58.4 411.2 18.5 309.7 12.7 25.1 3.6 18.2 6<br />
10-2A-C I 62 0.01 1.97 0.01 0.34 0.11 0.09 0.07 0.05 0.03 71.7 476.8 22.3 409.2 13.6 27.1 3.9 16.4 4.4<br />
10-2A-C I 67 0.01 1.82 0.01 0.29 0.1 0.09 0.07 0.05 0.03 31.7 423.5 18.6 293.8 10.7 23 3.3 15.1 4<br />
10-2A-C R 65 0.01 1.87 0.01 0.3 0.11 0.09 0.07 0.05 0.03 39.7 451.6 21.5 333.9 12.4 24.3 3.4 15.2 5<br />
10-1C-D C 63 0.01 1.94 0.01 0.33 0.11 0.09 0.07 0.05 0.03 47.4 413.4 17 349.3 9.1 26.2 3 14.6 3.3<br />
10-1C-D I 60 0.01 2.05 0.01 0.37 0.11 0.09 0.07 0.05 0.03 63 391 7.7 396.3 10.1 28.8 2.9 11.4 3.1<br />
10-1C-D I 63 0.01 1.95 0.01 0.33 0.11 0.09 0.07 0.05 0.03 68.2 409.4 16.9 427.6 9.9 27.7 3.1 13.3 3.3<br />
10-1C-D I 59 0.01 2.06 0.01 0.37 0.11 0.09 0.07 0.05 0.03 71 409.6 9.5 382.2 9.8 29.3 3.4 18.2 3.8<br />
10-1C-D R 62 0.01 1.98 0.01 0.34 0.11 0.09 0.07 0.05 0.03 43 396.3 15 347.7 9.7 27.5 3.3 14.1 3<br />
10-1D-A I 57 0.01 2.12 0.01 0.4 0.11 0.09 0.07 0.05 0.03 52.9 376.3 12.6 305.4 9.9 26.9 3.2 12 4.6<br />
10-1D-A I 57 0.01 2.11 0.01 0.39 0.11 0.09 0.07 0.05 0.03 64.4 385.6 11.5 359.9 9.4 26.9 3.4 13 1.8<br />
10-1D-A R 66 0.01 1.85 0.01 0.3 0.1 0.09 0.07 0.05 0.03 46 449.6 12.4 399.5 9.7 29.2 3.7 12.9 4.3<br />
1 C = core; I = Intermediate Zone; R = rim<br />
2 [An = Ca / (Ca+Na+K)]*100
4.5 Discussion<br />
4.5.0.1 Origin of Major Element Zoning and Resorption Surfaces<br />
Abrupt changes of 5 to > 10 mole % An and the presence of resorption sur-<br />
faces amongst Unit 4 and 10 plagioclase phenocrysts indicates these crystals were<br />
variably exposed to magmas with which they were at a state of disequilibrium<br />
(e.g., Fig. 4.6, 4.7, Fig. 4.8, Fig. 4.9, Fig. 4.10). Injection of hot fresh magma<br />
into a crystallizing magma chamber can lead to partial resorption and subsequent<br />
growth of higher An zones, which is a feature that was noted for select crystals<br />
from each Unit (e.g., Fig. 4.6a,e,f,p, Fig. 4.7). An alternative scenario is that mo-<br />
bilization of crystals from mush piles within the magma chamber by convective<br />
overturn, avalanches of wall and roof debris, or magmatic stirring generated these<br />
features [83, 98]. Crystals growing in such mush layers are thermally and me-<br />
chanically insulated from the hottest portions of the magma chamber and can be<br />
out of equilibrium with magma in the chamber interior. Either of these processes<br />
may have operated to generate some or all of the observed dissolution and zoning<br />
patterns in Unit 4 and 10 plagioclase crystals. There are, however, systematic<br />
differences in the dominant zoning patterns between the Unit 4 and 10 basalt<br />
samples examined in this study.<br />
The Unit 4 basalt examined in this study contains a fairly even mixture or<br />
normal and reverse zoned crystals, which is a first order indication that crystals<br />
from different portions of the magmatic system were entrained during or before<br />
eruption. Deposition of plagioclase-rich crystal debris at one or more locations<br />
(walls, floors, etc.) in the magmatic system prior to eruption of the Unit 4 basalt<br />
is supported by the presence of plagioclase glomerocrysts, where after deposition<br />
the crystals were partially compacted to later be mobilized as cognate clusters of<br />
206
crystals (glomerocrysts: Fig. 4.4a). Despite the presence of glomerocrysts, most<br />
Unit 4 plagioclase crystals are present as individual euhedral crystals. I suggest<br />
that the normal zoned plagioclase phenocrysts bear a close genetic relationship<br />
with the Unit 4 host basalt, whereas the reverse zoned crystals likely come from<br />
disaggregated glomerocrysts that crystallized earlier and under different condi-<br />
tions. The mixture of normal and reverse zoned crystals indicates that plagioclase<br />
crystals were recycled throughout the magmatic system during the petrogenesis<br />
of the Unit 4 basalt, which is significant in that the plagioclase crystals provide a<br />
greater temporal record of magma evolution.<br />
The majority of the plagioclase phenocrysts in the Unit 10 basalt examined in<br />
this study exhibit reverse zonation, which indicates they may have initially grown<br />
from a more evolved and/or crustally contaminated magma then exposed to a more<br />
primitive magma just before or during eruption. A significant fraction of the large<br />
plagioclase phenocrysts in the Unit 10 basalt sample examined in this study are<br />
present within glomerocrysts (Fig. 4.4b). Individual Unit 10 plagioclase crystals<br />
not present in glomerocrysts are generally sub-rounded and are probably from<br />
disaggregated glomerocrysts. I suggest that a large amount of mushy plagioclase<br />
dominated crystal debris was entrained prior to and during eruption of the Unit<br />
10 basalt and is the primary source of plagioclase phenocrysts in this basalt.<br />
Trace element and Sr isotope data provide a greater insight into these processes<br />
and whether early formed Unit 4 and 10 crystals provide insight into temporal<br />
variations in crustal assimilation.<br />
207
4.5.0.2 Insights from Trace Elements and Inverted Parent Magma Compositions<br />
Plagioclase parent magmas from Units 4 and 10 overlap whole-rock fields de-<br />
fined by their respective Site 1137 upper and lower basalt groups in Ba/Sr vs Rb<br />
space (Fig. 4.14). Whole-rock compositions tend to represent an integration of<br />
all of the subsurface processes that were active during basalt petrogenesis, and a<br />
number of studies have noted greater records of processes such as crustal assim-<br />
ilation and exposure to primitive magmas within individual plagioclase crystals<br />
[37, 135]. Although major element and zoning data indicate that the plagioclase<br />
phenocrysts contain greater temporal records of magma evolution relative to the<br />
whole-rock chemistry, this overlap in figure 4.14a indicates that peak crustal con-<br />
tamination present in Units 4 and 10 pre-dated plagioclase crystallization.<br />
Plagioclase parent magmas trend to lower La/Sm relative to their respective<br />
host basalt groups (Fig. 4.14c), and inverted parent magma trace element and<br />
REE abundances are generally lower than those of Site 1137 upper and lower group<br />
basalts (Table 4.4 and Table 4.5). Low trace element abundances of plagioclase<br />
parent magmas may indicate that plagioclase crystals grew from magmas that<br />
were more depleted than their host basalts. This however seems unlikely given<br />
the regular occurrence of reversely zoned plagioclase crystals in each basalt and the<br />
overlap in figure 4.14a. An alternative origin for the low trace element abundances<br />
of plagioclase parent magmas is the use of inaccurate partition coefficients and/or<br />
trace element diffusion. It is difficult to gauge the accuracy of calculated partition<br />
coefficients, but Bindeman et al. [7] and Blundy and Wood [10] pointed out that<br />
An content is a dominant factor that affects cation substitution in plagioclase<br />
and temperature has a minor affect. Although An variations and crystallization<br />
temperatures are accounted for in partition coefficient calculations, it is possible<br />
208
Ba/Sr<br />
Ba/Sr<br />
La/Sm<br />
1.20<br />
1.00<br />
0.80<br />
0.60<br />
0.40<br />
0.20<br />
1.20<br />
1.00<br />
0.80<br />
0.60<br />
0.40<br />
0.20<br />
7.00<br />
6.00<br />
5.00<br />
4.00<br />
3.00<br />
2.00<br />
1.00<br />
Unit 4 cores<br />
Unit 4 interm. zones<br />
Unit 4 rims<br />
Unit 10 cores<br />
Unit 10 interm. zones<br />
Unit 10 rims<br />
Site 1137 LG basalts<br />
Site 1137 UG basalts<br />
20 40 60 80 100 120<br />
Rb<br />
Unit 4 cores<br />
Unit 4 interm. zones<br />
Unit 4 rims<br />
Unit 10 cores<br />
Unit 10 interm. zones<br />
Unit 10 rims<br />
Site 1137 LG basalts<br />
Site 1137 UG basalts<br />
0.7045 0.705 0.7055 0.706 0.7065<br />
Unit 4 cores<br />
Unit 4 interm. zones<br />
Unit 4 rims<br />
Unit 10 cores<br />
Unit 10 interm. zones<br />
Unit 10 rims<br />
Site 1137 LG basalts<br />
Site 1137 UG basalts<br />
87 Sr/ 86 SrI<br />
0.7045 0.705 0.7055 0.706 0.7065<br />
87 Sr/ 86 SrI<br />
Figure 4.14. A) Inverted Unit 4 and 10 plagioclase parent magmas of<br />
overlap fields defined by whole-rock data for Site 1137 upper and lower group<br />
basalts. B) Inverted Unit 4 and 10 plagioclase parent magma Ba/Sr versus<br />
87 Sr/ 86 SrI and Site 1137 basalt fields drawn using whole-rock data. C)<br />
Inverted Unit 4 and 10 plagioclase parent magma La/Sm versus 87 Sr/ 86 SrI<br />
and Site 1137 basalt fields drawn using whole-rock data reported by [74].<br />
Plagioclase parent magma compositions overlap whole-rock basalt field well<br />
in terms of 87 Sr/ 86 SrI but below or above whole-rock fields. The origin of<br />
this anomaly is discussed in the text.<br />
209
that other factors influenced the accuracy of calculated D values. For example,<br />
Ba and Sr D values are probably the best constrained because they have been the<br />
focus of more partitioning studies than lower abundance elements like the REE<br />
(e.g., [7, 10]. My estimate of the trivalent strain-free partition coefficient (D +3<br />
0 ;<br />
c.f., [11]) is poorly constrained. A D +3<br />
0 that is too low would lead to systematically<br />
low estimates of Y and the REE (i.e., Table 4.4 and Table 4.5; Fig. 4.14c).<br />
Trace element diffusion may have also played a role in generating the impres-<br />
sion of low trace element and REE abundances in plagioclase parent magmas.<br />
This possibility is explored in the next section.<br />
4.5.0.3 Diffusive Redistribution of Trace Elements<br />
Cherniak [27] and Cherniak and Watson [24] noted that at magmatic tem-<br />
peratures divalent cations diffuse faster through the plagioclase structure than<br />
trivalent cations. They also noted that diffusion occurs slower in An-richer pla-<br />
gioclase. Given the intermediate An contents (∼ An54−71) of crystals examined<br />
in this study, the possibility of trace element re-distribution via diffusion is rela-<br />
tively high. Zellmer et al. [145] presented a test for diffusive equilibrium, which<br />
as they noted does not lead to a flat compositional profile, but rather a profile<br />
that mirrors the variation in trace element D values most heavily influenced by<br />
An content. Equation 4.3 is a adaption of equation 2 of Zellmer et al. [145] that<br />
describes partitioning of a trace element (n) between plagioclase compositions A<br />
and B.<br />
D A/B<br />
n = CA n /CB n = DA n /DB n (4.3)<br />
210
When diffusive equilibrium has been reached between two adjacent plagioclase<br />
zones with An contents A and B the condition in equation 4.4 is met.<br />
C A/B<br />
n /D A/B<br />
n = 1 (4.4)<br />
This test was applied to each plagioclase crystal examined in this study for Sr<br />
and La at texturally distinct transitions between intermediate zones and crystal<br />
rims (Fig. 4.15). In case of Unit 4 crystal P, where an intermediate zone to rim<br />
transition examination was not possible, a core-intermediate zone transition was<br />
tested. The partition coefficient values listed in tables 4.4 and 4.5 were used for<br />
the test. Two of the ten Unit 4 crystals (Q and P) are within error of the Sr<br />
diffusive equilibrium line (i.e., equation 4.4; Fig. 4.15a), whereas only one Unit 4<br />
crystal (P) is within error of the La diffusive equilibrium line (Fig. 4.15c). These<br />
observations are consistent with the findings of Cherniak [27] that trivalent REE<br />
diffuse slower in plagioclase than divalent cations like Sr.<br />
Six of the seven Unit 10 crystals are within error of the Sr diffusive equilib-<br />
rium line (Fig. 4.15b), whereas five of the seven crystals are within error of the<br />
La diffusive equilibrium line (Fig. 4.15d). The greater proportion of diffusively<br />
re-equilibrated plagioclase crystals in the Unit 10 basalt qualitatively suggests<br />
that relative to the Unit 4 crystals, Unit 10 crystals were held at magmatic tem-<br />
peratures for greater periods of time based upon the fact that diffusion occurs<br />
more rapidly when crystals are held at magmatic temperatures (i.e., [27]). This<br />
consistent with the working hypothesis that the majority of the Unit 4 plagioclase<br />
phenocrysts bear a close genetic relationship with their host basalt, and the ma-<br />
jority of the Unit 10 crystals were stirred up from a cumulate layer or other mush<br />
pile.<br />
211
C A/B / D A/B<br />
C A/B / D A/B<br />
Unit 4 O<br />
A)<br />
K<br />
10-1D-A<br />
L<br />
Unit 10 B)<br />
10-1C-A<br />
Q<br />
10-1C-B1<br />
P<br />
10-1C-B2<br />
J<br />
10-2A-C<br />
N<br />
10-1C-D<br />
10-2A-D<br />
D<br />
A C<br />
Sr<br />
Sr<br />
Figure 4.15. A) Two of ten Unit 4 crystals are within analytical<br />
uncertainty (the propagated 2σ error when values are divided, e.g.,<br />
Sr/Sr) of having reached Sr diffusive equilibrium, whereas one of ten<br />
have reached C) La diffusive equilibrium. The diffusive equilibrium is<br />
drawn based upon equation 4.4. B) Six of seven Unit 10 phenocrysts<br />
are within error of having reached Sr diffusive equilibrium, whereas five<br />
of seven crystal are within error of the La diffusive equilibrium line.<br />
These results indicate La diffuses slower than Sr, which is consistent<br />
with the findings of [27].<br />
212<br />
K<br />
10-1D-A<br />
L<br />
10-1C-A<br />
Q<br />
10-1C-B1<br />
P<br />
10-1C-B2<br />
J<br />
10-2A-C<br />
N<br />
10-1C-D<br />
O<br />
10-2A-D<br />
D<br />
A<br />
C<br />
La<br />
La<br />
C)
4.5.0.4 Petrogenetic Insights from Plagioclase 87 Sr/ 86 SrI Ratios and the Timing<br />
of Crustal Contamination at Elan Bank<br />
Plagioclase crystals from Units 4 and 10 exhibit narrow ranges of 87 Sr/ 86 SrI<br />
that overlap their respective Site 1137 upper and lower group basalts reported<br />
by Ingle et al. [75], which indicates that crustal assimilation was not an ongoing<br />
process during plagioclase dominated partial crystallization. Crustal rocks (e.g.,<br />
garnet biotite gneiss clasts) recovered during drilling at Site 1137 are plausible<br />
crustal assimilants and have distinctly radiogenic 87 Sr/ 86 SrI (> 0.784) [74]. If<br />
these in fact were the types of crustal rocks assimilated, as favored by Ingle [75],<br />
assimilation must have occurred prior to plagioclase dominated partial crystal-<br />
lization. Core, intermediate zone, and rim 87 Sr/ 86 SrI variations are subtle, which<br />
indicates that the Unit 4 and 10 plagioclase crystals grew from already contami-<br />
nated parent magmas. This may also suggest that over time the magma chamber<br />
walls became well armored, which minimized late stage pulses of greater crustal<br />
assimilation.<br />
4.5.0.5 Where Did Plagioclase Dominated Partial Crystallization Occur?<br />
In their study of Kerguelen Archipelago lavas Damasceno et al. [36] sug-<br />
gested that basalts that make up the Mont Crozier section passed through a<br />
magmatic system that consisted of a complex arrangement interconnected con-<br />
duits and chambers. They suggested that plagioclase-dominated partial crystal-<br />
lization occurred primarily in shallow sub-volcanic magma reservoirs [36]. Elan<br />
Bank magmas passed through a section of crust with both oceanic and continental<br />
components (versus oceanic crust for Mont Crozier magmas) [36], and it is thus<br />
probable Elan Bank magmas passed through similarly complex magmatic system.<br />
213
Magma chambers tend to form at horizons of neutral buoyancy, and the depth<br />
of the neutral buoyancy zone is closely linked to the density of the surrounding<br />
country rock [122]. Continental crust is seldom lithologically uniform on a vertical<br />
scale, and the formation of multiple magma chambers over time at different hori-<br />
zons of neutral buoyancy is more probable within continental crust versus oceanic<br />
crust. Indeed, Marsh [100] discussed such a magmatic system consisting of inter-<br />
connected dikes and sills similar to the system inferred for Kerguelen Archipelago<br />
by Damasceno et al. [36] that penetrated through Gondwanan crust in nearby<br />
Antarctica [35], which he referred to as the Ferrar magmatic mush column. Marsh<br />
[100] cited evidence of kinetic sieving and flow sorting of plagioclase and orthopy-<br />
roxene which lead to segments of the magma chamber system to be filled with<br />
large volumes of these minerals.<br />
4.6 Summary and Conclusions<br />
I propose that, much like the Ferrar magmatic mush column and Kergue-<br />
len Archipelago examples, the magma chamber system below Elan Bank was a<br />
complex system of interconnected dikes and sills. I suggest that the abundant<br />
plagioclase phenocrysts In the Unit 4 and 10 basalts originated from the shal-<br />
lowest magma chambers within this system where crustal contamination was an<br />
insignificant process. Crustal assimilation was most prominent during the initial<br />
emplacement of basaltic magma into Elan Bank crust, and variations in the crustal<br />
contamination signature over time may be as much linked to re-mobilization and<br />
partial resorption of crystal mush material formed directly following initial Elan<br />
Bank magma emplacement as progressive erosion of crustal wall rock by repeated<br />
injection of hot and primitive magmas into Elan Bank magma chambers.<br />
214
CHAPTER 5<br />
SUMMARY, CONCLUSIONS, <strong>AND</strong> FUTURE WORK<br />
5.1 Results and Conclusions<br />
5.1.1 The Ontong Java Plateau<br />
This research focused upon understanding the physical processes (i.e., magma<br />
chamber dynamics) of differentiation that led to the repeated production of the<br />
same basalt type (Kwaimbaita basalt) over a Greenland-size geographic area?<br />
Plagioclase-rich cumulate xenoliths consisting of An-rich (up to An86) plagioclase<br />
crystals from provide insight into these processes beyond what has been learned<br />
from whole-rock studies alone. Anorthie-rich sections of cumulate xenolith crystals<br />
and phenocrysts in host basalts were formed primarily by crystallization in shal-<br />
low (low pressure, 2-7 km depth) regions of the OJP magma chamber system from<br />
more primitive magmas than those basalts sampled from the OJP that were low in<br />
H2O and at relatively high temperature (liquidus temperature near 1200 ◦ C). Evi-<br />
dence from this work shows that the role of H2O-rich evolved boundary layer inter-<br />
stitial melts in the formation of An-rich plagioclase was, at best, minor. This is in<br />
contrast the interpretations of a significant role for water by Sano and Yamashita<br />
[123], which was based upon plagioclase major element observations. Parent liquid<br />
compositions derived from OJP xenolith and phenocryst plagioclase crystals con-<br />
tain a wider compositional record of magma evolution than that revealed by OJP<br />
215
whole-rock basalt data. Cumulate xenoliths and phenocrysts generally are pieces<br />
of disrupted solidification fronts. Solidification fronts would have been ubiquitous<br />
throughout the OJP magma chamber system. The OJP magma chamber system<br />
was composed of interconnected dikes and sills and consisted of regions dominated<br />
by liquid (magma chamber interior) and regions dominated by crystal-liquid mush<br />
(along magma chamber floors and walls, within dikes and conduits). Crystals and<br />
crystalline debris were extensively recycled throughout the OJP magma chamber<br />
system. This recycling accounts for the wide compositional spectrum of magmas<br />
parental to plagioclase xenolith crystals and phenocrysts with An content out of<br />
equilibrium with their Kwaimbaita host basalts. Ironically, this process also ac-<br />
counts for the dominance of a single magma composition erupted on to the OJP,<br />
as it represents the homogenized body of magma in the main part of the up-<br />
per chamber. The compositions of melts periodically flushed from the interstices<br />
of the crystal-mush network were affected by their residence times in the mush.<br />
Depending upon the extent of the crystal-rich portions of the magma chamber<br />
system, residence time may have had a large effect on overall basalt chemistry.<br />
The shallow crustal OJP magma chamber system corresponded with a zone of<br />
neutral buoyancy in the 0-7 km depth range, as in other volcanic systems [122].<br />
As OJP volcanism progressed the plateau gained elevation, and the zone of neutral<br />
buoyancy gradually migrated upward leading to slow yet pervasive assimilation of<br />
overlying seawater altered basalt.<br />
The greatest diversity of OJP basalts is along the margins of the plateau<br />
where it is thinner. During formation, magmas ascending into the marginal and<br />
thinner magma chamber system around the plateau margins were subject to less<br />
density filtration, which allowed ascent and eruption of relatively dense Kroenke<br />
216
magmas and slightly less dense Singgalo magmas (see Fig. 2.1 for magma types and<br />
distribution across the OJP). Slight variations in paths of magma ascent, depths<br />
of magma pooling and crystallization, as well as rates and amounts of assimilation<br />
of seawater altered basalt would have affected the isotopic and incompatible trace<br />
element characteristics of known OJP basalts. I suggest that these physical factors<br />
may account for both the homogeneity of basalts in the central portion of the OJP<br />
and the relative heterogeneity of basalts around the plateau margin.<br />
5.1.2 Detroit Seamount, Emperor Seamount Chain<br />
A key objective of this study was to elucidate the roles that shallow magmatic<br />
processes played during the petrogenesis of depleted hotspot basalts at Detroit<br />
Seamount when the Hawaiian hotspot was near a mid-ocean ridge [34]. I employed<br />
an integrated approach to understand the physical growth histories and chemical<br />
provenance of plagioclase crystals in four pillow basalts from Detroit Seamount.<br />
This was done by using plagioclase crystal size distributions to identify unique<br />
crystal populations and compositional microanalysis to better under stand their<br />
origins.<br />
I suggest that the Detroit Seamount magma chamber system was complex and<br />
consisted of extensive mush zones and multiple interconnected chambers. There is<br />
an undeniable role for plagioclase fractionation and accumulation in the petrogen-<br />
esis of Detroit Seamount tholeiitic basalts. Evidence of mixing between relatively<br />
depleted and enriched end-member magmas recorded in the hybrid Unit 14 basalt<br />
do not contradict existing models seeking to explain the origin of the depleted<br />
component in Detroit Seamount basalts. Unit 14 magma mixing does suggest,<br />
however, that subtle variations in partial melting or source compositions do occur<br />
217
over short time spans but may be easily overlooked in whole-rock compositional<br />
studies. I suggest this variation is consistent with subtle variations in partial<br />
melting of a heterogeneous mantle source that consisted of relatively depleted<br />
and relatively enriched components (c.f., [50, 72, 119]) Subtle variations in partial<br />
melting are consistent with enhanced mantle flow and complex mantle dynamics<br />
in the near ridge hotspot environment as discussed by Pearce [114]. The nature<br />
of the depleted component in Detroit Seamount basalts is prominent in tholei-<br />
itic basalts from Site 884, and perhaps most prominent in the cm-size plagioclase<br />
phenocrysts. These large crystals have low Sr parent magmas suggesting they<br />
were less evolved than their host basalt. A fruitful continuation of this research<br />
would be to conduct Sr and Pb isotope studies on these large crystals by in-situ<br />
microdrilling (e.g., [39]) or plagioclase separation (e.g., [16]).<br />
5.1.3 Elan Bank, Kerguelen Plateau<br />
The main objective of this study was to elucidate the timing and dynamics of<br />
crustal contamination of a basaltic magma. This was done via a compositional mi-<br />
croanalytical dissection of plagioclase phenocrysts in two Elan Bank basaltic lavas<br />
- one contaminated with crust (Unit 10), and the other relatively uncontaminated<br />
(Unit 4; as reported by [75]).<br />
Plagioclase crystals from Units 4 and 10 exhibit narrow ranges of 87 Sr/ 86 SrI<br />
that overlap their respective Site 1137 upper and lower group basalts reported<br />
by Ingle et al. [75], which indicates that crustal assimilation was not an ongoing<br />
process during plagioclase dominated partial crystallization. Crustal rocks (garnet<br />
biotite gneiss clasts) recovered during drilling at Site 1137 are plausible crustal<br />
assimilants and have distinctly radiogenic 87 Sr/ 86 SrI (> 0.784) [74]. If these in fact<br />
218
were the types of crustal rocks assimilated, as favored by Ingle [75], assimilation<br />
must have occurred prior to plagioclase dominated partial crystallization. Core,<br />
intermediate zone, and rim 87 Sr/ 86 SrI variations are subtle, which indicates that<br />
the Unit 4 and 10 plagioclase crystals grew from already contaminated parent<br />
magmas. This may also suggest that over time the magmatic system became well<br />
buffered, which minimized late stage pulses of greater crustal assimilation.<br />
Inverted parent magma compositions from both Units 4 and 10 are offset from<br />
ranges of trace and REE abundances of their respective whole-rock basalt groups.<br />
This indicates either poor choices of partition coefficients and/or that diffusion<br />
of trace elements occurred within Unit 4 and 10 plagioclase crystals. Indeed, a<br />
greater proportion of crystals from the Unit 10 basalt are diffusively re-equilibrated<br />
relative to the Unit 4 crystals. This indicates that Unit 10 crystals were held at<br />
magmatic temperatures for greater periods of time. This consistent with the<br />
working hypothesis that the majority of the Unit 4 plagioclase phenocrysts bear<br />
a close genetic relationship with their host basalt, and the majority of the Unit<br />
10 crystals were stirred up from a cumulate layer or other mush pile.<br />
I propose that, much like the Ferrar magmatic mush column and Kerguelen<br />
Archipelago examples, the magma chamber system below Elan Bank was a com-<br />
plex system of interconnected dikes and sills (c.f., [36, 100]. I suggest that the<br />
abundant plagioclase phenocrysts In the Unit 4 and 10 basalts originated from<br />
the shallowest magma chambers within this system where crustal contamination<br />
was an insignificant process. Crustal assimilation was most prominent during<br />
the initial emplacement of basaltic magma into Elan Bank crust, and variations<br />
in the crustal contamination signature over time may be as much linked to re-<br />
mobilization and partial resorption of crystal mush material formed directly fol-<br />
219
lowing initial Elan Bank magma emplacement as progressive erosion of crustal wall<br />
rock by repeated injection of hot and primitive magmas into Elan Bank magma<br />
chambers.<br />
5.2 Recommendations for Future Work<br />
Once one embarks upon the type of work detailed in this dissertation it does<br />
not take one long to make the realization that igneous rocks (and thus igneous<br />
systems) are far more complex than they are commonly modeled. The notion<br />
that mantle source characteristics are preserved in magmas from mantle to erup-<br />
tion indeed may be true in some settings, but there is overwhelming evidence<br />
that magma chamber systems are complex, ubiquitous, and tend to buffer the<br />
compositions erupted magmas (e.g., [100]. Indeed, this level of magma chamber<br />
complexity is apparent in the three studies described in this dissertation. The im-<br />
portance of bulk-rock compositional studies should not be understated, however<br />
an entire new level of insight into the genesis, evolution, and eruption of magmas<br />
is on the horizon thanks to technological advances that make it possible conduct<br />
accurate and precise compositional studies on the smallest of samples. Innovative<br />
implementations of the new and advanced microanalytical techniques will bring<br />
about a paradigm shift in igneous petrology and volcanology.<br />
With increased use of techniques such as LA-ICP-MS to measure low abun-<br />
dance elements within minerals comes an increased need for accurate partition<br />
coefficients. More accurate partition coefficients will improve estimates of parent<br />
magma compositions inverted from minerals such as plagioclase and will improve<br />
the accuracy of trace element diffusion calculations within minerals, which has<br />
proven a useful way to estimate magmatic residence time [145]. In plagioclase<br />
220
trivalent REE diffuse slower that the more abundant divalent cations (i.e., Sr and<br />
Ba). This indicates that investigation of REE diffusion in plagioclase may provide<br />
a more extensive time record of magmatic residence.<br />
Although plagioclase trace element studies have proven to be useful, perhaps<br />
the most robust future petrologic insights will come from intramineral isotope<br />
studies beyond Sr (including Pb, Sm-Nd for example). Mineral scale isotope<br />
studies are limited by the amount of the element of interest in the mineral. For<br />
example, the greater abundance of Sr in plagioclase versus clinopyroxene makes<br />
Sr isotope microanalysis of plagioclase much less difficult. Improvement of ion-<br />
ization efficiency in TIMS analysis can help alleviate some of this problem (e.g.,<br />
discussion in [40]), as can instrumentation advances that improve signal intensity<br />
at a given concentration (e.g., guard electrodes). One of the difficulties faced<br />
with a microdrill-TIMS approach is the high incidence of fracturing, flaking, and<br />
inadvertent sampling of undesired zones. Perhaps one of the surest ways to im-<br />
prove the controlled removal of mineral material for isotopic analysis is through<br />
the use of laser ablation [40]. Laser ablation based isotopic studies generally re-<br />
quires interfacing the LA system with a multicollector ICP-MS. The use of a Ar<br />
based plasma introduces a host of issues and interferences not encountered with<br />
TIMS. For example Ar used in ICP-MS commonly contains trace Kr, of which 86 Kr<br />
(17.37% abundance) represents a particularly problematic polybaric interference.<br />
At present a variety of corrections are necessary to obtain close to meanigful<br />
87 Sr/ 86 Srm by MC-LA-ICP-MS. If mineral standards were available for isotopic<br />
analyses, quality control of MC-LA-ICP-MS work would be more straightforward.<br />
221
BIBLIOGRAPHY<br />
1. C. Allegre, A. Provost and C. Jaupart, Oscillatory zoning: a pathological<br />
case of crystal growth. Nature, 294: 223–228 (1981).<br />
2. P. Asimow and M. Ghiorso, Algorithmic modifications extending MELTS to<br />
calculate subsolidus phase relations. American Mineralogist, 83(1127-1131)<br />
(1998).<br />
3. K. Bartels, R. Kinzler and T. G. and, High pressure phase relations of primitive<br />
high-alumina basalts from Medicine Lake volcano, northern California.<br />
Contributions to Mineralogy and Petrology, 108: 253–270 (1991).<br />
4. G. Bergantz, Melt fraction diagrams: the link between chemical and transport<br />
models. In J. Nicholls and J. Russell, editors, Modern methods of igneous<br />
petrology: Understanding magmatic processes, volume 24 of Reviews in Mineralogy,<br />
pages 239–258, Mineralogical Society of America (1990).<br />
5. I. Bindeman and J. Bailey, Trace elements in anorthite megacrysts from the<br />
Kurile Island Arc: A window to across-arc geochemical variations in magma<br />
compositions. Earth and Planetary Science Letters, 169: 209–226 (1999).<br />
6. I. Bindeman and A. Davis, Trace element partitioning between plagioclase<br />
and melt: Investigation of dopant influence on partition behavior. Geochimica<br />
et Cosmochimica Acta, 63: 2863–2878 (2000).<br />
7. I. Bindeman, A. Davis and M. Drake, Ion microprobe study of plagioclasebasalt<br />
partition experiments at natural concentration levels in trace elements.<br />
Geochimica et Cosmochimica Acta, 62(7): 1175–1193 (1998).<br />
8. I. Bindeman, A. Davis and S. Wickham, 400 m.y. of basic magmatism in<br />
a single lithospheric block during cratonization: ion microprobe study of<br />
plagioclase megacrysts in mafic rocks from transbaikalia, russia. Journal of<br />
Petrology, 40: 807–830 (1999).<br />
9. J. Blundy, Experimental study of a Kiglapait marginal rock and implications<br />
for trace element partitioning in layered intrusions. Chemical Geology, 141:<br />
73–92 (1997).<br />
222
10. J. Blundy and B. Wood, Crystal-chemical controls on the partitioning of<br />
Sr and Ba between plagioclase feldspar, silicate melts, and hydrothermal<br />
solutions. Geochimica et Cosmochimica Acta, 55: 193–209 (1991).<br />
11. J. Blundy and B. Wood, Prediction of crystal-melt partition coefficients.<br />
Nature, 372(1): 452–454 (1994).<br />
12. J. Blundy and B. Wood, Partitioning of trace elements between crystals and<br />
melts. Earth and Planetary Science Letters, 210: 383–397 (2003).<br />
13. J. Brady, Diffusion data for silicate minerals, glasses, and liquids. In<br />
T. Ahrens, editor, A Handbook of Physical Constants, volume 2 of Reference<br />
Shelf , pages 269–290, AGU (1995).<br />
14. A. Brandon, M. Norman, R. Walker and J. Morgan, 186 Os/ 187 Os systematics<br />
of Hawaiian picrites. Earth and Planetary Science Letters, 174: 25–42 (1999).<br />
15. J. Brice, Some thermodynamic aspects of the growth of strained crystals.<br />
Journal of Crystal Growth, 28: 249–254 (1975).<br />
16. J. Bryce and D. DePaolo, Pb isotopic heterogeneity in basaltic phenocrysts.<br />
Geochimica et Cosmochimica Acta, 68(4453-4468) (2004).<br />
17. I. Campbell and R. Griffiths, Implications of mantle plume structure for the<br />
evolution of flood basalts. Earth and Planetary Science Letters, 99: 79–93<br />
(1990).<br />
18. K. Cashman, Textural constraints on the kinetics of crystallization of igneous<br />
rocks. In J. Nicholls and J. Russell, editors, Modern Methods of Igneous<br />
Petrology, Understanding Magmatic Processes, volume 24 of Reviews<br />
in Mineralogy, pages 292–305, Mineralogical Society of America (1990).<br />
19. K. Cashman, Relationship between plagioclase crystallization and cooling<br />
rate in basaltic melts. Contributions to Mineralogy and Petrology, 113: 126–<br />
142 (1993).<br />
20. K. Cashman and B. Marsh, Crystal size distribution (CSD) in rocks and the<br />
kinetics and dynamics of crystallization II: Makaopuhi lava lake. Contributions<br />
to Mineralogy and Petrology, 99: 292–305 (1988).<br />
21. L. Chambers, M. Pringle and J. Fitton, Age and duration of magmatism<br />
on the Ontong Java Plateau: 40 Ar/ 39 Ar results from ODP Leg 192. EOS<br />
Transactions, 83: F47 (2002), Abstract V71B-1271.<br />
223
22. B. Charlier, J. Davidson, O. Bachmann and M. Dungan, Mineral-scale Sr<br />
and Pb isotopic variations as recorders of magma differentiation processes<br />
in the Fish Canyon magmatic system, San Juan Volcanic Field, U.S.A. EOS<br />
Transactions AGU, 84: V11F–05 (2003).<br />
23. B. Charlier, C. Wilson, J. Lowenstern, S. Blake, P. V. Calsteren and J. Davidson,<br />
Magma generation at a Large, Hyperactive Silicic Volcano (Taupo, New<br />
Zealand) Revealed by U-Th and U-Pb Systematics in Zircons. Journal of<br />
Petrology, 46(1): 3–32 (2005).<br />
24. D. Cherniak, A study of strontium diffusion in plagioclase using Rutherford<br />
backscattering spectroscopy. Geochimica et Cosmochimica Acta, 38: 5179–<br />
5190 (1994).<br />
25. D. Cherniak, Diffusion of lead in plagioclase and K-feldspar: an investigation<br />
using Rutherford Backscattering and resonant nuclear reaction analysis.<br />
Contributions to Mineralogy and Petrology, 120: 358–371 (1995).<br />
26. D. Cherniak, Ba diffusion in feldspar. Geochimica et Cosmochimica Acta, 66:<br />
1641–1650 (2002).<br />
27. D. Cherniak, REE diffusion in feldspar. Chemical Geology, 193: 25–41 (2003).<br />
28. D. Cherniak and E. Watson, A study of strontium diffusion in K-feldspar,<br />
Na-K feldspar and anorthite using Rutherford backscattering spectroscopy.<br />
Earth and Planetary Science Letters, 113: 411–415 (1992).<br />
29. D. Clague and G. Dalrymple, The hawaiian-emperor volcanic chain: Part I,<br />
geologic evolution. In R. Decker, T. Wright and P. Stauffer, editors, Volcanism<br />
in Hawaii, volume P 1350, pages 5–73, U.S. Geological Survey Professional<br />
Paper (1987).<br />
30. M. Coffin. Personal Communcation.<br />
31. M. Coffin and O. Eldholm, Scratching the surface: Estimating the dimensions<br />
of large igneous provinces. Geology, 21: 515–518 (1993).<br />
32. M. Coffin and O. Eldholm, Large igneous provinces: crustal structure, dimensions,<br />
and external consequences. Reviews of Geophysics, 32: 1–36 (1994).<br />
33. M. Coffin, F. Frey, P. Wallace and et al., Proceedings of the Ocean Drilling<br />
Program, Initial Reports, 183. [CD-ROM], Available from: Ocean Drilling<br />
Program, Texas A&M University, College Station TX 77845-9547, USA<br />
(2000).<br />
224
34. R. Cottrell and J. Tarduno, A Late Cretaceous pole for the Pacific plate:<br />
implications for apparent and true polar wander and the drift of hotspots.<br />
Tectonophysics, 362(321-333) (2003).<br />
35. K. Cox, Flood basalts, subduction and the breakup of gondwanaland. Nature,<br />
274: 47–49 (1978).<br />
36. D. Damasceno, J. Scoates, D. Weis, F. Frey and A. Giret, Mineral chemistry<br />
of mildly alkalic basalts from the 25 ma mont. crozier section, kerguelen<br />
archipelago: Constraints on phenocryst crystallization environments. Journal<br />
of Petrology, 43(7): 1389–1413 (2002).<br />
37. J. Davidson, J. Hora, J. Garrison and M. Dungan, Crustal forensics in arc<br />
magmas. Journal of Volcanology and Geothermal Research, 140: 157–170<br />
(2005).<br />
38. J. Davidson and F. Tepley, Recharge in Volcanic Systems: Evidence from<br />
Isotope Profiles of Phenocrysts. Science, 275: 826–829 (1997).<br />
39. J. Davidson, F. Tepley and K. Knesel, Isotopic fingerprinting may provide<br />
insights into evolution of magmatic systems. EOS Transactions AGU, 79:<br />
185,189,193 (1998).<br />
40. J. Davidson, F. Tepley, Z. Palacz and S. Meffan-Main, Magma recharge,<br />
contamination and residence times revealed by in situ laser ablation isotopic<br />
analysis of feldspar in volcanic rocks. Earth and Planetary Science Letters,<br />
184: 427–442 (2001).<br />
41. W. Deere, R. Howie and J. Zussman, Rock-forming minerals: Framework<br />
silicates feldspars, volume 4A. The Geological Society of London, second<br />
edition (2001).<br />
42. R. Duncan, A time frame for construction of the Kerguelen Plateau and<br />
Broken Ridge. Journal of Petrology, 43(7): 1109–1119 (2002).<br />
43. R. Duncan and R. Keller, Radiometric ages for basement rocks from the<br />
Emperor Seamounts, ODP Leg 197. Geochemistry, Geophysics, Geosystems,<br />
5 (2004), Paper number: 10.1029/2004GC000704.<br />
44. S. Eggins and J. Shelley, Compositional heterogeneity in NIST SRM 610-617<br />
glasses. Geostandards Newsletter, 26(3): 269–286 (2002).<br />
45. C. Farnetani, M. Richards and M. Ghiorso, Petrological models of magma<br />
evolution and deep crustal structure beneath hotspots and flood basalt<br />
provinces. Earth and Planetary Science Letters, 143(81-94) (1996).<br />
225
46. J. Fitton and M. Godard, Origin and evolution of magmas on the Ontong<br />
Java Plateau. In J. Fitton, J. Mahoney, P. Wallace and A. Saunders, editors,<br />
Origin and Evolution of the Ontong Java Plateau, volume 229 of Special<br />
Publications, pages 151–178, Geological Society, London (2004).<br />
47. J. Fitton, A. Saunders, P. Kempton and B. Hardarson, Does depleted mantle<br />
form and intrinsic part of the Iceland plume? Geochemistry, Geophysics,<br />
Geosystems, 4(3): doi:10.1029/2002GC000424 (2003).<br />
48. G. Foulger, Making the evidence fit the plume. Geoscientist (2003).<br />
49. F. Frey, M. Coffin, P. Wallace, D. Weis, X. Zhao, S. Wise, V. Wähnert,<br />
D. Teagle, P. Saccocia, D. Reusch, M. Pringle, K. Nicolaysen, C. Neal,<br />
R. Müller, C. Moore, J. Mahoney, L. Keszthelyi, H. Inokuchi, R. Duncan,<br />
H. Delius, J. Damuth, D. Damasceno, H. Coxall, M. Borre, F. Boehm, J. Barling,<br />
N. Arndt and M. Antretter, Origin and evolution of a submarine large<br />
igneous province: the kerguelen plateau and broken ridge, southern indian<br />
ocean. Earth and Planetary Science Letters, 176: 73–89 (2000).<br />
50. F. Frey, S. Huang, J. Blichert-Toft, M. Regelous and M. Boyet, Origin of<br />
Depleted Components in Lavas Related to the Hawaiian Hotspot: Evidence<br />
From Hf Isotope Data. Geochemistry, Geophysics, Geosystems, 6(1): doi:<br />
10.1029/2004GC000757 (2005).<br />
51. F. Frey, D. Weis, A. Borisova and G. Xu, Involvement of continental crust in<br />
the formation of the Cretaceous Kergeulen Plateau: new perspectives from<br />
ODP Leg 120 Sites. Journal of Petrology, 43(7): 1207–1239 (2002).<br />
52. B. Fryer, S. Jackson and H. Longerich, The design, operation and role of<br />
laser-ablation microprobe coupled with an inductively coupled plasma - mass<br />
spectrometer (LAM-ICP-MS) in the Earth sciences. Canadian Mineralogist,<br />
33: 303–312 (1995).<br />
53. A. Furomoto, D. Hussong, J. Campbell, G. Sutton, A. Malahoff, J. Rose and<br />
G. Woollard, Crustal and upper mantle structure of the Solomon Islands as<br />
revealed by seismic refraction survey of November-December 1966. Pacific<br />
Science, 24: 315–332 (1970).<br />
54. A. Furomoto, J. Webb, M. Odegard and D. Hussong, Seismic studies of the<br />
Ontong Java Plateau, 1970. Tectonophysics, 34: 71–90 (1976).<br />
55. M. Ghiorso and R. Sack, Chemical mass transfer in magmatic processes, IV.<br />
A revised an internally consistent thermodynamic model for interpolation<br />
and extrapolation of liquid-solid equilibria in magmatic systems at elevated<br />
temperatures and pressure. Contributions to Mineralogy and Petrology, 119:<br />
197–212 (1995).<br />
226
56. B. Giletti, Isotopic equilibrium/disequilibrium and diffusion kinetics in<br />
feldspars. In I. Parsons, editor, Feldspars and their Reactions. NATO ASI<br />
Series, volume 421, pages 351–382, Kluwer Academic (1994).<br />
57. B. Giletti and J. Casserly, Strontium diffusion kinetics in plagioclase<br />
feldspars. Geochimica et Cosmochimica Acta, 58: 3785–3793 (1994).<br />
58. B. Giletti and T. Shanahan, Alkali diffusion in plagioclase feldspar. Chemical<br />
Geology, 139: 3–20 (1997).<br />
59. C. Ginibre, G. Wörner and A. Kronz, Minor- and trace-element zoning in plagioclase:<br />
implications for magma chamber processes at Parinacota volcano,<br />
northern Chile. Contributions to Mineralogy and Petrology, 143: 300–315<br />
(2002).<br />
60. C. Ginibre, G. Wörner and A. Kronz, Structure and dynamics of the Laacher<br />
See magma chamber (Eifel, Germany) from major and trace element zoning<br />
in sanidine: A cathodoluminescence and electron microprobe study. Journal<br />
of Petrology, 45: 2197–2223 (2004).<br />
61. T. Grove, D. Gerlach and T. Sando, Origin of calc-alkaline series lavas at<br />
Medicine Lake volcano by fractionation, assimilation, and mixing. Contributions<br />
to Mineralogy and Petrology, 80: 160–182 (1982).<br />
62. K. Haase, Geochemical constraints on the magma sources and mixing processes<br />
in Easter Microplate (MORB) (SE Pacific): a case study of plumeridge<br />
interaction. Chemical Geology, 182: 335–355 (2002).<br />
63. P. Hall and C. Kincaid, Plume-ridge interaction and the geometry of melting.<br />
EOS Transactions AGU, 79(45): 1006 (1998).<br />
64. B. Hanan, J. Blichert-Toft, R. Kingsley and J. Schilling, Depleted Iceland<br />
mantle plume geochemical signature: Artifact of multicomponent mixing?<br />
Geochemistry, Geophysics, Geosystems, 1: doi:10.1029/1999GC000009<br />
(2000).<br />
65. G. Heiken, Will Vesuvius Erupt? Three Million People Need to Know. Science,<br />
286(5445): 1685–1687 (1999).<br />
66. C. Herzberg, Partial crystallization of mid-ocean ridge basalts in the crust<br />
and mantle. Journal of Petrology, 45(12): 2389–2405 (2004).<br />
67. M. Higgins, Magma dynamics beneath Kameni volcano, Thera, Greece, as<br />
revealed by crystal size and crystal shape measurements. Journal of Volcanology<br />
and Geothermal Research, 70: 37–48 (1996).<br />
227
68. M. Higgins, Measurement of crystal size distributions. American Mineralogist,<br />
85: 1105–1116 (2000).<br />
69. M. Higgins, Closure in crystal size distribution (CSD), verification of CSD<br />
calculations and the significance of CSD fans. American Mineralogist, 87:<br />
160–164 (2002).<br />
70. M. Higgins and J. Roberge, Crystal size distributions of plagioclase and<br />
amphibole from Soufrière Hills volcano, Montserrat: evidence for dynamic<br />
crystallization – textural coarsening cycles. Journal of Petrology, 44: 1401–<br />
1411 (2003).<br />
71. R. Ho and M. Garcia, Origin of differentiated lavas at Kilauea Volcano,<br />
Hawaii; implications from the 1955 eruption. Bulletin of Volcanology, 50:<br />
35–46 (1988).<br />
72. S. Huang, M. Regelous, T. Thordarson and F. Frey, Petrogenesis of Lavas<br />
from Detroit Seamount: geochemical differences between Emperor Chain<br />
and Hawaiian Volcanoes. Geochemistry, Geophysics, Geosystems, 6(1): doi:<br />
10.1029/2004GC000756 (2005).<br />
73. D. Hussong, L. Wipperman and L. Kroenke, The crustal structure of the<br />
ontong java and manihiki oceanic plateaus. Journal of Geophysical Research,<br />
84: 6003–6010 (1979).<br />
74. S. Ingle, D. Weis and F. Frey, Indian continental crust recovered from Elan<br />
Bank, Kerguelen Plateau (ODP Leg 183, Site 1137). Journal of Petrology,<br />
43: 1241–1257 (2002).<br />
75. S. Ingle, D. Weis, J. Scoates and F. Frey, Relatiosnhip between the early Kerguelen<br />
plume and continental flood basalts of the paleo-Eastern Gondwanan<br />
margins. Earth and Planetary Science Letters, 197: 35–50 (2002).<br />
76. T. Jefferies, S. Jackson and H. Longerich, Application of a frequency quintupled<br />
nd:yag source (? = 213 nm) for laser ablation inductively coupled<br />
plasma mass spectrometric analysis of minerals. Journal of Analytical Atomic<br />
Spectrometry, 13: 935–940 (1998).<br />
77. W. Johannes, J. Koepke and H. Behrens, Partial melting reactions of plagioclases<br />
and plagioclase-bearing systems. In I. Parsons, editor, Feldspars and<br />
their Reactions. NATO ASI Series, pages 161–194, Kluwer Academic (1994).<br />
78. R. Keller, R. Duncan and M. Fisk, Geochemistry and 40 Ar/ 39 Ar geochronology<br />
of basalts from ODP Leg 145 (North Pacific Transect). In D. Rea,<br />
I. Basov, D. Scholl and J. Allan, editors, Proceedings of the Ocean Drilling<br />
228
Program, Scientific Results, volume 145, pages 333–344, Ocean Drilling Program,<br />
College Station, TX (1995).<br />
79. R. Keller, M. Fisk and W. White, Isotopic evidence for Late Cretaceous<br />
plume-ridge interaction at the Hawaiian hotspot. Nature, 405: 673–676<br />
(2000).<br />
80. R. Kent, M. Pringle, A. Saunders and N. Ghose, 40 Ar/ 39 Ar age of the rajmahal<br />
basalts, india, and their relationship to the southern kerguelen plateau.<br />
Journal of Petrology, 43: 1141–1153 (2001).<br />
81. S. King and D. Anderson, Edge-driven convection. Earth and Planetary Science<br />
Letters, 160: 289–296 (1998).<br />
82. L. Kroenke, W. Berger, T. Janecek and et al., Proceedings of the Ocean<br />
Drilling Program, Initial Reports, 130. Technical report, Available from:<br />
Ocean Drilling Program, Texas A&M University, College Station TX 77845-<br />
9547, USA (1991).<br />
83. T. Kuritani, Boundary layer crystallization in a basaltic magma chamber:<br />
evidence from Rishiri Volcano, Northern Japan. Journal of Petrology, 39:<br />
1619–1640 (1998).<br />
84. C. Langmuir, Geochemical consequences of in situ crystallization. Nature,<br />
340: 199–205 (1989).<br />
85. C. Langmuir, E. Klein and T. Plank, Petrological systematics of Midocean<br />
ridge basalts: constraints on melt generation beneath ocean ridges.<br />
In J. Phipps-Morgan, D. Blackman and T. Plank, editors, Mantle flow and<br />
melt generation at Mid-ocean ridges, volume 71 of Geophysical Monograph,<br />
pages 183–280, American Geophysical Union (1992).<br />
86. I. L’Heureux and A. Fowler, Isothermal constitutive undercooling as a model<br />
for oscillatory zoning in plagioclase. Canadian Mineralogist, 34: 1264–1288<br />
(1996).<br />
87. G. Lofgren, An experimental study of plagioclase crystal morphology:<br />
isothermal crystallization. American Journal of Science, 274: 243–273<br />
(1974).<br />
88. H. Longerich, S. Jackson and D. Günther, Laser ablation inductively coupled<br />
plasma mass spectrometric transient signal data acquisition and analyte<br />
concentration calculation. Journal of Analytical Atomic Spectrometry,<br />
11: 899–904 (1996).<br />
229
89. J. Longhi, D. Walker and J. Hays, Fe and Mg in plagioclase. Proceedings of<br />
the7th Lunar and Planetary Science Conference, L4: 1281–1300 (1976).<br />
90. T. Loomis, Numerical simulations of crystallization processes of plagioclase<br />
in complex melts: the origin of major and oscillatory zoning in plagioclase.<br />
Contributions to Mineralogy and Petrology, 81: 219–229 (1982).<br />
91. J. Mahoney, J. Fitton and P. Wallace, Proceedings of the Ocean Drilling Program,<br />
Initial Reports, 192. [CD-ROM], Available from: Ocean Drilling Program,<br />
Texas A&M University, College Station TX 77845-9547, USA (2001).<br />
92. J. Mahoney, W. Jones, F. Frey, V. Salters, D. Pyle and H. Davies, Geochemical<br />
characteristics of lavas from Broken Ridge, the Naturaliste Plateau<br />
and southernmost Kerguelen Plateau: Cretaceous plateau volcanism in the<br />
southeast Indian Ocean. Chemical Geology, 120: 315–345 (1995).<br />
93. J. Mahoney, M. Storey, R. Duncan, K. Spencer and M. Pringle, Geochemistry<br />
and age of the Ontong Java Plateau. In M. Pringle, W. Sager, W. Sliter and<br />
S. Stein, editors, The Mesozoic Pacific: Geology, Tectonics, and Volcanism,<br />
volume 77 of Geophysical Monograph, pages 233–262, American Geophysical<br />
Union (1993).<br />
94. J. Mahoney, M. Storey, R. Duncan, K. Spencer and M. Pringle, Geochemistry<br />
and geochronology of Leg 130 basement lavas: Nature and origin of the<br />
Ontong Java Plateau. In W. Berger, L. Kroenke, L.A.Mayer and et al., editors,<br />
Proceedings of the Ocean Drilling Program, Scientific Results, volume<br />
130 (1993).<br />
95. J. Mammerickx and G. Sharman, Tectonic evolution of the North Pacific<br />
during the Cretaceous Quiet Period. Journal of Geophysical Research, 93:<br />
3009–3024 (1988).<br />
96. B. Marsh, Crystal size distribution (csd) in rocks and kinetics and dynamics<br />
of crystallization i. theory. Contributions to Mineralogy and Petrology, 99:<br />
277–291 (1988).<br />
97. B. Marsh, Magma chambers. Annual Review of Earth and Planetary Sciences,<br />
17: 439–474 (1989).<br />
98. B. Marsh, Solidification fronts and magma dynamics. Mineralogical Magazine,<br />
60: 5–40 (1996).<br />
99. B. Marsh, On the interpretation of crystal size distributions in magmatic<br />
systems. Journal of Petrology, 39(4): 553–599 (1998).<br />
230
100. B. Marsh, A magmatic mush column rosetta stone: The mcmurdo dry valleys<br />
of antarctica. EOS Transactions AGU, 85(47): 497,502 (2004).<br />
101. A. McBirney, B. Baker and R. Nilson, Liquid Fractionation. Part I: basic<br />
principles and experimental simulations. Journal of Volcanology and Geothermal<br />
Research, 24: 1–24 (1985).<br />
102. A. McBirney and R. Noyes, Crystallization and layering of the Skaergaard<br />
intrusion. Journal of Petrology, 20: 487–554 (1979).<br />
103. P. Michael, Implications for magmatic processes at Ontong Java Plateau from<br />
volatile and major element contents of Cretaceous basalt glasses. Geochemistry,<br />
Geophysics, Geosystems, 1(1999GC000025) (1999), Paper number:.<br />
104. A. Mock, D. Jerram and C. Breitkreuz, Using Quantitative Textural Analysis<br />
to Understand the Emplacement of Shallow-Level Rhyolitic Laccoliths -<br />
a Case Study from the Halle Volcanic Complex, Germany. Journal of Petrology,<br />
44(5): 833–849 (2003).<br />
105. D. Morgan, D. Chertkoff, D. Jerram, J. Davidson and L. Francalanci, What’s<br />
in a Whole Rock Analysis? Integrating Crystal Size Distributions and Micro-<br />
Scale Isotopic Variations at Stromboli Volcano. EOS Transactions AGU,<br />
85(V12A-08) (2005).<br />
106. D. Morgan and D. Jerram, On estimating crystal shape for crystal size distribution<br />
analysis. Journal of Volcanology and Geothermal Research, 154: 1–7<br />
(2006).<br />
107. M. Nakamura and S. Shimakita, Dissolution origin and syn-entrapment compositional<br />
changes of melt inclusions in plagioclase. Earth and Planetary Science<br />
Letters, 161: 119–133 (1998).<br />
108. C. Neal and J. Davidson, An unmetasomatized mantle source for the<br />
Malaitan alnöite (Solomon Islands): Petrogenesis involving zone refining,<br />
megacryst fractionation, and assimilation of oceanic lithosphere. Geochimica<br />
et Cosmochimica Acta, 53: 1975–1990 (1989).<br />
109. C. Neal, J. Mahoney and W. C. III, Mantle sources and the highly variable<br />
role of continental lithosphere in basalt petrogenesis of the Kerguelen Plateau<br />
and Broken Ridge LIP: results from ODP Leg 183. Journal of Petrology,<br />
43(7): 1177–1205 (2002).<br />
110. C. Neal, J. Mahoney, L. Kroenke, R. Duncan and M. Petterson, The Ontong<br />
Java Plateau. In J. Mahoney and M. Coffin, editors, Large Igneous<br />
Provinces: Continental, Oceanic, and Planetary Flood Volcanism, volume<br />
231
100 of Geophysical Monograph, pages 183–216, American Geophysical Union<br />
(1997).<br />
111. K. Nicolaysen, S. Bowring, F. Frey, D. Weis, S. Ingle, M. Pringle, M. Coffin<br />
and the Leg 183 Shipboard Scientific Party, Provenance of Proterozoic<br />
garnet-biotite gneiss recovered from Elan Bank, Kerguelen Plateau, southern<br />
Indian Ocean. Geology, 29: 235–238 (2001).<br />
112. M. Norman, N. Pearson, A. Sharma and W. Griffin, Quantitative analysis of<br />
trace elements in geological materials by laser ablation ICP-MS: instrumental<br />
operating conditions and calibration values of NIST glasses. Geostandards<br />
Newsletter, 20(247-261) (1996).<br />
113. M. O’Hara and C. Herzberg, Interpretation of trace element and isotope<br />
features of basalts: Relevance of field relations, petrology, major element<br />
data, phase equilibria, and magma chamber modeling in basalt petrogenesis.<br />
Geochimica et Cosmochimica Acta, 66(12): 2167–2191 (2002).<br />
114. J. Pearce, Mantle Preconditioning by Melt Extraction during Flow: Theory<br />
and Petrogenetic Implications. Journal of Petrology, 46(5): 973–997 (2005).<br />
115. T. Pearce, Recent work on oscillatory zoning in plagioclase. In I. Parsons,<br />
editor, Feldspars and their reactions, volume 421, pages 313–350, Kluwer<br />
Academic (1994).<br />
116. M. Petterson, C. Neal, J. Mahoney, L. Kroenke, A. Saunders, T. Babbs,<br />
R. Duncan, D. Tolia and B. McGrail, Structure and deformation of north<br />
and central Malaita, Solomon Islands: tectonic implications for the Ontong<br />
Java Plateau—Solomon arc collision, and for the fate of oceanic plateaus.<br />
Tectonophysics, 283: 1–33 (1997).<br />
117. W. Phinney, Partition coefficients for iron between plagioclase and basalt as<br />
function of oxygen fugacity: Implications for lunar anorthosites. Geochimica<br />
et Cosmochimica Acta, 56: 1885–1895 (1994).<br />
118. D. Rea, I. Basov, T. Janecek, A. Palmer-Julson and et al., Proceedings of<br />
the Ocean Drilling Program, Initial Reports, 145. Technical report, Available<br />
from: Ocean Drilling Program, Texas A&M University, College Station TX<br />
77845-9547, USA (1993).<br />
119. M. Regelous, A. Hofmann, W. Abouchami and S. Galer, Geochemistry of<br />
lavas from the Emperor Seamounts, and the geochemical evolution of Hawaiian<br />
magmatism from 85 to 42 Ma. Journal of Petrology, 44(1): 113–140<br />
(2003).<br />
232
120. R. Resmini and B. Marsh, Steady-state volcanism, paleoeffusion rates, and<br />
magma system volume inferred from plagioclase crystal size distributions in<br />
mafic lavas: Dome Mountain, Nevada. Journal of Volcanology and Geothermal<br />
Research, 68: 273–296 (1995).<br />
121. J. Roberge, R. White and P. Wallace, Volatiles in submarine basaltic glasses<br />
from the Ontong Java Plateau (ODP Leg 192): implications for magmatic<br />
processes and source region compositions. In J. Fitton, J. Mahoney, P. Wallace<br />
and A. Saunders, editors, Origin and Evolution of the Ontong Java<br />
Plateau, volume 229 of Special Publications, pages 329–257, Geological Society<br />
(2004).<br />
122. M. Ryan, Neutral buoyancy and the mechanical evolution of magmatic systems.<br />
In B. Mysen, editor, Magmatic processes: physicochemical principles,<br />
volume 1 of Special Publication, pages 259–288, The Geochemical Society<br />
(1987).<br />
123. T. Sano and S. Yamashita, Experimental petrology of basement lavas from<br />
Ocean Drilling Program Leg 192: implications for differentiation processes<br />
in Ontong Java Plateau magmas. In J. Fitton, J. Mahoney, P. Wallace and<br />
A. Saunders, editors, Origin and Evolution of the Ontong Java Plateau, volume<br />
229 of Special Publications, pages 185–218, Geological Society, London<br />
(2004).<br />
124. A. Saunders, Mantle plumes: an alternative to the alternative. Geoscientist<br />
(2003).<br />
125. A. Saunders, M. Storey, I. Gibson, P. Leat, J. Hergt and R. Thompson,<br />
Chemical and isotopic constraints on the origin of basalts from the ninetyeast<br />
ridge, indian ocean: results from dsdp legs 22 and 26 and odp leg<br />
121. In J. Weissel, J. Peirce, E. Taylor and J. Alt, editors, Proceedings of<br />
the Ocean Drilling Program, Scientific Results, volume 121, pages 559–590,<br />
Ocean Drilling Program, College Station TX 77845-9547, USA (1991).<br />
126. T. Sisson and T. Grove, Experimental investigations of the role of H2O in<br />
calc-alkaline differentiation and subduction zone magmatism. Contributions<br />
to Mineralogy and Petrology, 113: 143–166 (1993).<br />
127. J. Smith and W. Brown, Feldspar Minerals, volume 1. Springer-Verlag<br />
(1988).<br />
128. J. Tarduno, D. Duncan, R. Scholl and et al., Proceedings of the Ocean<br />
Drilling Program, Initial Reports, 197. [CD-ROM], Available from: Ocean<br />
Drilling Program, Texas A&M University, College Station TX 77845-9547,<br />
USA (2002).<br />
233
129. J. Tarduno, W. Sliter, L. Kroenke, M. Leckie, J. Mahoney, R. Musgrave,<br />
M. Storey and E. Winterer, Rapid formation of the Ontong Java Plateau by<br />
Aptian mantle plume volcanism. Science, 254: 399–403 (1991).<br />
130. R. Taylor, B. Murton and M. Thirlwall, Petrographic and geochemical variation<br />
along the Reykjanes Ridge, 57 ◦ -59 ◦ N. Journal of the Geological Society<br />
of London, 152: 1031–1037 (1995).<br />
131. M. Tejada, J. Mahoney, P. Castillo, S. Ingle, H. Sheth and D. Weis, Pinpricking<br />
the elephant: evidence on the origin of the Ontong Java Plateau from<br />
Pb-Sr-Hf-Nd isotopic characteristics of ODP Leg 192 basalts. In J. Fitton,<br />
J. Mahoney, P. Wallace and A. Saunders, editors, Origin and Evolution of<br />
the Ontong Java Plateau, volume 229 of Special Publications, pages 133–150,<br />
Geological Society, London (2004).<br />
132. M. Tejada, J. Mahoney, R. Duncan and M. Hawkins, Age and geochemistry of<br />
basement and alkalic rocks of Malaita and Santa Isabel. Journal of Petrology,<br />
177: 361–393 (1996).<br />
133. M. Tejada, J. Mahoney, C. Neal, R. Duncan and M. Petterson, Basement<br />
Geochemistry and Geochronology of Central Malaita, Solomon Islands, with<br />
Implications for the Origin and Evolution of the Ontong Java Plateau. Journal<br />
of Petrology, 43(3): 449–484 (2002).<br />
134. F. Tepley and J. Davidson, Mineral-scale sr-isotope constraints on magma<br />
evolution and chamber dynamics in the rum layered intrusion, scotland. Contributions<br />
to Mineralogy and Petrology, 145: 628–641 (2003).<br />
135. F. Tepley, J. Davidson, R. Tilling and J. Arth, Magma mixing, recharge<br />
and eruption histories recorded in plagioclase phenocrysts from El Chichón<br />
Volcano, Mexico. Journal of Petrology, 41: 1397–1411 (2000).<br />
136. A. Tsuchiyama, Dissolution kinetics of plagioclase in the melt of system<br />
diopside-albite-anorthite, and origin of dusty plagioclase in andesites. Contributions<br />
to Mineralogy and Petrology, 89: 1–16 (1985).<br />
137. J. VanderAuwera, J. Longhi and J. Duchesne, The effect of pressure on DSr<br />
(plag/melt) and DCr (opx/melt): implications for anorthosite petrogenesis.<br />
Earth and Planetary Science Letters, 178: 303–314 (2000).<br />
138. L. Wager and W. Deere, Geological investigations in East Greenland: Part<br />
III. The petrology of the Skaergaard Intrusion, Kangerdluqssuaq, East<br />
Greenland. Meddelelser om Grønland, 105: 1–16 (1939).<br />
234
139. G. Wallace and G. Bergantz, Wavelet-based correlation (WBC) of zoned<br />
crystal populations and magma mixing. Earth and Planetary Science Letters,<br />
202: 133–145 (2002).<br />
140. G. Wallace and G. Bergantz, Constraints on mingling of crystal populations<br />
from off-center zoning profiles: A statistical approach. American Mineralogist,<br />
89: 64–73 (2004).<br />
141. G. Wallace and G. Bergantz, Reconciling heterogeneity in crystal zoning<br />
data: An application of shared characteristic diagrams at Chaos Crags,<br />
Lassen Volcanic Center, California. Contributions to Mineralogy and Petrology,<br />
140: 98–112 (2005).<br />
142. M. Wilke and H. Behrens, The dependence of the partitioning of iron and<br />
europium between plagioclase and hydrous tonalitic melt on oxygen fugacity.<br />
Contributions to Mineralogy and Petrology, 137: 102–114 (1999).<br />
143. J. Wolff and F. Ramos, Assimilation yesterday, today and tomorrow. EOS<br />
Transactions AGU, 83: F1406 (2003).<br />
144. B. Wood and J. Blundy, The effect of H2O on crystal-melt partitioning of<br />
trace elements. Geochimica et Cosmochimica Acta, 66: 3647–3656 (2002).<br />
145. G. Zellmer, S. Blake, D. Vance, C. Hawkesworth and S. Turner, Plagioclase<br />
residence times at two island arc volcanoes (Kameni Islands, Santorini, and<br />
Soufriere, St. Vincent) determined by Sr diffusion systematics. Contributions<br />
to Mineralogy and Petrology, 136: 345–357 (1999).<br />
146. M. Zieg and B. Marsh, Crystal size distributions and scaling laws in the quantification<br />
of igneous textures. Journal of Petrology, 43(1): 85–101 (2002).<br />
This document was prepared & typeset with L ATEX2ε, and formatted with<br />
nddiss2ε classfile (v1.0[2004/06/15]) provided by Sameer Vijay.<br />
235