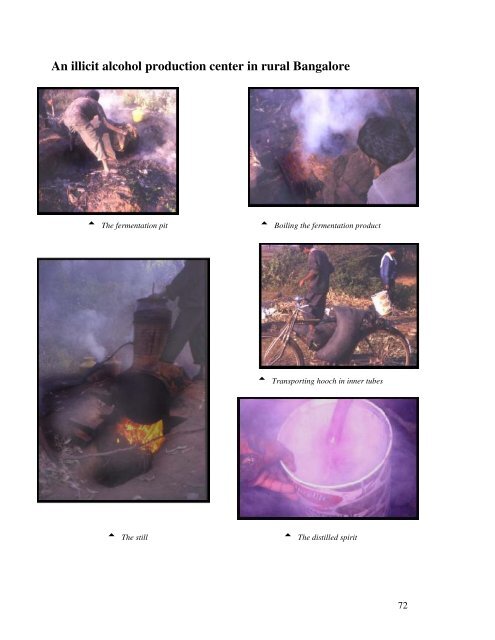
An illicit alcohol production center in rural Bangalore - Nimhans
An illicit alcohol production center in rural Bangalore - Nimhans
An illicit alcohol production center in rural Bangalore - Nimhans

Create successful ePaper yourself
Turn your PDF publications into a flip-book with our unique Google optimized e-Paper software.
<strong>An</strong> <strong>illicit</strong> <strong>alcohol</strong> <strong>production</strong> <strong>center</strong> <strong>in</strong> <strong>rural</strong> <strong>Bangalore</strong><br />
The fermentation pit<br />
The still<br />
Boil<strong>in</strong>g the fermentation product<br />
Transport<strong>in</strong>g hooch <strong>in</strong> <strong>in</strong>ner tubes<br />
The distilled spirit<br />
72
Discussion<br />
73
1. Prevalence of <strong>alcohol</strong> use <strong>in</strong> Karnataka<br />
Alcohol use is low<br />
Only 15% of all the adults sampled over 5 districts <strong>in</strong> Karnataka reported any <strong>alcohol</strong> use over the<br />
past 12 months. The low prevalence of <strong>alcohol</strong> users <strong>in</strong> this study sample is fairly similar to<br />
previously reported figures from epidemiological studies conducted over the past thirty years <strong>in</strong><br />
specific regions of India (Isaac,1998; Saxena, 1999).<br />
Surveys of Alcohol Use <strong>in</strong> the General Population <strong>in</strong> India<br />
Study Year Sample Area Population Measure Rate<br />
Lal and S<strong>in</strong>gh 1978 Rural Punjab 7000 Current <strong>alcohol</strong> use 49.6% adults<br />
Sethi and Trivedi 1979 Rural Uttar Pradesh Alcohol use 21.4% adults<br />
Varma 1980 Urban Chandigarh Ever Use<br />
40% adults<br />
Current use<br />
23.7%<br />
Mathrubootham 1989 Tamil Nadu Alcohol use 33% males<br />
Channabasavanna 1989 Karnataka 5573 students; Alcohol ever used 42.1%<br />
4007 adults<br />
33.7%<br />
NIMHANS 1990 Rural Karnataka 32,400 Alcohol dependence 1.15%<br />
Chakravarthy 1990 Rural Tamil Nadu Alcohol use 26-50%<br />
males<br />
Ponnudorai et al 1991 Urban Madras Current use 16.67<br />
males<br />
%<br />
Bang and Bang 1991 Rural Maharashtra 400,000 Use<br />
Addicted<br />
25% males<br />
5%<br />
Mohan et al 1992 Urban slum Delhi Substance abuse 26%<br />
Murthy et al 1998 Urban slum <strong>Bangalore</strong> 5633 Alcohol use 27% males;<br />
2% females<br />
There are extreme gender differences <strong>in</strong> the prevalence of <strong>alcohol</strong> use<br />
Alcohol use is still very much a male preserve. Only about a third of the men and as little as a tenth<br />
of the women reported any <strong>alcohol</strong> use with<strong>in</strong> the past year. This is compatible with previous<br />
estimates of use from the same region as well as other parts of the country, which have consistently<br />
reported female use less than 5% [Isaac. 1998; Saxena, 1999]. One must note here that figures<br />
perta<strong>in</strong><strong>in</strong>g to female use are liable to be under-reported. Alcohol use and especially <strong>alcohol</strong> use <strong>in</strong><br />
women is socially stigmatized and there is a reluctance to report such use. There is some support<br />
for this view, as a significant number of male and female users expressed the view that womens’<br />
dr<strong>in</strong>k<strong>in</strong>g is viewed as somehow more shameful and therefore kept hidden. Even among consumers<br />
there is a belief that women dr<strong>in</strong>k rarely and <strong>in</strong> small amounts, which is far from what actually<br />
transpires [see below].<br />
It should be noted that, identification of users was primarily conducted through <strong>in</strong>itial <strong>in</strong>formation<br />
given by a key <strong>in</strong>formant <strong>in</strong> each family, who was most often (for reasons of social propriety) the<br />
male head of house-hold. Under these circumstances there is likely to be a greater chance of underestimat<strong>in</strong>g<br />
consumers among the female family members and <strong>in</strong> the younger males as well. The<br />
former would be “protected” from enquiry and the latter would be likely to have hidden their status<br />
as consumer from the family.<br />
74
Users are gett<strong>in</strong>g younger<br />
That the latter cause of under-estimation may be operative, can be deduced from the fact that the<br />
mean age of the dr<strong>in</strong>k<strong>in</strong>g population is above forty years, whereas the age at which the bulk of<br />
respondents admitted to hav<strong>in</strong>g had their first dr<strong>in</strong>k and the age by which they had begun regular<br />
dr<strong>in</strong>k<strong>in</strong>g is near 20 years. This would allow us to presume that a proportion of young people at the<br />
beg<strong>in</strong>n<strong>in</strong>g of their dr<strong>in</strong>k<strong>in</strong>g careers have evaded detection.<br />
This is important as there is evidence from work conducted on heavy <strong>alcohol</strong> users from this same<br />
population, that the average age at which males start regular dr<strong>in</strong>k<strong>in</strong>g has dropped to 23 years<br />
[1998] from 25 years <strong>in</strong> 1988. The mean age by which they developed significant <strong>alcohol</strong><br />
dependence dropped to 29 years from 35 years <strong>in</strong> the same time period (Benegal, 1998).<br />
The data gathered from this study also po<strong>in</strong>ts to a significant cohort effect on age at <strong>in</strong>itiation of<br />
<strong>alcohol</strong> use. This po<strong>in</strong>ts to a progressive lower<strong>in</strong>g of the age at which consumers over time have<br />
their first dr<strong>in</strong>k of <strong>alcohol</strong>.<br />
There are strong <strong>rural</strong> - urban differences<br />
<strong>in</strong> prevalence of use<br />
Prevalence of dr<strong>in</strong>k<strong>in</strong>g appears<br />
significantly higher <strong>in</strong> <strong>rural</strong> areas<br />
compared to urban areas, with (61% vs.<br />
39%) or without (52% vs. 48%) the<br />
<strong>in</strong>clusion of the tribal sample <strong>in</strong> the <strong>rural</strong><br />
sector. Tribal areas had the highest<br />
prevalence of <strong>alcohol</strong> use <strong>in</strong> both men and<br />
women.<br />
The prevalence of <strong>alcohol</strong> consumption is<br />
related to education and <strong>in</strong>come levels<br />
Absta<strong>in</strong>ers were significantly likely to be<br />
better educated and have higher family<br />
<strong>in</strong>comes than <strong>alcohol</strong> users except <strong>in</strong> the<br />
tribal population. Previous studies have<br />
also documented similar f<strong>in</strong>d<strong>in</strong>gs that<br />
<strong>alcohol</strong> use is more common among lower<br />
socio-economic groups. The popular<br />
explanation that <strong>alcohol</strong> provides a way of<br />
cop<strong>in</strong>g with poverty and deprivation, may<br />
certa<strong>in</strong>ly expla<strong>in</strong> this phenomenon.<br />
However, one needs to consider, <strong>in</strong> the<br />
context of social trends <strong>in</strong> India, the<br />
<strong>in</strong>terest<strong>in</strong>g phenomenon of sanskritisation,<br />
<strong>in</strong> which as a result of social and<br />
economic mobility, people of lower<br />
socioeconomic class adopt the mores of<br />
the higher castes / classes. It has been<br />
speculated, that with <strong>in</strong>creas<strong>in</strong>g education<br />
and urbanization and the resultant social<br />
and economic mobility which saw the<br />
growth of the urban middle classes <strong>in</strong><br />
India, <strong>in</strong> the last 150 years or less, there<br />
have been rapid changes <strong>in</strong> diet (<strong>in</strong> favour<br />
of vegetarianism and abst<strong>in</strong>ence from<br />
28.33<br />
19<br />
11.29<br />
15<br />
2.04<br />
Sample estimates<br />
58.34<br />
Industry estimates<br />
7<br />
Whisky<br />
Brandy<br />
Rum<br />
White spirits<br />
From: Indian Spirits Market, by RaboIndia F<strong>in</strong>ance Ltd. April 2002<br />
59<br />
75
<strong>alcohol</strong>) as lower castes/classes adopted the cultural mores of the higher castes / classes <strong>in</strong> order to<br />
better adapt to their changed positions <strong>in</strong> the social hierarchy. In this view, the larger <strong>rural</strong> and<br />
tribal populations felt no pressure to change their dr<strong>in</strong>k<strong>in</strong>g habits. (See discussion later)<br />
The beverage <strong>alcohol</strong> market is dom<strong>in</strong>ated by spirits<br />
94.7% of the beverages drunk, whether they are licit or <strong>illicit</strong> are spirits (Indian made foreign<br />
liquors: Whisky, Brandy, Rum etc @ 42.8 % v/v, or Arrack, the government licensed country<br />
liquor @ 33.3% v/v or various forms of <strong>illicit</strong> spirits of <strong>in</strong>determ<strong>in</strong>ate strength…which we have for<br />
convenience assumed to be @42.8 % v/v.<br />
The IMFL consumption is dom<strong>in</strong>ated by whisky and this is representative of market trends all over<br />
India. Whisky accounts for about 58.3% of the IMFL consumption <strong>in</strong> our sample. Brandy<br />
accounted for 28%, Rum for 11.3% and White spirits for 2%. This is uncannily similar to the<br />
<strong>in</strong>dustry figures, which estimate that the branded spirits market is dom<strong>in</strong>ated by sales of cheap<br />
whisky, which constitute 59% of the spirits bus<strong>in</strong>ess, leav<strong>in</strong>g a limited market to be divided among<br />
the other hard liquors like brandy, g<strong>in</strong> and vodka.<br />
That spirits constitute the lion’s share <strong>in</strong> the licit market (over 72 million cases, nationally) is well<br />
known to local and trans-national companies. The <strong>in</strong>troduction of new branded spirits (as opposed<br />
to beers and w<strong>in</strong>es) has dom<strong>in</strong>ated the market<strong>in</strong>g agenda of most new commercial ventures.<br />
Observers note that this co<strong>in</strong>cides with sharp down turns <strong>in</strong> <strong>alcohol</strong> consumption (especially spirits)<br />
<strong>in</strong> Western Europe and North America and fear that this might lead to dump<strong>in</strong>g of spirits <strong>in</strong> the<br />
Indian market.<br />
30<br />
25<br />
20<br />
15<br />
10<br />
5<br />
0<br />
22.2<br />
IML-<br />
IML-Brandy<br />
IML-Rum<br />
IML-G<strong>in</strong><br />
Government Arrack<br />
IML-Vodka<br />
23.1<br />
3.1<br />
Percent<br />
Preferred beverages<br />
Light<br />
Strong<br />
Scotch whisky<br />
Illicit distilled spirits<br />
25.2<br />
Illicit beers &<br />
Others<br />
IML_Whisky<br />
IML_Brandy<br />
IML_Rum<br />
IML_G<strong>in</strong><br />
IML_Vodka<br />
IML_Others<br />
Government arrack<br />
Light beer<br />
Strong beer<br />
FMFL_Scotch whisky<br />
FMFL_Brandy<br />
FMFL_Rum<br />
Illicit distilled spirits<br />
Illicit beers and brews<br />
Others- smuggled etc<br />
76
2. Undocumented consumption<br />
More than 40% of all <strong>alcohol</strong>ic beverages consumed <strong>in</strong> the state are undocumented<br />
More than 40% of the beverage of first choice i.e the beverage that the respondents drank on most<br />
occasions, belonged to the undocumented category.<br />
44%<br />
35% of the consumption was accounted for by beverages, which were clearly <strong>illicit</strong>ly produced.<br />
About 7% of the beverages consumed appeared to be identifiable as “seconds” liquor, as the unit<br />
retail prices of these were below the m<strong>in</strong>imum suggested retail price for any IMFL. One must assert<br />
here, that a door to door sampl<strong>in</strong>g approach is most likely to under-estimate such seconds<br />
consumption, as not every retailer passes the price advantage of un-taxed beverages to the<br />
consumer and to a large proportion of consumers, licit beverages and seconds beverages are<br />
<strong>in</strong>dist<strong>in</strong>guishable. Effectively, however, this means that the proportion of undocumented<br />
consumption is really more than 40% of the total consumption. Even the figures from the Taxation<br />
Task Force of Karnataka, assert that the real measure of ‘seconds’ beverage sold <strong>in</strong> the market is<br />
almost two and a half times the reported sales of IMFL.<br />
Less than a fourth of the consumers reported hav<strong>in</strong>g a second preference beverage. When it came to<br />
the second choice beverage, the proportion contributed by the undocumented segment rose to as<br />
high as 55%. S<strong>in</strong>ce most consumers who were given to the use of an alternate beverage, drank<br />
significantly larger quantities of <strong>alcohol</strong>, more frequently; had significantly more severe patterns of<br />
<strong>alcohol</strong> use; and were more likely to be both economically and educationally worse off, their use of<br />
a second beverage, appears to be a matter of settl<strong>in</strong>g for a cheaper <strong>illicit</strong> <strong>alcohol</strong> when the first<br />
choice was unaffordable or unavailable.<br />
Undocumented consumption is significantly more <strong>in</strong> <strong>rural</strong> populations<br />
Documented<br />
Undocumented<br />
Projected <strong>alcohol</strong> drunk by presumed 5.11 million consumers <strong>in</strong> the state: 100.87 million litres<br />
absolute <strong>alcohol</strong> equivalent per year (56.53 million litres of excise paid beverage and 44.34 million<br />
of undocumented beverage).<br />
.<br />
56%<br />
77
Illicit / undocumented beverages were most drunk among the tribal sample, then <strong>in</strong> <strong>rural</strong> areas and<br />
least popular <strong>in</strong> the urban areas. This f<strong>in</strong>d<strong>in</strong>g is along <strong>in</strong>tuitively expected l<strong>in</strong>es. It is no surprise that<br />
extensive availability of both IMFL and cheap country liquor outlets <strong>in</strong> urban areas should dictate<br />
the choice of the urban consumer, rather it is a surprise that despite the vigilance of the excise and<br />
police, despite the ubiquitous presence and reach of the <strong>alcohol</strong> beverage <strong>in</strong>dustry, there should be a<br />
market for <strong>illicit</strong> <strong>alcohol</strong> at all, albeit small.<br />
Apart from the observation that the tribal areas account for the largest prevalence of <strong>illicit</strong> <strong>alcohol</strong><br />
consumption, one must note that the <strong>production</strong> and distribution of beverage <strong>alcohol</strong> <strong>in</strong> these sites,<br />
was considerably different than <strong>in</strong> the <strong>rural</strong> and urban areas. The beverages were most often homemade,<br />
by the women of the house and meant only for personal consumption or at least for a small<br />
group of known consumers. One is also struck by the fact that the procedure for brew<strong>in</strong>g and<br />
distillation and the <strong>in</strong>gredients used, seem not to have changed <strong>in</strong> centuries (Achaya, 1998). Or <strong>in</strong><br />
other words, <strong>in</strong> tribal areas, the <strong>production</strong> and use of beverage <strong>alcohol</strong> appears to be a cont<strong>in</strong>uation<br />
of traditional practice and custom. Not so, <strong>in</strong> the some of the <strong>rural</strong> and more so <strong>in</strong> urban regions<br />
where the <strong>production</strong> is often on the scale of small scale <strong>in</strong>dustries, managed by people for whom<br />
this is not a traditional practice, for profit and <strong>in</strong> league with a crim<strong>in</strong>al nexus. The <strong>production</strong><br />
practices also <strong>in</strong>volve a lot of short cuts and admixture of the beverage with other substances to<br />
give an extra kick. Often, this may result <strong>in</strong> try<strong>in</strong>g to boost the <strong>alcohol</strong> content by add<strong>in</strong>g more<br />
<strong>alcohol</strong>; unfortunately sometimes due to ignorance or greed this may result <strong>in</strong> addition of rectified<br />
spirit or <strong>in</strong>dustrial spirits conta<strong>in</strong><strong>in</strong>g a proportion of methanol.<br />
While it has been customary to expla<strong>in</strong> these <strong>rural</strong> – urban differences <strong>in</strong> <strong>alcohol</strong> use, as a function<br />
of the greater availability of licit <strong>alcohol</strong> <strong>in</strong> urban areas, this does not satisfactorily expla<strong>in</strong> the<br />
<strong>in</strong>creased consumption or normalization of use <strong>in</strong> tribal and <strong>rural</strong> populations compared to urban<br />
groups. Lower economic and educational status certa<strong>in</strong>ly plays a part. However, it is tempt<strong>in</strong>g to<br />
speculate that this is also due <strong>in</strong> no small measure to the process of ‘sanskritisation’ [see section on<br />
Social Economic and political aspects].<br />
Illicitly brewed spirits are over represented among beverages that evade the record<br />
The largest segment of undocumented beverages, were the <strong>illicit</strong>ly distilled spirits. The names and<br />
manufactur<strong>in</strong>g processes varied widely across geographical locations and often <strong>in</strong> the same region<br />
there was a wide variety of beverages available. Illicitly distilled spirits are likely to represent the<br />
largest constituent of the undocumented segment, throughout the country (Carstairs, 1979).<br />
The next large segment was constituted by the seconds liquor. This segment is an important<br />
4.1<br />
18.7<br />
16.4<br />
Distribution: Undocumented beverages<br />
Illicit distilled spirits IMFL seconds Illicit beers and brews Others- smuggled etc<br />
60.8<br />
78
constituent of undocumented consumption <strong>in</strong> states like Karnataka, <strong>An</strong>dhra Pradesh and other states<br />
which have many beverage <strong>alcohol</strong> <strong>production</strong> units. It is likely that seconds, do not constitute such<br />
a large source of undocumented consumption, uniformly throughout the country.<br />
There are no seconds as far as available evidence goes, <strong>in</strong> the beer trade. However, low <strong>alcohol</strong>ic<br />
beverages have been a ma<strong>in</strong>stay of traditional dr<strong>in</strong>k<strong>in</strong>g practices <strong>in</strong> the country. There are a wide<br />
variety of beers and w<strong>in</strong>es which have been manufactured s<strong>in</strong>ce antiquity. To name a few: there is<br />
the chang or millet beer <strong>in</strong> the North Eastern states, mohwa or mahua produced from the mahwa<br />
flowers and the toddy produced <strong>in</strong> southern India. This is also a sector, which is the source of much<br />
ambivalence, among governments. In the south of India, for <strong>in</strong>stance toddy has always been freely<br />
brewed by farmers from the spathe of palm trees. Various governments, one suspects, at the behest<br />
of the large beer manufacturers lobby <strong>in</strong> the state have at times attempted to ban the largely<br />
unorganized <strong>production</strong> and sales of toddy, however these bans have been short-lived. In the recent<br />
past, the government ban on tapp<strong>in</strong>g coconut trees has been stymied by a widespread pestilence of<br />
the coconut mite. However, at the time of the study the ban had just been lifted and most of the<br />
respondents did not rate this as high on their priority list of dr<strong>in</strong>ks.<br />
Smuggl<strong>in</strong>g of <strong>alcohol</strong> across state borders is also sizeable and is virtually untraceable. In our<br />
sample, such evidence of smuggled <strong>alcohol</strong> was found <strong>in</strong> the border district of Uttara Kannada,<br />
adjo<strong>in</strong><strong>in</strong>g the state of Goa. Goa is famous for its distilled <strong>alcohol</strong>ic beverage made from coconuts<br />
and sometimes cashew nuts, called fenny. A lot of this fenny f<strong>in</strong>ds its way <strong>in</strong>to the Uttara Kannada<br />
district. Admittedly, distilleries <strong>in</strong> Karnataka also produce small quantities of fenny, but the<br />
majority of fenny drunk by the respondents <strong>in</strong> this district, has to be undocumented <strong>in</strong> the state<br />
excise records of Karnataka.<br />
3. Levels of <strong>alcohol</strong> consumption<br />
Per capita consumption figures are significantly larger than those represented <strong>in</strong> most exist<strong>in</strong>g<br />
databases<br />
Population based <strong>alcohol</strong> surveys allow the collection of consumption data specific to sociodemographic<br />
groups with<strong>in</strong> a population. They also have the advantage that they can be used to<br />
gather data on dr<strong>in</strong>k<strong>in</strong>g patterns, <strong>in</strong>clud<strong>in</strong>g high quantity <strong>in</strong>take that is l<strong>in</strong>ked to <strong>in</strong>toxication and<br />
acute adverse consequences.<br />
Per capita estimates calculated by divid<strong>in</strong>g <strong>alcohol</strong> volumes by population (usually the average<br />
volume of <strong>alcohol</strong> consumed for all <strong>in</strong>dividuals aged 15 years and older) are another way to assess<br />
<strong>alcohol</strong> consumption. S<strong>in</strong>ce per capita estimates are derived from <strong>alcohol</strong> sales or <strong>production</strong> and<br />
from import and export data, usually collected for taxation purposes; comb<strong>in</strong>ed, these represent the<br />
total amount of taxable <strong>alcohol</strong> available for a country or region. Per capita estimates exclude<br />
home-made and <strong>illicit</strong> commercial <strong>alcohol</strong>, duty free and smuggled <strong>alcohol</strong> and overseas<br />
consumption.<br />
In the context of temperance cultures, with an overall low prevalence of <strong>alcohol</strong> use <strong>in</strong> the<br />
population, such a method is bound to yield erroneously lower estimates of <strong>in</strong>dividual consumption<br />
Population based <strong>alcohol</strong> survey estimates of consumption and estimates of taxable <strong>in</strong>come<br />
available for consumption are sometimes compared. However, discrepancies between these two<br />
measures occur, with the majority of population based <strong>alcohol</strong> surveys substantially underestimat<strong>in</strong>g<br />
taxable <strong>alcohol</strong> available for consumption, attributed to under-report<strong>in</strong>g of consumption<br />
by survey respondents. However <strong>in</strong> countries where a high level of untaxed <strong>alcohol</strong> is consumed, it<br />
is possible for surveys to produce estimates higher than taxable <strong>in</strong>come.<br />
Alcohol consumption data were collected by us<strong>in</strong>g beverage-specific questions. These data were<br />
subsequently used to estimate the absolute <strong>alcohol</strong> content consumed by each respondent. The<br />
79
annual volume of total absolute <strong>alcohol</strong> consumed by an <strong>in</strong>dividual was calculated by multiply<strong>in</strong>g<br />
<strong>alcohol</strong> consumed on a typical occasion by the frequency of dr<strong>in</strong>k<strong>in</strong>g. The annual volume of total<br />
absolute <strong>alcohol</strong> consumed by the sample population was the sum of each respondent’s annual<br />
consumption. This was then extrapolated to the estimated population of <strong>alcohol</strong> consumers <strong>in</strong> the<br />
state (us<strong>in</strong>g the average prevalence figures over the 5 sampl<strong>in</strong>g sites) to derive a presumed figure<br />
for total annual consumption <strong>in</strong> the state.<br />
If one were to project the total beverage <strong>alcohol</strong> drunk by the sample population [24307 litres<br />
absolute <strong>alcohol</strong> equivalent of excise paid beverage + 19061 litres absolute <strong>alcohol</strong> equivalent of<br />
undocumented beverage ] to the presumed 5.11 million consumers <strong>in</strong> the state [28.4% of 17.3 x 10 6<br />
adult males + 1.4% of 16.5 x 10 6 adult females] one arrives at an annual consumption of 100.87<br />
million litres absolute <strong>alcohol</strong> equivalent (56.53 million litres absolute <strong>alcohol</strong> equivalent of excise<br />
paid beverage and 44.34 million absolute <strong>alcohol</strong> equivalent of undocumented beverage).<br />
This is a surpris<strong>in</strong>gly high per capita consumption of 2.98 litres absolute <strong>alcohol</strong> equivalent per<br />
adult person per year (1.67 litres absolute <strong>alcohol</strong> equivalent of excise paid beverage per person per<br />
year and 1.31 litres absolute <strong>alcohol</strong> equivalent of undocumented beverage per person per year .<br />
However, keep<strong>in</strong>g <strong>in</strong> m<strong>in</strong>d the large numbers of absta<strong>in</strong>ers, a more appropriate measure of actual<br />
consumption would be the consumption per dr<strong>in</strong>ker, which <strong>in</strong> this case is an enormous 19.73 litres<br />
absolute <strong>alcohol</strong> equivalent per consumer per year.<br />
These figures are certa<strong>in</strong>ly much higher than those usually quoted <strong>in</strong> International databases [for<br />
example the Global Status Report on Alcohol mentions that the per capita consumption of <strong>alcohol</strong><br />
<strong>in</strong> India is 0.2 litres per person per year (WHO,1999) ] although some have pegged it much higher.<br />
A SEARO publication on Health situation <strong>in</strong> the South-East Asia Region 1994-1997 mentions that<br />
<strong>in</strong> India, the per capita consumption <strong>in</strong> adult male dr<strong>in</strong>kers is much higher, at eight litres per year<br />
[WHO,1999].<br />
The derived figure for consumption of presumed excise paid beverages is at 56.53 million litres<br />
absolute <strong>alcohol</strong> equivalent much higher than the recorded sales of 46.42 million litres absolute<br />
<strong>alcohol</strong> equivalent of excise paid beverage <strong>in</strong> the state for the year 2000-01. This difference is a<br />
measure of the amount of seconds liquor <strong>in</strong> circulation (which to the consumer would be<br />
<strong>in</strong>dist<strong>in</strong>guishable <strong>in</strong> packag<strong>in</strong>g, label and tax sticker from the legal stuff).<br />
If one were to subtract the volume of legal, excise paid (documented) beverage <strong>alcohol</strong> sold and<br />
consumed that year from the projected figure of total beverage <strong>alcohol</strong> drunk <strong>in</strong> the state that year,<br />
one presumes one would arrive at a reasonably accurate estimate of undocumented consumption.<br />
This amounts to 54.45 million litres absolute <strong>alcohol</strong> available to 33.8 million adults <strong>in</strong> the state i.e.<br />
1.6 litres of absolute <strong>alcohol</strong> <strong>in</strong> undocumented consumption per person per year. More realistically,<br />
<strong>in</strong> view of the large numbers of absta<strong>in</strong>ers, this amounts to 54.45 million litres absolute <strong>alcohol</strong><br />
drunk by 5.11 million consumers <strong>in</strong> the state, which works out to 10.65 litres of absolute <strong>alcohol</strong> <strong>in</strong><br />
undocumented consumption per person per year.<br />
4. Patterns of consumption<br />
While the prevalence of <strong>alcohol</strong> dr<strong>in</strong>k<strong>in</strong>g is fairly low, among men and women who do dr<strong>in</strong>k,<br />
consumption is frequent and heavy<br />
Patterns of <strong>alcohol</strong> consumption are probably more important than per capita levels of <strong>alcohol</strong> use<br />
<strong>in</strong> predict<strong>in</strong>g whether people will experience problems with their dr<strong>in</strong>k<strong>in</strong>g.<br />
Temporal variations <strong>in</strong> dr<strong>in</strong>k<strong>in</strong>g [Quantity x Frequency]: The quantity of <strong>alcohol</strong> drunk by both<br />
men and women, on typical dr<strong>in</strong>k<strong>in</strong>g occasions is, as has been earlier documented [Saxena,1999;<br />
Isaac, 1998] very high. In fact what is surpris<strong>in</strong>g is that there is no major difference between the<br />
amounts drunk by men and women. At an average of five standard dr<strong>in</strong>ks consumed each dr<strong>in</strong>k<strong>in</strong>g<br />
occasion technically qualifies for a ‘heavy dr<strong>in</strong>k<strong>in</strong>g situation’.<br />
80
45<br />
40<br />
35<br />
30<br />
25<br />
20<br />
15<br />
10<br />
5<br />
0<br />
The frequency of use however varies between men and women, with men dr<strong>in</strong>k<strong>in</strong>g more frequently<br />
than the women. However the difference though significant should be viewed aga<strong>in</strong>st the<br />
perspective that both men and women consumers were dr<strong>in</strong>k<strong>in</strong>g fairly frequently. While almost<br />
70% of the men drank daily or almost daily 55% of the women consumers did so too. This can<br />
hardly be termed “<strong>in</strong>frequent” dr<strong>in</strong>k<strong>in</strong>g. This is contrary to earlier reports that assert that the<br />
prevalent pattern is <strong>in</strong>frequent use of large quantities [Saxena,1999; Isaac,1998].<br />
The pattern that beg<strong>in</strong>s to emerge is that while the prevalence of <strong>alcohol</strong> dr<strong>in</strong>k<strong>in</strong>g is still fairly low,<br />
among those who do dr<strong>in</strong>k, consumption is fairly frequent and heavy.<br />
This is similar to what has been observed <strong>in</strong> Slavic and Scand<strong>in</strong>avian cultures [Room,2002]. The<br />
difference lies <strong>in</strong> the fact that the prevalence of users is still very low.<br />
Under-socialized and solitary dr<strong>in</strong>k<strong>in</strong>g of ma<strong>in</strong>ly spirits marks the pattern of dr<strong>in</strong>k<strong>in</strong>g; dr<strong>in</strong>k<strong>in</strong>g to<br />
<strong>in</strong>toxication and other features of dr<strong>in</strong>k<strong>in</strong>g found <strong>in</strong> dry cultures is the signature pattern<br />
39<br />
44<br />
Even<strong>in</strong>g<br />
(almost every<br />
day)<br />
19.5<br />
23<br />
Return<strong>in</strong>g<br />
home from<br />
work<br />
13.4<br />
12.4<br />
Dr<strong>in</strong>k<strong>in</strong>g Situations<br />
3.7<br />
Dr<strong>in</strong>k<strong>in</strong>g situations<br />
a. Sett<strong>in</strong>gs and activities associated with dr<strong>in</strong>k<strong>in</strong>g:<br />
The sett<strong>in</strong>g <strong>in</strong> which most dr<strong>in</strong>k<strong>in</strong>g occurred was essentially under-socialized and solitary. For men<br />
most dr<strong>in</strong>k<strong>in</strong>g appeared to occur after work, before com<strong>in</strong>g home, <strong>in</strong> male oriented pubs, bars or<br />
liquor shops essentially among strangers or dr<strong>in</strong>k<strong>in</strong>g acqua<strong>in</strong>tances. A fairly large number drank<br />
alone on streets or deserted places. Very rarely was dr<strong>in</strong>k<strong>in</strong>g done at home. Dr<strong>in</strong>k<strong>in</strong>g <strong>in</strong> bars or<br />
taverns are related to higher levels of dr<strong>in</strong>k<strong>in</strong>g and self reported dr<strong>in</strong>k<strong>in</strong>g problems (S<strong>in</strong>gle and<br />
Wortley, 1993). Respondents who predom<strong>in</strong>antly drank <strong>in</strong> bars, pubs or <strong>in</strong> solitude were<br />
significantly more likely to have a more hazardous pattern of <strong>alcohol</strong> use (estimated by scores on<br />
12.7<br />
Weekends Go<strong>in</strong>g out with<br />
friends<br />
4.9<br />
3.9<br />
Festivals,<br />
marriages, etc.<br />
17.1<br />
3.5<br />
Relax<strong>in</strong>g at<br />
home<br />
Female<br />
Male<br />
2.4<br />
Other<br />
0.6<br />
81
the AUDIT), and be less educated than subjects who drank <strong>in</strong> more socialized sett<strong>in</strong>gs. They also<br />
tended to dr<strong>in</strong>k more on typical occasions, and at least among men, were significantly younger.<br />
For women, dr<strong>in</strong>k<strong>in</strong>g was even more of a solitary pursuit. Dr<strong>in</strong>k<strong>in</strong>g was ma<strong>in</strong>ly done alone at home<br />
or <strong>in</strong> lonely places, away from public gaze. Solitary dr<strong>in</strong>k<strong>in</strong>g, <strong>in</strong> women much more than <strong>in</strong> men,<br />
was related to hazardous dr<strong>in</strong>k<strong>in</strong>g, and tended to predict higher consumption.<br />
From the above, it is clear that the purpose of dr<strong>in</strong>k<strong>in</strong>g is not social <strong>in</strong>tercourse! As some<br />
commentators have described, dr<strong>in</strong>k<strong>in</strong>g <strong>in</strong> the Indian context is all about dr<strong>in</strong>k<strong>in</strong>g to get <strong>in</strong>toxicated.<br />
b. Dr<strong>in</strong>k<strong>in</strong>g style<br />
Licit and <strong>illicit</strong> spirits and country liquor (near <strong>in</strong> <strong>alcohol</strong> content to the spirits) are clearly the<br />
beverages of choice. Dr<strong>in</strong>k<strong>in</strong>g is a hasty furtive pursuit. <strong>An</strong>d this is marked by the large proportion<br />
of men and women who dr<strong>in</strong>k alone or <strong>in</strong> the relative anonymity of darkly lit taverns and bars,<br />
gulp<strong>in</strong>g down large amounts of cheap <strong>alcohol</strong> (dr<strong>in</strong>k<strong>in</strong>g the maximum possible <strong>in</strong> the shortest<br />
possible time), without dilution; and hurry<strong>in</strong>g home.<br />
c. Dr<strong>in</strong>k<strong>in</strong>g and food<br />
This dr<strong>in</strong>k<strong>in</strong>g pattern is very different from the “Mediterranean” pattern of dr<strong>in</strong>k<strong>in</strong>g accompany<strong>in</strong>g<br />
a meal. Most respondents <strong>in</strong> fact expressed the opposite that they preferred to f<strong>in</strong>ish dr<strong>in</strong>k<strong>in</strong>g before<br />
eat<strong>in</strong>g anyth<strong>in</strong>g, and if they did eat anyth<strong>in</strong>g with their dr<strong>in</strong>ks it was merely a few snacks usually<br />
consist<strong>in</strong>g of fried items or nuts [salty and likely to <strong>in</strong>crease thirst !].<br />
d. Normalisation of dr<strong>in</strong>k<strong>in</strong>g activity<br />
In the Indian social-political discourse, this is an area loaded with polemical arguments and often<br />
well entrenched emotionally charged positions.<br />
Despite, rapidly <strong>in</strong>creas<strong>in</strong>g <strong>production</strong> and sales figures of beverage <strong>alcohol</strong>, <strong>alcohol</strong> use still has a<br />
low prevalence <strong>in</strong> the population. This <strong>in</strong> no way, dim<strong>in</strong>ishes the assertion that more people are<br />
start<strong>in</strong>g to dr<strong>in</strong>k at younger ages [see earlier].<br />
The other assertion often heard is that <strong>alcohol</strong> use is more <strong>in</strong> lower socio economic and less<br />
educated groups. While, dr<strong>in</strong>k<strong>in</strong>g is more common among lower socio economic groups than upper<br />
socio economic groups . It is apparent that it is more prevalent <strong>in</strong> <strong>rural</strong> areas than <strong>in</strong> the urban<br />
areas. Tribal areas appear to have the highest penetrance <strong>in</strong> terms of use. This is a phenomenon<br />
which has been repeatedly observed before, by other studies (Rahman,2002; Musgrave & Stern,<br />
1988, Thimmaiah, 1979) It is not clear from this data set whether this is because of a cont<strong>in</strong>uation<br />
of permissive attitudes to <strong>alcohol</strong> use, persist<strong>in</strong>g from earlier historical contexts, where<strong>in</strong> as<br />
members of lower castes, <strong>in</strong> the Indian social hierarchy, they are less bound by the pr<strong>in</strong>ciples of<br />
temperance traditionally prescribed for the Brahm<strong>in</strong>s and higher castes. The alternative explanation,<br />
often offered has been that such heavy <strong>alcohol</strong> use is a consequence of tribal populations hav<strong>in</strong>g<br />
suddenly ga<strong>in</strong>ed access to <strong>in</strong>dustrially mass produced cheap <strong>alcohol</strong>, and is seen as a function of the<br />
corrupt<strong>in</strong>g effect of civilization on a simpler, untrammeled lifestyle. This is probably <strong>in</strong>accurate as<br />
well as be<strong>in</strong>g paternalistic, as home-brewed <strong>alcohol</strong> seems to be the predom<strong>in</strong>ant beverage drunk <strong>in</strong><br />
the tribal population.<br />
Less than 5% of males reported dr<strong>in</strong>k<strong>in</strong>g <strong>in</strong> mixed company. In contrast is the fact that almost 50%<br />
of the women drank <strong>in</strong> the presence of men. However, this is easily expla<strong>in</strong>ed as most women<br />
consumers belonged to families where, their male spouses or other male relatives drank. Dr<strong>in</strong>k<strong>in</strong>g<br />
thus took place <strong>in</strong> the company of men (and perhaps cont<strong>in</strong>gent on male dr<strong>in</strong>k<strong>in</strong>g occasions!).<br />
e. Attitudes and expectancies<br />
The dom<strong>in</strong>ant expectancy related to <strong>alcohol</strong> use among men and women consumers was that most<br />
people drank to <strong>in</strong>toxication, most of the time that they drank. Such expectancies have been<br />
documented earlier from temperance cultures, and is strongly contributory to the spectrum of high<br />
risk behaviours associated with <strong>alcohol</strong> use <strong>in</strong> such groups.<br />
82
f. Subjective perception of dr<strong>in</strong>k related problems<br />
The predom<strong>in</strong>ant dr<strong>in</strong>k<strong>in</strong>g related problems reported, were economic. Physical ill health and<br />
problems at work, even problems <strong>in</strong> the family related to <strong>alcohol</strong> use were not perceived as major<br />
problems. The dra<strong>in</strong> on economic resources among consumers is understandable as consumers, on<br />
average, apparently spent more than one fourth of their family <strong>in</strong>come on buy<strong>in</strong>g <strong>alcohol</strong>. The<br />
impact of <strong>alcohol</strong> spend<strong>in</strong>g on family <strong>in</strong>come was greater among <strong>rural</strong> consumers than urban<br />
consumers.<br />
The impact of <strong>alcohol</strong> use [and heavy <strong>alcohol</strong> use at that] on physical health is clearly m<strong>in</strong>imized.<br />
Independent evidence from another study on <strong>alcohol</strong> and <strong>in</strong>juries conducted <strong>in</strong> the same population,<br />
dur<strong>in</strong>g the same time w<strong>in</strong>dow, estimated that nearly 60% of all <strong>in</strong>juries present<strong>in</strong>g to the largest<br />
medical emergency department <strong>in</strong> the state, were <strong>alcohol</strong> related. Data from this study revealed that<br />
the major proportion of <strong>in</strong>jury was due to someone else’s dr<strong>in</strong>k<strong>in</strong>g and that the largest proportion of<br />
these <strong>in</strong>juries comprised violent <strong>in</strong>juries. Earlier studies of dr<strong>in</strong>k<strong>in</strong>g <strong>in</strong> temperance cultures have<br />
highlighted the strongly held belief that <strong>alcohol</strong> use is expected to lead to <strong>in</strong>toxication, dis<strong>in</strong>hibition<br />
and violence.<br />
It is not surpris<strong>in</strong>g that more than 15% of all users had experience of problems due to other people’s<br />
<strong>alcohol</strong> use, most of which was violent <strong>in</strong> nature.<br />
Hazardous dr<strong>in</strong>k<strong>in</strong>g is observed <strong>in</strong> 80% of all consumers<br />
All the above factors add up to a predom<strong>in</strong>ant pattern of hazardous use. 80% of all consumers (80%<br />
of male consumers and 65% of female consumers were clearly dr<strong>in</strong>k<strong>in</strong>g at hazardous levels. This is<br />
a strong re-iteration of earlier f<strong>in</strong>d<strong>in</strong>gs <strong>in</strong> this same population as also from the rest of the country<br />
that more than one out of two people who dr<strong>in</strong>k, do so at hazardous levels.<br />
The heavy dr<strong>in</strong>kers were more likely to dr<strong>in</strong>k multiple beverages. Those who drank multiple<br />
beverages had significantly lower <strong>in</strong>come, less education, greater occurrence of hazardous dr<strong>in</strong>k<strong>in</strong>g<br />
patterns, and spent a larger proportion of their <strong>in</strong>come <strong>in</strong> buy<strong>in</strong>g <strong>alcohol</strong>. It is not surpris<strong>in</strong>g that a<br />
greater proportion of their consumption, belonged to the <strong>illicit</strong>/undocumented variety, because of<br />
the price advantage.<br />
5. Alcohol and health<br />
There is<br />
significant<br />
<strong>alcohol</strong> related<br />
health damage <strong>in</strong><br />
consumers<br />
Alcohol users<br />
were more likely<br />
to have had a<br />
significant illness<br />
<strong>in</strong> the previous<br />
year than people<br />
who were<br />
abst<strong>in</strong>ent.<br />
Heavy dr<strong>in</strong>kers<br />
(those who drank<br />
more than 5<br />
standard dr<strong>in</strong>ks<br />
per representative<br />
16<br />
14<br />
12<br />
10<br />
8<br />
6<br />
4<br />
2<br />
0<br />
Absta<strong>in</strong>e<br />
7.3<br />
Alcohol Use and Illness<br />
15.3 15.1<br />
Significant Illness <strong>in</strong> the last year<br />
15.6<br />
Alcohol User < 5 dr<strong>in</strong>ks > 5 dr<strong>in</strong>ks<br />
83
dr<strong>in</strong>k<strong>in</strong>g occasion) were significantly more likely to suffer emotional problems like depression and<br />
anxiety, stomach pa<strong>in</strong> presumably <strong>in</strong>dicative of <strong>alcohol</strong> related erosive gastritis, and other somatic<br />
problems like headache and generalized aches and pa<strong>in</strong>s. While not statistically significant this<br />
population also reported more frequent heart ailments, diabetes and <strong>in</strong>creased blood pressure.<br />
Alcohol users, both male (78%) and female (75%) were also more likely to use various forms of<br />
tobacco than non-users (22% and 8% respectively), thus <strong>in</strong>creas<strong>in</strong>g the risk of health damage.<br />
6. Costs of <strong>alcohol</strong> use<br />
Alcohol users spend more than a fourth of their monthly family <strong>in</strong>come on <strong>alcohol</strong><br />
Alcohol users spent an average of more than Rs. 400 per month on <strong>alcohol</strong>. This amounted to more<br />
than a fourth of their monthly family <strong>in</strong>come. These are merely a fraction of direct costs due to<br />
<strong>alcohol</strong> use. The social cost [direct + <strong>in</strong>direct costs] is likely to be significantly more. <strong>An</strong> earlier<br />
study <strong>in</strong> this same population estimated that the social cost due to the <strong>alcohol</strong> dependent population<br />
alone (less than 4% of the adult male population) to be around Rs. 18000 million [1997 figures].<br />
If one extrapolates this monthly cost to the presumed 5.11 million consumers <strong>in</strong> the state, one<br />
arrives at an annual spend on <strong>alcohol</strong>ic beverages amount<strong>in</strong>g to Rs. 25386.50 million.<br />
Rural consumers were also more likely to spend a greater proportion of their family <strong>in</strong>come on<br />
<strong>alcohol</strong> than urban consumers.<br />
7. Gender aspects of <strong>alcohol</strong> use<br />
There are strik<strong>in</strong>g gender differences relat<strong>in</strong>g to <strong>alcohol</strong> use, <strong>alcohol</strong> expectancies, stigma and<br />
health consequences due to <strong>alcohol</strong> use<br />
Women consumers usually have their <strong>in</strong>itial dr<strong>in</strong>k and beg<strong>in</strong> regular dr<strong>in</strong>k<strong>in</strong>g at significantly later<br />
ages than men. This is strik<strong>in</strong>gly different than <strong>in</strong> the case of tobacco where such a wide difference<br />
<strong>in</strong> age at <strong>in</strong>itiation of use is not seen between men and women. This is a further comment on how<br />
unacceptable the use of <strong>alcohol</strong> is <strong>in</strong> Indian society, compared to that of tobacco products.<br />
What is strik<strong>in</strong>g, <strong>in</strong> comparison to comparable figures from other countries, is that when women<br />
dr<strong>in</strong>k, they tend to match the men, dr<strong>in</strong>k for dr<strong>in</strong>k, so to speak. Average quantities drunk dur<strong>in</strong>g<br />
typical dr<strong>in</strong>k<strong>in</strong>g occasions are roughly the same. As discussed above, these quantities tend to be<br />
large, 5 or more standard dr<strong>in</strong>ks on average per occasion !<br />
The difference lies <strong>in</strong> the frequency of dr<strong>in</strong>k<strong>in</strong>g occasions, with women dr<strong>in</strong>k<strong>in</strong>g on far fewer days<br />
of the month than the men.<br />
The health implications are grave. It is well appreciated (Heath,2000; Stockwell et al, 1996) that<br />
b<strong>in</strong>ge dr<strong>in</strong>k<strong>in</strong>g and dr<strong>in</strong>k<strong>in</strong>g to <strong>in</strong>toxication are associated with more adverse consequences,<br />
particularly acute consequences. There is also mount<strong>in</strong>g evidence that women suffer earlier and<br />
relatively graver medical and physical consequences, at lower doses of ethanol than men.<br />
In an unpublished study of female <strong>alcohol</strong>ics <strong>in</strong> this same population (Murthy, et al. personal<br />
communication) the average age at onset of use <strong>in</strong> women was significantly later than that <strong>in</strong> males,<br />
however, the age at which both males and females had developed severe enough problems which<br />
prompted them to seek help for the first time were quite similar. This f<strong>in</strong>d<strong>in</strong>g is <strong>in</strong> keep<strong>in</strong>g with<br />
most of the 'Western' literature which po<strong>in</strong>ts to a more rapid development or "telescop<strong>in</strong>g" of the<br />
course of <strong>alcohol</strong> related illness <strong>in</strong> women.Aga<strong>in</strong>, women were significantly more likely to present<br />
with co-morbid psychiatric symptoms or dual diagnoses than the men. Depression and depressive<br />
disorder were significantly high. Physical complications , especially gastritis and anemia were also<br />
much higher than <strong>in</strong> their male counterparts. Women appear to develop late-stage physical damage<br />
more rapidly than men and have a higher prevalence of psychiatric dual diagnoses.<br />
In a sense this is evident from the data <strong>in</strong> this study as well. Women consumers had a higher<br />
prevalence [albeit statistically non-significant ] of significant illness <strong>in</strong> the past year than the men.<br />
84
Results from another collaborative multi-centre WHO study on Alcohol and Injuries, noted that a very high<br />
proportion of the <strong>in</strong>juries report<strong>in</strong>g to an emergency department <strong>in</strong> <strong>Bangalore</strong> city, were <strong>alcohol</strong> related.<br />
Almost a fourth of all persons [31% of all males and 4% of all females] present<strong>in</strong>g with <strong>in</strong>juries to the ED had<br />
<strong>alcohol</strong> use prior to the occurrence of their <strong>in</strong>jury. This is much higher than that reported <strong>in</strong> <strong>in</strong>ternational<br />
studies where between 10 and 18 percent of <strong>in</strong>jury cases were found to be <strong>alcohol</strong>-related (Benegal et al,<br />
2002).<br />
A parallel and most significant f<strong>in</strong>d<strong>in</strong>g is that <strong>in</strong>juries with <strong>in</strong>direct association to <strong>alcohol</strong>, i.e. <strong>alcohol</strong> use by<br />
the perpetrator of the <strong>in</strong>jury and not by the <strong>in</strong>jured person, appear to be very common. Injuries ‘def<strong>in</strong>itely<br />
l<strong>in</strong>ked’ to <strong>alcohol</strong> use (<strong>in</strong>juries to subjects consequent to their own <strong>alcohol</strong> use as well as <strong>in</strong>juries to non<br />
dr<strong>in</strong>ker victims of others’ <strong>alcohol</strong> use account for 37% of all <strong>in</strong>juries (91.6% of the men and 8.4% of the<br />
women). Inclusion of <strong>in</strong>juries which were ‘possibly l<strong>in</strong>ked’ (where the <strong>alcohol</strong> <strong>in</strong>toxication <strong>in</strong> the perpetrator<br />
was reported by secondary sources -relatives, bystanders etc. and not by the primary <strong>in</strong>jured, often afraid of<br />
<strong>in</strong>dict<strong>in</strong>g a close family member] raises the proportion of <strong>alcohol</strong> related <strong>in</strong>juries to 59% of all <strong>in</strong>juries i.e<br />
(82.2% of the men and 17.8% of the women).<br />
A large proportion of the <strong>in</strong>juries (all <strong>in</strong>juries or <strong>alcohol</strong> related <strong>in</strong>juries comprised <strong>in</strong>juries due to<br />
<strong>in</strong>terpersonal violence. [WHO multi <strong>center</strong> collaborative studies on Alcohol related <strong>in</strong>juries]<br />
There are are other important differences, <strong>in</strong> dr<strong>in</strong>k<strong>in</strong>g situations, dr<strong>in</strong>k<strong>in</strong>g expectancies, stigma and<br />
consequences of dr<strong>in</strong>k<strong>in</strong>g (<strong>in</strong>clud<strong>in</strong>g <strong>alcohol</strong> related <strong>in</strong>juries/violence) between men and women.<br />
While male dr<strong>in</strong>k<strong>in</strong>g occurred primarily, <strong>in</strong> public places like pubs, bars, liquor shop counters and<br />
restaurants (70%), women preferred to dr<strong>in</strong>k mostly at home or <strong>in</strong> solitary places (56%). In the<br />
same ve<strong>in</strong>, while most men (86%) reported dr<strong>in</strong>k<strong>in</strong>g <strong>in</strong> social situations, whether <strong>in</strong> predom<strong>in</strong>antly<br />
male or mixed company, women reported that their typical dr<strong>in</strong>k<strong>in</strong>g situations were solitary (43%).<br />
Dr<strong>in</strong>k<strong>in</strong>g <strong>in</strong> women was <strong>in</strong>fluenced by use <strong>in</strong> other family members (65%) who were most of the<br />
time male (52%), unlike <strong>in</strong> men (less than 40%). This strongly suggests that for women consumers<br />
to dr<strong>in</strong>k, it required to be done with the forbearance of a male companion or <strong>in</strong> secret solitude. <strong>An</strong><br />
earlier study from <strong>Bangalore</strong> [Selvaraj et al, 1997] found that while peer pressure was an important<br />
<strong>in</strong>fluence <strong>in</strong> dr<strong>in</strong>k<strong>in</strong>g behaviour <strong>in</strong> men, dr<strong>in</strong>k<strong>in</strong>g <strong>in</strong> women was associated with heavy dr<strong>in</strong>k<strong>in</strong>g<br />
among key family members, usually male.<br />
There are strong social and cultural taboos aga<strong>in</strong>st women dr<strong>in</strong>k<strong>in</strong>g. Social expectations about how<br />
men and women should behave also seem to determ<strong>in</strong>e choice of place and preferred mode of<br />
dr<strong>in</strong>k<strong>in</strong>g. There was more solitary dr<strong>in</strong>k<strong>in</strong>g among the women (though a sizeable number drank <strong>in</strong><br />
the company of their spouses or close family, it was still with<strong>in</strong> the conf<strong>in</strong>es of the home), while<br />
most of the men drank away from the home usually with same sex peers.<br />
Gender expectations also governed the extent to which the women could <strong>in</strong>dulge <strong>in</strong> externaliz<strong>in</strong>g<br />
behavior due to the dis<strong>in</strong>hibitory effect of <strong>alcohol</strong>. Very few of the women were reported to behave<br />
<strong>in</strong> aggressive or dis<strong>in</strong>hibitory fashion after consum<strong>in</strong>g <strong>alcohol</strong>, whereas that was a major compla<strong>in</strong>t<br />
<strong>in</strong> the men.<br />
In the study of female <strong>alcohol</strong>ics noted above, positive expectancies <strong>in</strong>fluenc<strong>in</strong>g <strong>in</strong>itiation of<br />
<strong>alcohol</strong> use, cited by men and women differed significantly. While women attributed mood<br />
elevat<strong>in</strong>g and antidepressant properties to <strong>alcohol</strong>, men on the other hand used it to improve sleep<br />
or decrease tiredness and fatigue. The second most common attribution among women was that<br />
<strong>alcohol</strong> had major restorative properties after child-birth. (One must make mention here that <strong>alcohol</strong><br />
use after parturition has found mention <strong>in</strong> the ancient H<strong>in</strong>du medical texts: the Ayurveda and the<br />
Charaka samhita and cont<strong>in</strong>ues to be a ritual observance among many social groups <strong>in</strong> India till<br />
today).<br />
The next most common reason for <strong>in</strong>itiation of dr<strong>in</strong>k<strong>in</strong>g was <strong>in</strong> order to keep company with their<br />
husbands. <strong>An</strong>d several women who previously considered <strong>alcohol</strong> as unclean often rationalised<br />
their dr<strong>in</strong>k<strong>in</strong>g as be<strong>in</strong>g consonant with fulfill<strong>in</strong>g their social expectations as a wife.<br />
85
8. Social, economic and political issues<br />
When one factors <strong>in</strong> earlier observations of dr<strong>in</strong>k<strong>in</strong>g patterns from India, one is tempted to<br />
speculate that there has been a dynamic shift from earlier permissive patterns represented by a<br />
relatively widespread use of a variegated spectrum of low <strong>alcohol</strong> beverages. The creation of<br />
<strong>alcohol</strong> monopolies dur<strong>in</strong>g the colonial period, resulted <strong>in</strong> the replacement of the traditional<br />
beverages with <strong>in</strong>dustrially produced high <strong>alcohol</strong> content beverages of questionable merit. Also, <strong>in</strong><br />
further<strong>in</strong>g the revenue aims of such monopolies, the pattern of use of <strong>alcohol</strong>ic beverages changed,<br />
as one notes from contemporary accounts. Home grown movements aga<strong>in</strong>st <strong>alcohol</strong> use such as the<br />
Devi movement <strong>in</strong> Gujrat, along with Temperance campaigns from the West, comb<strong>in</strong>ed with the<br />
process of sanskritisation to radically alter public attitudes towards <strong>alcohol</strong> use. This has resulted <strong>in</strong><br />
a pattern of <strong>alcohol</strong> use typically seen <strong>in</strong> temperance cultures, marked by a low prevalence of<br />
<strong>alcohol</strong> use <strong>in</strong> the population, but one <strong>in</strong> which <strong>alcohol</strong> users engage <strong>in</strong> b<strong>in</strong>ge dr<strong>in</strong>k<strong>in</strong>g, dr<strong>in</strong>k<strong>in</strong>g to<br />
<strong>in</strong>toxication <strong>in</strong> relatively solitary circumstances and act out on the basis of expectancies<br />
encourag<strong>in</strong>g hazardous use and dangerous <strong>alcohol</strong> <strong>in</strong>duced behaviors. All of which contribute to an<br />
<strong>in</strong>creased burden on health.<br />
There is concern that as a country like India moves from be<strong>in</strong>g a high mortality develop<strong>in</strong>g region<br />
to a low mortality develop<strong>in</strong>g region (a process currently well under way), the burden of health<br />
attributable to <strong>alcohol</strong> will represent the s<strong>in</strong>gle largest contributor to disability shift<strong>in</strong>g focus from<br />
micro-nutrient deficiencies. This is evident from the recent World Health Report 2002 (Ezzati et.<br />
al., 2002).<br />
Government monopolies have been shown to better serve the aim of regulation of <strong>alcohol</strong> use <strong>in</strong> the<br />
population. However, <strong>in</strong> India, where excise on <strong>alcohol</strong> forms the second largest source of revenue,<br />
sheer economic necessity will militate aga<strong>in</strong>st efforts to seriously enforce supply reduction<br />
strategies. The forces of the free market economy and commitments to world trade agreements have<br />
already opened the flood-gates for trans-national <strong>alcohol</strong> producers to dump cheap <strong>alcohol</strong>ic<br />
beverages <strong>in</strong> India as markets shr<strong>in</strong>k <strong>in</strong> the developed world. This, has already resulted, not <strong>in</strong><br />
supplant<strong>in</strong>g <strong>in</strong>digenous <strong>production</strong> but <strong>in</strong> <strong>in</strong>creas<strong>in</strong>g the availability of beverage <strong>alcohol</strong> <strong>in</strong><br />
circulation and consequent <strong>in</strong>creases <strong>in</strong> volumes sold and consumed. Experience <strong>in</strong> other<br />
develop<strong>in</strong>g economies has clearly demonstrated that the diffusion of European style commercial<br />
<strong>alcohol</strong>ic dr<strong>in</strong>ks adds to and modifies older patterns of dr<strong>in</strong>k<strong>in</strong>g, more than it substitutes, thus<br />
tend<strong>in</strong>g to <strong>in</strong>crease total consumption and dr<strong>in</strong>k<strong>in</strong>g situations. While considerable short term<br />
economic benefits accrue from the growth of <strong>alcohol</strong>ic beverage <strong>in</strong>dustries, <strong>in</strong> forms of profit,<br />
employment and taxes; at the same time, however, there is a gradual rise of long-term social and<br />
economic costs as a result of <strong>alcohol</strong> consumption.Attempts by the government to restrict the<br />
transnational companies by licens<strong>in</strong>g, jo<strong>in</strong>t ventures, sales of technology and similar means are<br />
usually <strong>in</strong>effectual as these means are shown to be as effective for the corporations as outright legal<br />
ownership <strong>in</strong> exercis<strong>in</strong>g <strong>in</strong>flueance. (McBride and Mosher, 1985).<br />
In a historical perspective, India has had no ma<strong>in</strong>streams of ideas either <strong>in</strong> medical or sociological<br />
research on <strong>alcohol</strong>ism. The trend dur<strong>in</strong>g the last 50 years or so, is reflected <strong>in</strong> the preoccupation<br />
with prohibition policies, which were <strong>in</strong>terwoven with<strong>in</strong> the freedom movement and f<strong>in</strong>ally laid out<br />
<strong>in</strong> Article 47 of the Directive Pr<strong>in</strong>ciples of the Indian Constitution. One reason is its close<br />
association with the political and moral movement reflected <strong>in</strong> the prohibition approach. Second, it<br />
did not appear as an issue of immediate or remote concern <strong>in</strong> national health policy. Health<br />
planners have tended to focus more on immediate problems eg. communicable diseases, nutrition<br />
and <strong>in</strong>fections rather than simultaneously plann<strong>in</strong>g preventive activites, <strong>in</strong> problems such as<br />
<strong>alcohol</strong>, road traffic accidents and <strong>in</strong>dustrial safety which will bear fruit <strong>in</strong> decades to come (Mohan<br />
& Sharma, 1985).<br />
86
Policies based solely on the pr<strong>in</strong>ciples of supply reduction, especially ones entrenched <strong>in</strong> the<br />
prohibition discourse are more likely to <strong>in</strong>crease the volume of undocumented <strong>illicit</strong> beverages<br />
be<strong>in</strong>g consumed. Apart from the obvious and immediate health consequences of toxic forms of<br />
<strong>alcohol</strong>ic beverages <strong>in</strong> widespread circulation, there is also the long-term consequence that such<br />
moves promote the flourish of crim<strong>in</strong>al black-market economies – a solution worse than the<br />
problem.<br />
As the f<strong>in</strong>d<strong>in</strong>gs from this study underl<strong>in</strong>e, the patterns of <strong>alcohol</strong> use <strong>in</strong> the country, leave no room<br />
for doubt that <strong>alcohol</strong> abuse and its consequences represents a serious and <strong>in</strong>cremental public health<br />
problem. Policy makers and health planners <strong>in</strong> India urgently need to plan and fund research and<br />
<strong>in</strong>terventions to deal with this impend<strong>in</strong>g epidemic.<br />
9. Critical aspects of study design<br />
Embedd<strong>in</strong>g the <strong>alcohol</strong> use questionnaire with<strong>in</strong> a general health assessment <strong>in</strong>creased the<br />
acceptance among the respondents. There were very few refusals, <strong>in</strong> fact they were less than one<br />
percent of all households approached.<br />
A screener was used to collect, basic socio-demographic data on the family, as well as screen for<br />
the presence of <strong>alcohol</strong> and tobacco use and any significant illness <strong>in</strong> the last year. This data was<br />
collected primarily from the head of household. Attempts were made to triangulate this <strong>in</strong>formation<br />
from other family members. Only family members thus nom<strong>in</strong>ated were approached to answer the<br />
detailed Individual questionnaire.<br />
Approach<strong>in</strong>g the head of household (usually male) ensured greater compliance among the other<br />
family members. However, this method, with h<strong>in</strong>dsight, we realized also contributed to under<br />
estimation of <strong>alcohol</strong> use among the younger males and the females <strong>in</strong> families. The male head of<br />
household, was likely to ‘protect’ the women and be ‘protected from the knowledge’ of <strong>alcohol</strong><br />
consumption <strong>in</strong> the younger males.<br />
Consequently, this method is also likely to have contributed to some underestimation of prevalence<br />
of <strong>alcohol</strong> use as a whole.<br />
The better but more time-consum<strong>in</strong>g option would certa<strong>in</strong>ly have been to approach all adult<br />
members of the family separately. But this study was designed as a rapid pilot study to determ<strong>in</strong>e<br />
the need for larger country-wide studies.<br />
The study provides a methodology to accurately assess the proportion of undocumented<br />
consumption <strong>in</strong> other parts of the country. The results certa<strong>in</strong>ly underl<strong>in</strong>e the need to conduct<br />
similar studies <strong>in</strong> the rest of the country.<br />
The door-knock<strong>in</strong>g assessment of type and quantity of use is an effective method for tapp<strong>in</strong>g the<br />
proportion of <strong>illicit</strong> <strong>alcohol</strong> use <strong>in</strong> a community. However, as mentioned earlier <strong>in</strong> the discussion,<br />
this method does not accurately gauge the proportion of “seconds” liquor be<strong>in</strong>g used by that<br />
community. The “seconds” beverages are not that much of a problem <strong>in</strong> most other parts of the<br />
country.<br />
The study also re-iterated observations from an earlier WHO Collaborative study <strong>in</strong> the same<br />
region, regard<strong>in</strong>g the widespread pattern of hazardous dr<strong>in</strong>k<strong>in</strong>g.<br />
Us<strong>in</strong>g the Human development Index to determ<strong>in</strong>e the first level of sample selection, we feel<br />
enabled a more accurate representation of the complex socioeconomic variation <strong>in</strong> the state, than<br />
merely factor<strong>in</strong>g <strong>in</strong> urban and <strong>rural</strong> representation. In the f<strong>in</strong>al analyses, the sample was<br />
representative of the male – female ratios <strong>in</strong> the state as well as broadly similar <strong>in</strong> terms of per<br />
capita <strong>in</strong>come.<br />
The study is <strong>in</strong>tended as a pilot for larger and more extended studies. India is a large country with<br />
wide diversity. This study highlights the need to expand the scope of this l<strong>in</strong>e of enquiry, <strong>in</strong><br />
different socio-cultural zones. Meanwhile, we feel that these results are compell<strong>in</strong>g enough to be<br />
used to advocate urgent and widespread public health approaches to the <strong>alcohol</strong> problem <strong>in</strong> India.<br />
87
10. Summary<br />
Alcohol use is low <strong>in</strong> the Indian population. This is <strong>in</strong> keep<strong>in</strong>g with the traditional assertion that<br />
India represents a Temperance culture.<br />
There are extreme gender differences <strong>in</strong> the prevalence of <strong>alcohol</strong> use. The data supports the view<br />
that <strong>alcohol</strong> use is a predom<strong>in</strong>antly male activity <strong>in</strong> the context of India.<br />
Users are gett<strong>in</strong>g younger. The age at <strong>in</strong>itiation of <strong>alcohol</strong> use has decreased significantly <strong>in</strong><br />
comparison with older cohorts. Earlier use usually results <strong>in</strong> greater <strong>alcohol</strong> related morbidity <strong>in</strong><br />
the population.<br />
There are strong <strong>rural</strong> - urban differences <strong>in</strong> prevalence of use. Rural and especially tribal<br />
populations have a greater prevalence of use.<br />
The prevalence of <strong>alcohol</strong> consumption is related <strong>in</strong>versely to education and <strong>in</strong>come levels<br />
The beverage <strong>alcohol</strong> market is dom<strong>in</strong>ated by spirits.<br />
More than 40% of all <strong>alcohol</strong>ic beverages consumed <strong>in</strong> the state are undocumented. This is likely to<br />
be an under-estimation as the methodology of the current study was unlikely to accurately measure<br />
the proportion of excise evaded “seconds” liquor. Nonetheless, the current study provides a<br />
w<strong>in</strong>dow to the extent of undocumented consumption <strong>in</strong> the state.<br />
Undocumented consumption is significantly more <strong>in</strong> <strong>rural</strong> (and tribal) populations<br />
Illicitly brewed spirits are over represented among beverages that evade the record.<br />
Per capita consumption figures are significantly larger than those represented <strong>in</strong> most exist<strong>in</strong>g<br />
databases of <strong>alcohol</strong> consumption <strong>in</strong> India. This will certa<strong>in</strong>ly impact on any calculations assess<strong>in</strong>g<br />
health burden attributable to <strong>alcohol</strong>.<br />
While the prevalence of <strong>alcohol</strong> dr<strong>in</strong>k<strong>in</strong>g is fairly low, among the men and women who do dr<strong>in</strong>k,<br />
consumption is frequent and heavy<br />
Under-socialized and solitary dr<strong>in</strong>k<strong>in</strong>g of ma<strong>in</strong>ly spirits marks the pattern of dr<strong>in</strong>k<strong>in</strong>g; dr<strong>in</strong>k<strong>in</strong>g to<br />
<strong>in</strong>toxication and other features of dr<strong>in</strong>k<strong>in</strong>g found <strong>in</strong> dry cultures is the signature pattern<br />
Hazardous dr<strong>in</strong>k<strong>in</strong>g is observed <strong>in</strong> 80% of all consumers. Hazardous patterns of dr<strong>in</strong>k<strong>in</strong>g are the<br />
rule among most consumers.<br />
There are significantly more health problems <strong>in</strong> <strong>alcohol</strong> consumers compared to absta<strong>in</strong>ers. Heavy<br />
dr<strong>in</strong>kers have significantly more gastritis, <strong>in</strong>somnia, depression and anxiety.<br />
Alcohol users spend more than a fourth of their monthly family <strong>in</strong>come on <strong>alcohol</strong>. These are only<br />
part of the direct costs.<br />
There are strik<strong>in</strong>g gender differences relat<strong>in</strong>g to <strong>alcohol</strong> use, <strong>alcohol</strong> expectancies, stigma and<br />
health consequences due to <strong>alcohol</strong> use<br />
88
Reference:<br />
Abraham J (1995): ‘Impact of Prohibition on State Excise: Study of Four Southern States’, Economic and<br />
Political Weekly, December 2:3051-53.<br />
Achaya KT (1998) Indian Food: A Historical Companion. Delhi 1998. Oxford University Press<br />
Benegal V, Gururaj G, Murthy P (2002) Project Report on a WHO multi centre collaborative project: on<br />
Establish<strong>in</strong>g and Monitor<strong>in</strong>g Alcohol’s Involvement <strong>in</strong> Casualties; 2000-2001<br />
Benegal V Velayudhan A, Ja<strong>in</strong> S, (2000) Social Costs of Alcoholism: A Karnataka Perspective. NIMHANS<br />
Journal, 18 (1&2) 67<br />
Benegal V, A Shantala, Murthy P, Janakiramaiah N (2001) Report on Development of a Model District<br />
Programme for Prevention of Drug and Alcohol Problems: WHO – NIMHANS Project<br />
Benegal V, A Shantala, Murthy P, Janakiramaiah N (2000) Alcohol Use and Misuse <strong>in</strong> Karnataka : A Status<br />
Paper. Submitted to the Karnataka Task Force on Health and Social Welfare<br />
Benegal V(1998) Dimensions of Substance Abuse Problems and the Need to Network. De-Addiction<br />
Quarterly, 3, 2&3:3-6<br />
Brown J (1972) Gandhi’s Rise to Power: Indian Politics 1915-1922. Cambridge 1972. pp315-16<br />
Castairs, G.M. (1979) Daru and bhang: Cultural factors <strong>in</strong> the choice of <strong>in</strong>toxicant. In: Marshall, M.,ed.<br />
Beliefs, Behaviors, and Alcoholic Beverages. <strong>An</strong>n Arbor, MI: University of Michigan Press, 1979. pp. 297–<br />
312.<br />
Chandra B (1966) The Rise and Growth of Economic Nationalism <strong>in</strong> India. New Delhi, 1966. pp.556-61<br />
Chandra P, Benegal V, Ramakrishna J, Krishna VAS [1998] Development and Evaluation of a Module for<br />
HIV/AIDS Related Risk Reduction among Patients with Alcohol Dependence. NIMHANS monograph<br />
Dorschner, J. (1983) Rajput <strong>alcohol</strong> use <strong>in</strong> India. Journalof Studies on Alcohol 44(3):538–544, 1983.<br />
Ezzati M, Lopez AD, Rodgers A, Vander Hoorn S, Murray CJL (2002) Selected major risk factors and global<br />
and regional burden of disease. Lancet<br />
Government of India (1996): The Constitution of India, Law M<strong>in</strong>istry, New Delhi.<br />
Govt. of Karnataka, (2002) Excise Statistics at a Glance<br />
Government of Karnataka (2001a) Karnataka: Towards Equity, Quality and Integrity <strong>in</strong> Health. F<strong>in</strong>al Report<br />
of the Task Force on Health and Family Welfare. <strong>Bangalore</strong>: Lavanya Mudrana; 2001. p.152-157.<br />
Government of Karnataka (2001b) State Excise at a Glance. Monograph compiled by the Excise<br />
Commisioner’s Office. Karnataka<br />
Gururaj G (2002) Epidemiology of traumatic bra<strong>in</strong> <strong>in</strong>juries: Indian scenario. Neurological Research. (1):24-8.<br />
Gururaj G, Isaac M [2001] Epidemiology of Suicides <strong>in</strong> <strong>Bangalore</strong> City. NIMHANS Publication No. 43,<br />
<strong>Bangalore</strong>, 2001, p.34.<br />
Gururaj G, Nagaraj D [1999] NIMHANS Stroke Registry<br />
89
Gururaj G, Narasimhan R [1999] Death Registry and Cost Specific Mortality <strong>in</strong> <strong>Bangalore</strong>: A Feasibility<br />
Study (Manuscript under preparation)<br />
Habib I. (2000). Joseph Needham and The History of Indian Technology. Indian Journal of History of<br />
Science 35(3): 245-274.<br />
Heath DB (2000) Dr<strong>in</strong>k<strong>in</strong>g Occasions: Comparative Perspectives on Alcohol and Culture. Philadelphia,<br />
Pennsylvania: Brunner/Mazel, 2000.<br />
Hobsbawm E (1983). “Introduction: Invent<strong>in</strong>g Traditions.” In The Invention of Tradition, (ed.) E. Hobsbawm<br />
& T. Ranger. Cambridge:Cambridge University Press<br />
Hurst, JF, (1889) The Temperance Question <strong>in</strong> India. The Century, vol. 38, issue 3 (July 1889).<br />
[http://cdl.library.cornell.edu/cgi-b<strong>in</strong>/moa/moa-cgi?notisid=ABP2287-0038-93]<br />
Isaac M (1998) Contemporary Trends: India. In Alcohol and Emerg<strong>in</strong>g Markets, Patterns, Problems and<br />
Responses. Grant M (ed.) Taylor and Francis, 1998, p. 145-176.<br />
Iyengar P T S (1932) History of the Tamils, Asian Educational Services,New Delhi, repr.1983. pp.253-300.<br />
Kanakasabhai V (1904)The Tamils Eighteen Hundred Years Ago, Higg<strong>in</strong>botham and Co., Madras and<br />
<strong>Bangalore</strong>, 1904, p. 125-35.<br />
Kumar BV (1996) Unaccountable Funds and Underground Bank<strong>in</strong>g - <strong>An</strong> Indian Perspective. In Barry Rider<br />
and Michael Ashe, editors, Money Launder<strong>in</strong>g Control. Dubl<strong>in</strong>: Round Hall Sweet and Maxwell, 1996.<br />
Mahal, A.,(2000) “What Works <strong>in</strong> Alcohol Policy? Evidence from Rural India”, Economic and Political<br />
Weekly, November 4, 3959- 3968.<br />
Mandelbaum D (1965) Alcohol and Culture. Current <strong>An</strong>thropology 6:3: 284<br />
Manor, J. (1993), “Power, Poverty, and Poison: Disaster and Response <strong>in</strong> an Indian City”, Newbury Park,<br />
Delhi; Sage Publications, California.<br />
McBride, R. & Mosher, J. F. (1985). Public health implications of the <strong>in</strong>ternational <strong>alcohol</strong> <strong>in</strong>dustry -- issues<br />
raised by a World Health Organistion project, Br. J. of Addiction, 80,141-147.<br />
Mohan, D. & Sharma, H. K. (1985) International review series: Alcohol and <strong>alcohol</strong> problems research, 6.<br />
India. Br. J. of Addiction, 80,351-355.<br />
Murthy P, Srikumar R, Auradkar KM, S<strong>in</strong>gh M [1999] A Case Study: Workplace Prevention of Alcohol and<br />
Drug Use at KSRTC<br />
Musgrave S & Stern N (1988) Alcohol Demand and Taxation under Monopoly and Oligopoly <strong>in</strong> South India<br />
<strong>in</strong> the 1970s. Journal of Development Economics, 15: 15-16.<br />
Needham J. Science and Civilisation <strong>in</strong> Ch<strong>in</strong>a. Vols. IV (2), V(4). Cambridge: Cambridge University Press.<br />
Productschap voor Gedistilleerde Dranken(2001) World Dr<strong>in</strong>k Trends 2000. Henley-on-Thames: NTC<br />
Publications Ltd.<br />
Rahman A. (1984)Science and Technology <strong>in</strong> medieval India, <strong>in</strong> A.Rahman (ed), Science and Technology <strong>in</strong><br />
Indian Culture: A Historical Perspective. National Institute for Science, Technology and Development, New<br />
Delhi, 1984, p.123.<br />
90
Rahman L (2002) Alcohol Prohibition and Addictive Consumption <strong>in</strong> India [Monograph].<br />
Rasanayagam MC (1926) <strong>An</strong>cient Jaffna, Everyman’s Publishers Ltd. Madras, 1926.pp.140-60.<br />
Reddy, D N, and Patnaik A (1993): ‘<strong>An</strong>ti-arrack Agitation of Women <strong>in</strong> <strong>An</strong>dhra Pradesh’, Economic and<br />
Political Weekly, May 22:1059-66.<br />
Room R, Jernigan D, Carl<strong>in</strong>i-Marlatt B, Gureje O, Makela K, Marshall M, Med<strong>in</strong>a-Mora ME, Monteiro M,<br />
Parry C, Partanen J, Riley L & Saxena S (2002) Dr<strong>in</strong>k<strong>in</strong>g Patterns <strong>in</strong> Develop<strong>in</strong>g Societies <strong>in</strong> Alcohol <strong>in</strong><br />
Develop<strong>in</strong>g Societies: A Public Health Approach. Hels<strong>in</strong>ki, 2002. World Health Organisation and F<strong>in</strong>nish<br />
Foundation for Alcohol Studies<br />
Saldanha, Indra M (1995): ‘On Dr<strong>in</strong>k<strong>in</strong>g and ‘Drunkenness’: History of Liquor <strong>in</strong> Colonial India’, Economic<br />
and Political Weekly, September 16:2323-31.<br />
Saxena S (1999) Country Profile on Alcohol <strong>in</strong> India. In : Riley L & Marshall Mac (eds)Alcohol and Public<br />
Health <strong>in</strong> 8 Develop<strong>in</strong>g Countries. Geneva: World Health Organisation 1999. pp.37-60<br />
Selvaraj V, Prasad S, Ashok MV, Appaya MP. Women <strong>alcohol</strong>ics: are they different from male <strong>alcohol</strong>ics?<br />
Indian J Psychiatry 1997; 39(4): 288-93.<br />
S<strong>in</strong>gle E & Wortley S (1993) Dr<strong>in</strong>k<strong>in</strong>g <strong>in</strong> various sett<strong>in</strong>gs as it relates to demographic variables and levels of<br />
consumption: f<strong>in</strong>d<strong>in</strong>gs from a national survey <strong>in</strong> Canda. Journal of Studies on Alcohol 54 (5):590-99.<br />
Stassen H.H., Ragaz M. and Reich T (1997) Age-of-onset or age cohort changes <strong>in</strong> the lifetime occurrence of<br />
depression? Psychiatric Genetics; 7: 27-34.<br />
Stockwell T (1996) Interventions cannot ignore <strong>in</strong>tentions. Addiction. 91(9):1283-4.<br />
Sr<strong>in</strong>ivas MN (1997) Social Change <strong>in</strong> Modern India. Orient Longman, 1997, p6.<br />
Thimmaiah G (1979) Socioeconomic Impact of Dr<strong>in</strong>k<strong>in</strong>g, State Lottery and Horse Rac<strong>in</strong>g <strong>in</strong> Karnataka. New<br />
Delhi, 1979.pp. 43 & 120.<br />
Tur<strong>in</strong> M (1997) Too Many Stars <strong>An</strong>d Not Enough Sky 1: Language <strong>An</strong>d Ethnicity Among The Thakali Of<br />
Nepal. Contributions To Nepalese Studies, Vol. 24, No. 2 (July 1997), 187-199.<br />
Vyasulu V (1998): ‘On Prohibition: Dangers of a Blanket Solution’, Economic and Political Weekly, April<br />
18:877-9.<br />
World Health Organization. Health situation <strong>in</strong> the South-East Asia Region 1994-1997. New Delhi: WHO<br />
Regional Office for South-East Asia; 1999.<br />
WHO (2000), “International Guide for Monitor<strong>in</strong>g Alcohol Consumption and Related Harm”, Department of<br />
Mental Health and Substance Dependence.<br />
World Health Organization(1999) Global Status Report on Alcohol .Geneva: World Health Organization,<br />
1999.<br />
91