Details - CALS Networking Lab - University of Arizona
Details - CALS Networking Lab - University of Arizona
Details - CALS Networking Lab - University of Arizona

You also want an ePaper? Increase the reach of your titles
YUMPU automatically turns print PDFs into web optimized ePapers that Google loves.
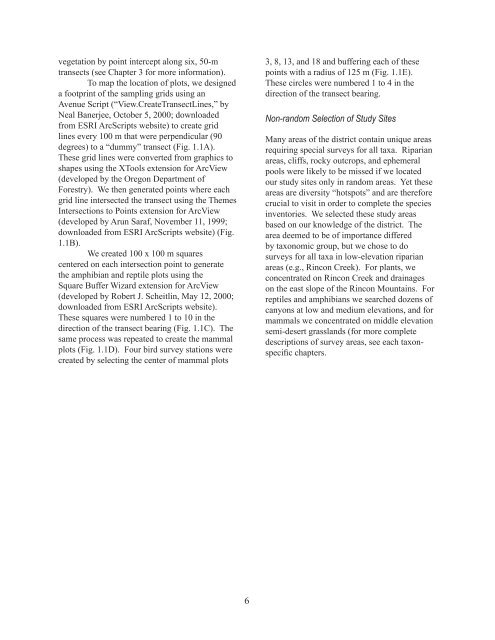
vegetation by point intercept along six, 50-m<br />
transects (see Chapter 3 for more information).<br />
To map the location <strong>of</strong> plots, we designed<br />
a footprint <strong>of</strong> the sampling grids using an<br />
Avenue Script (“View.CreateTransectLines,” by<br />
Neal Banerjee, October 5, 2000; downloaded<br />
from ESRI ArcScripts website) to create grid<br />
lines every 100 m that were perpendicular (90<br />
degrees) to a “dummy” transect (Fig. 1.1A).<br />
These grid lines were converted from graphics to<br />
shapes using the XTools extension for ArcView<br />
(developed by the Oregon Department <strong>of</strong><br />
Forestry). We then generated points where each<br />
grid line intersected the transect using the Themes<br />
Intersections to Points extension for ArcView<br />
(developed by Arun Saraf, November 11, 1999;<br />
downloaded from ESRI ArcScripts website) (Fig.<br />
1.1B).<br />
We created 100 x 100 m squares<br />
centered on each intersection point to generate<br />
the amphibian and reptile plots using the<br />
Square Buffer Wizard extension for ArcView<br />
(developed by Robert J. Scheitlin, May 12, 2000;<br />
downloaded from ESRI ArcScripts website).<br />
These squares were numbered 1 to 10 in the<br />
direction <strong>of</strong> the transect bearing (Fig. 1.1C). The<br />
same process was repeated to create the mammal<br />
plots (Fig. 1.1D). Four bird survey stations were<br />
created by selecting the center <strong>of</strong> mammal plots<br />
6<br />
3, 8, 13, and 18 and buffering each <strong>of</strong> these<br />
points with a radius <strong>of</strong> 125 m (Fig. 1.1E).<br />
These circles were numbered 1 to 4 in the<br />
direction <strong>of</strong> the transect bearing.<br />
Non-random Selection <strong>of</strong> Study Sites<br />
Many areas <strong>of</strong> the district contain unique areas<br />
requiring special surveys for all taxa. Riparian<br />
areas, cliffs, rocky outcrops, and ephemeral<br />
pools were likely to be missed if we located<br />
our study sites only in random areas. Yet these<br />
areas are diversity “hotspots” and are therefore<br />
crucial to visit in order to complete the species<br />
inventories. We selected these study areas<br />
based on our knowledge <strong>of</strong> the district. The<br />
area deemed to be <strong>of</strong> importance differed<br />
by taxonomic group, but we chose to do<br />
surveys for all taxa in low-elevation riparian<br />
areas (e.g., Rincon Creek). For plants, we<br />
concentrated on Rincon Creek and drainages<br />
on the east slope <strong>of</strong> the Rincon Mountains. For<br />
reptiles and amphibians we searched dozens <strong>of</strong><br />
canyons at low and medium elevations, and for<br />
mammals we concentrated on middle elevation<br />
semi-desert grasslands (for more complete<br />
descriptions <strong>of</strong> survey areas, see each taxonspecific<br />
chapters.