Details - CALS Networking Lab - University of Arizona
Details - CALS Networking Lab - University of Arizona
Details - CALS Networking Lab - University of Arizona

Create successful ePaper yourself
Turn your PDF publications into a flip-book with our unique Google optimized e-Paper software.
near intensive plots, but most were in areas we<br />
thought would have high species richness, species<br />
<strong>of</strong> special interest, or species suspected to be in<br />
the district that had not previously been recorded<br />
(e.g., the rock rattlesnake). Extensive surveys<br />
were more flexible and allowed for variation in<br />
survey time and area. For road and extensive<br />
surveys, we surveyed in evenings and nights to<br />
detect species with restricted activity periods<br />
(Ivanyi et al. 2000). Although we designed<br />
methods to detect both amphibians and reptiles,<br />
we detected fewer amphibians because they<br />
have more limited activity periods and are <strong>of</strong>ten<br />
restricted to aquatic environments, which are rare<br />
in the district.<br />
Intensive Surveys<br />
Field Methods<br />
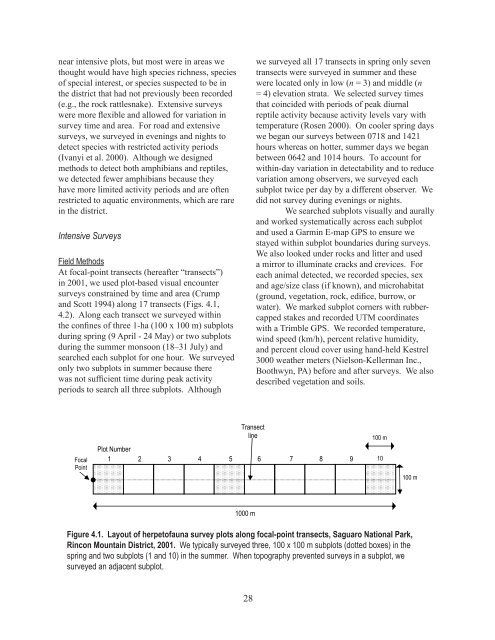
At focal-point transects (hereafter “transects”)<br />
in 2001, we used plot-based visual encounter<br />
surveys constrained by time and area (Crump<br />
and Scott 1994) along 17 transects (Figs. 4.1,<br />
4.2). Along each transect we surveyed within<br />
the confines <strong>of</strong> three 1-ha (100 x 100 m) subplots<br />
during spring (9 April - 24 May) or two subplots<br />
during the summer monsoon (18–31 July) and<br />
searched each subplot for one hour. We surveyed<br />
only two subplots in summer because there<br />
was not sufficient time during peak activity<br />
periods to search all three subplots. Although<br />
Focal<br />
Point<br />
Transect<br />
line<br />
1000 m<br />
28<br />
we surveyed all 17 transects in spring only seven<br />
transects were surveyed in summer and these<br />
were located only in low (n = 3) and middle (n<br />
= 4) elevation strata. We selected survey times<br />
that coincided with periods <strong>of</strong> peak diurnal<br />
reptile activity because activity levels vary with<br />
temperature (Rosen 2000). On cooler spring days<br />
we began our surveys between 0718 and 1421<br />
hours whereas on hotter, summer days we began<br />
between 0642 and 1014 hours. To account for<br />
within-day variation in detectability and to reduce<br />
variation among observers, we surveyed each<br />
subplot twice per day by a different observer. We<br />
did not survey during evenings or nights.<br />
We searched subplots visually and aurally<br />
and worked systematically across each subplot<br />
and used a Garmin E-map GPS to ensure we<br />
stayed within subplot boundaries during surveys.<br />
We also looked under rocks and litter and used<br />
a mirror to illuminate cracks and crevices. For<br />
each animal detected, we recorded species, sex<br />
and age/size class (if known), and microhabitat<br />
(ground, vegetation, rock, edifice, burrow, or<br />
water). We marked subplot corners with rubbercapped<br />
stakes and recorded UTM coordinates<br />
with a Trimble GPS. We recorded temperature,<br />
wind speed (km/h), percent relative humidity,<br />
and percent cloud cover using hand-held Kestrel<br />
3000 weather meters (Nielson-Kellerman Inc.,<br />
Boothwyn, PA) before and after surveys. We also<br />
described vegetation and soils.<br />
Plot Number<br />
1 2 3 4 5 6 7 8 9 10<br />
Figure 4.1. Layout <strong>of</strong> herpet<strong>of</strong>auna survey plots along focal-point transects, Saguaro National Park,<br />
Rincon Mountain District, 2001. We typically surveyed three, 100 x 100 m subplots (dotted boxes) in the<br />
spring and two subplots (1 and 10) in the summer. When topography prevented surveys in a subplot, we<br />
surveyed an adjacent subplot.<br />
100 m<br />
100 m