Average versus incremental costs
Average versus incremental costs
Average versus incremental costs

Create successful ePaper yourself
Turn your PDF publications into a flip-book with our unique Google optimized e-Paper software.
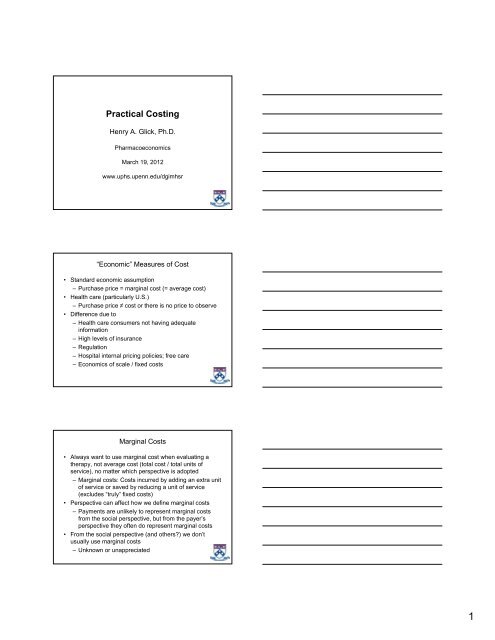
Practical Costing<br />
Henry A. Glick, Ph.D.<br />
Pharmacoeconomics<br />
March 19, 2012<br />
www.uphs.upenn.edu/dgimhsr<br />
“Economic” Measures of Cost<br />
• Standard economic assumption<br />
– Purchase price = marginal cost (= average cost)<br />
• Health care (particularly U.S.)<br />
– Purchase price ≠ cost or there is no price to observe<br />
• Difference due to<br />
– Health care consumers not having adequate<br />
information<br />
– High levels of insurance<br />
– Regulation<br />
– Hospital internal pricing policies; free care<br />
– Economics of scale / fixed <strong>costs</strong><br />
Marginal Costs<br />
• Always want to use marginal cost when evaluating a<br />
therapy, not average cost (total cost / total units of<br />
service), no matter which perspective is adopted<br />
– Marginal <strong>costs</strong>: Costs incurred by adding an extra unit<br />
of service or saved by reducing a unit of service<br />
(excludes “truly” fixed <strong>costs</strong>)<br />
• Perspective can affect how we define marginal <strong>costs</strong><br />
– Payments are unlikely to represent marginal <strong>costs</strong><br />
from the social perspective, but from the payer’s<br />
perspective they often do represent marginal <strong>costs</strong><br />
• From the social perspective (and others?) we don’t<br />
usually use marginal <strong>costs</strong><br />
– Unknown or unappreciated<br />
1
Marginal Costs (2)<br />
• In health care, marginal <strong>costs</strong> generally differ from<br />
average <strong>costs</strong><br />
• What is counted as a marginal cost may vary depending<br />
on how we define the program we are evaluating<br />
– Creation of a new program <strong>versus</strong> expansion of an<br />
existing program<br />
– Temporary program or permanent<br />
– Small program or large<br />
Variable vs Fixed Costs<br />
• Economics textbook assumption: In the short run, labor<br />
is a variable input while capital is a fixed input<br />
• Increasing output from its current level in the “short run”<br />
implies the addition of labor but no addition of capital<br />
(which is assumed to be fixed in the short run)<br />
• Given enough time, capital can be varied<br />
• Implication: short run marginal cost will usually be higher<br />
than long run marginal cost because there is more<br />
freedom to adjust to the ideal level of labor and capital in<br />
the long run<br />
“Discretionary” Fixed Costs<br />
• The fact that some <strong>costs</strong> aren’t observed to change<br />
doesn’t mean they are fixed<br />
• Technically, fixed <strong>costs</strong> are those that are impossible or<br />
foolish to change<br />
– e.g., we might elect to maintain a constant staffing<br />
level independent of number of patients on a ward,<br />
but that’s a choice we make<br />
– We could rent buildings and add or subtract rented<br />
space as volume changes<br />
• Cost of discretionary “fixed” <strong>costs</strong> equals their net benefit<br />
in their next best use<br />
– Often 0, but not always<br />
2
Transactions ≠ Social Costs<br />
• Not all transactions represents social opportunity <strong>costs</strong><br />
– Pure profits (monopoly or fortuitous)<br />
– Fixed <strong>costs</strong><br />
– External benefits<br />
– Transfers<br />
• Social security<br />
• Disability payments<br />
• Unemployment benefits<br />
Translating Service Use to Cost<br />
• If we have collected information about medical service<br />
use, need to translate it into a cost that can be compared<br />
with the measure of study effectiveness<br />
• Common to<br />
– Identify medical service use<br />
– Identify price weights (unit <strong>costs</strong>) and multiply service<br />
use times price weights<br />
– Sum the products<br />
• Alternatively, administrative data -- such as billing<br />
records -- may provide measures of both medical service<br />
use and cost (or expenditure)<br />
Costing Specific Services<br />
3
Outline, Costing Specific Services<br />
• Readily available U.S. data<br />
–Hospital <strong>costs</strong><br />
• Charges and cost-to-charge ratios<br />
• DRGs<br />
• National Inpatient File (HCUP)<br />
– Physician fees<br />
• Medicare Fee schedule<br />
• Hospital outpatient bills<br />
– Other federal fee schedules<br />
– Drug prices<br />
Hospital Costs<br />
• Readily available U.S. hospital cost data<br />
– Charges and Cost to Charge Ratios (Medicare Cost<br />
Report)<br />
– Diagnosis Related Groups (DRGs)<br />
– National Inpatient File<br />
• Hospital accounting data<br />
Cost-To-Charge Ratios<br />
(Medicare Cost Report)<br />
• In US, total charges represent amounts hospitals "bill"<br />
for services, but not how much hospital services actually<br />
cost nor the specific amounts that hospitals receive in<br />
payment<br />
• CMS cost-to-charge ratios represent the quotient of CMS<br />
recognized <strong>costs</strong> divided by hospital charges<br />
(operating+capital CCR)<br />
• Web resource: FY 2011 Impact File<br />
http://www.cms.gov/AcuteInpatientPPS/FFD/itemdetail.asp?filterType=<br />
none&filterByDID=0&sortByDID=1&sortOrder=descending&itemID=<br />
CMS1255464&intNumPerPage=10<br />
4
Cost-To-Charge Ratios<br />
(Medicare Cost Report) (Cont.)<br />
• Advantages<br />
– Readily available from all hospitals<br />
– Uniform methodology<br />
• Disadvantages<br />
– Works on averages (how bad is that?)<br />
– Includes fixed <strong>costs</strong><br />
– Not easy to estimate <strong>costs</strong> of intermediate products<br />
(i.e., bundles of services such as a procedure)<br />
New<br />
England<br />
Mid<br />
Atlantic<br />
South<br />
Atlantic<br />
E.N.<br />
Central<br />
E.S.<br />
Central<br />
2011 Operating Cost-To-Charge Ratios *<br />
Large<br />
Urban<br />
.468<br />
.433<br />
.300<br />
.276<br />
.352<br />
.335<br />
.363<br />
.328<br />
.328<br />
.286<br />
Urban Classification<br />
Other<br />
Urban<br />
.479<br />
.437<br />
.347<br />
.315<br />
.334<br />
.327<br />
.376<br />
.357<br />
.300<br />
.286<br />
Rural<br />
.524<br />
.481<br />
.486<br />
.451<br />
.392<br />
.380<br />
.452<br />
.440<br />
.376<br />
.345<br />
* Row 1, Simple average; Row 2, Weighted by # of beds<br />
W.N.<br />
Central<br />
W.S.<br />
Central<br />
Mountain<br />
Pacific<br />
Puerto<br />
Rico<br />
Total<br />
2011 Operating Cost-To-Charge Ratios<br />
.349<br />
.321<br />
.294<br />
.263<br />
.243<br />
.229<br />
.250<br />
.239<br />
.475<br />
.467<br />
.321<br />
.297<br />
.381<br />
.349<br />
.328<br />
.278<br />
.375<br />
.348<br />
.317<br />
.295<br />
.561<br />
.549<br />
.354<br />
.329<br />
Source: FY_2011_FR_Impact_File.zip<br />
.438<br />
.405<br />
.394<br />
.344<br />
.475<br />
.440<br />
.412<br />
.401<br />
-<br />
-<br />
.419<br />
.391<br />
Total<br />
.482<br />
.439<br />
.344<br />
.297<br />
.355<br />
.337<br />
.388<br />
.352<br />
.345<br />
.304<br />
.394<br />
.349<br />
.343<br />
.283<br />
.373<br />
.310<br />
.284<br />
.259<br />
.506<br />
.492<br />
.359<br />
.320<br />
5
Diagnosis Related Groups (DRGs)<br />
• Are used by Medicare and a large number of insurers to<br />
reimburse hospital services<br />
• DRGs are a set of relative weights for hospitalizations<br />
(identified by ICD-9-CM code and level of concomitant<br />
conditions)<br />
– i.e., the cost of other hospitalizations is reported in<br />
relative terms compared to the cost of an average<br />
hospitalization<br />
– e.g., a hospitalization with a DRG weight of 2.0 is<br />
considered to be twice as costly as a hospitalization<br />
with a DRG weight of 1.0<br />
Initial Development<br />
• DRG weights initially based on relative average charge<br />
for different types of hospitalization<br />
– Hospitalizations assigned to DRGs<br />
– <strong>Average</strong> hospital charge per DRG estimated<br />
– Relative weight derived by dividing DRG-specific<br />
average hospital charge by average charge for all<br />
hospitalizations<br />
• Charges for hospitalizations in individual DRGs were not<br />
very homogeneous<br />
– Use of the DRG weights explained only about 10% of<br />
the variation in charges<br />
Changes, October 2007<br />
• Changed relative weights to reflect <strong>costs</strong> rather than<br />
charges<br />
– Unweighted mean of weights relatively unchanged,<br />
although medical weights on average increased ~1%<br />
while surgical weights on average decreased ~1%<br />
• Expanded concomitant condition coding<br />
– Without; With; With major<br />
• Eliminated age coding<br />
• Changed outlier threshold<br />
• Renumbered DRGs<br />
6
Advantages / Disadvantages<br />
• Advantages<br />
– Readily available<br />
– Uniform methodology<br />
• Disadvantages<br />
– Different conditions in a DRG may have widely<br />
varying <strong>costs</strong><br />
– Cannot (without adjustment) distinguish different<br />
levels of intensity of care within a DRG<br />
– Based originally on charges; did not explain a large<br />
amount of variation<br />
– Do not include physician fees<br />
DRG Web Resource<br />
http://www.cms.gov/acuteinpatientpps/downloads/FY_2011<br />
_FR_Table_5.zip<br />
Surg/<br />
DRG<br />
MDC Med<br />
001<br />
002<br />
263<br />
264<br />
280<br />
281<br />
282<br />
283<br />
284<br />
285<br />
PRE<br />
PRE<br />
05<br />
05<br />
05<br />
05<br />
05<br />
05<br />
05<br />
05<br />
SELECTED DRG DATA (Table 5, 2011)<br />
Surg<br />
Surg<br />
Surg<br />
Surg<br />
Med<br />
Med<br />
Med<br />
Med<br />
Med<br />
Med<br />
Description<br />
Heart transplan or implant w/MCC<br />
Heart transplant or implanc w/o MCC<br />
Vein ligation & stripping<br />
Other circulatory system O.R. proc<br />
Acute MI, discharged alive w/MCC<br />
Acute MI, discharged alive w/CC<br />
Acute MI, discharged alive w/o<br />
CC/MCC<br />
Acute MI, Expired w/MCC<br />
Acute MI, Expired w/CC<br />
Acute MI, expired w/o CC/MCC<br />
Rel<br />
Wght<br />
26.3441 31.6 31.9<br />
13.6127 17.6 22.6<br />
1.7565<br />
2.5305<br />
1.8503<br />
1.1912<br />
0.8064<br />
1.7151<br />
0.8888<br />
0.5712<br />
Geo<br />
LOS<br />
3.5<br />
5.5<br />
5.2<br />
3.6<br />
2.2<br />
3.2<br />
2.1<br />
1.4<br />
Arith<br />
LOS<br />
5.6<br />
8.2<br />
6.6<br />
4.4<br />
2.8<br />
5.1<br />
2.0<br />
1.8<br />
7
DRG Reimbursement<br />
• Relative weights aren't payments<br />
– Payment rates set by Congress annually<br />
• Payment includes base payment, divided into laborrelated<br />
and nonlabor<br />
– Labor-related adjusted by wage index<br />
– Nonlabor adjusted by cost of living adjustment<br />
• Additional percentage add-ons are made if hospital:<br />
– Treats a high-percentage of low income patients<br />
(disproportionate share)<br />
– Is a teaching hospital (indirect medical education)<br />
–Has outlier cases<br />
National Inpatient sample (NIS / HCUP)<br />
• Largest all-payer inpatient care database in the US<br />
• Contains clinical and resource use information included<br />
in a typical discharge abstract<br />
– Only national hospital database containing charge<br />
(cost) information on all patients, regardless of payer<br />
• Has data from approximately 8 million hospital stays<br />
each year<br />
– In 2008, represents 20% stratified sample of U.S.<br />
community hospitals<br />
National Inpatient sample (NIS / HCUP)<br />
• Allows for hospital <strong>costs</strong> by subgroup<br />
– Diagnosis Related Group (DRG) in use on discharge<br />
date<br />
– Diagnoses and procedures<br />
• Hospital, county, and state identifiers for links to other<br />
datasets<br />
• Severity and patient level controls<br />
– Age, gender, race, expected primary and secondary<br />
payer, Median household income for patient's ZIP<br />
Code<br />
8
Other HCUP Databases<br />
• National Kids Inpatient Database (KID)<br />
• Nationwide Emergency Department Sample (NEDS) &<br />
Statewide Emergency Department Databases (SEDD)<br />
• State Ambulatory Surgery Databases (SASD)<br />
HCUP Calculator<br />
http://hcupnet.ahrq.gov/HCUPnet.jsp?Id=BCA3534C7A0C1<br />
C28&Form=SelLAY&JS=Y&Action=%3E%3ENext%3E%<br />
3E&_LAY=Researcher<br />
“National Statistics on All Stays” Create your own<br />
statistics…<br />
All Hosp, 2009<br />
LOS<br />
4.6<br />
(0.0)<br />
Charge<br />
$30,655<br />
(758)<br />
Cost<br />
$9173<br />
(126)<br />
U.S. Physician Data: The Medicare Fee Schedule<br />
• Used by Medicare to reimburse physician services<br />
• Fee schedule is a set of relative value units (RVUs) for<br />
medical services (identified by CPT code)<br />
• RVUs report relative cost of providing a service<br />
– i.e., some service designated as the baseline level of<br />
work (RVU = 1.0); the work for all other services are<br />
reported in relative terms compared to this baseline<br />
– e.g., a service with an RVU of 2.0 represents twice<br />
the work of a service with an RVU of 1.0<br />
9
U.S. Physician Data: The Medicare Fee Schedule (2)<br />
• Separate RVUs were estimated for the work involved in<br />
a procedure (physician work RVUs), malpractice, and for<br />
practice expenses (facility fees)<br />
• Payment = RVU * $/RVU (set annually by Congress)<br />
Initial Development<br />
• RVUs were developed in an extensive study conducted<br />
by clinicians, economists, statisticians, measurement<br />
psychologists, and experts in survey research<br />
• Expert panels of physicians within each specialty<br />
enumerated their different tasks and assigned RVUs to<br />
these tasks within their specialty<br />
• Expert panels of physicians from multiple specialties<br />
developed cross walks between RVUs in each of the<br />
specialties (e.g., an RVU of 1.0 in specialty A might have<br />
been determined to be equivalent to an RVU of 0.95 in<br />
speciality B)<br />
Advantages and Disadvantages<br />
• Advantages<br />
– Readily available<br />
•Files<br />
www.cms.hhs.gov/PhysicianFeeSched/PFSRVF/list.asp<br />
• Look up calculator<br />
https://www.cms.gov/apps/physician-feeschedule/overview.aspx<br />
– Uniform methodology<br />
• Disadvantages<br />
– May be difficult to identify services provided in<br />
individual physician / patient encounters<br />
10
CPT/<br />
HCPCS<br />
99201<br />
99203<br />
99205<br />
Selected 2011 Medicare Fee Schedule RVUs<br />
Description<br />
Office/op visit, new: problem<br />
focused hist & exam; straight<br />
forward med decis making; ~10 min<br />
Office/op visit, new: detailed hist &<br />
exam; med decis making of low<br />
complexity; ~30 min face-to-face<br />
Office/op visit, new: comprehensive<br />
hist & exam; med decis making of<br />
high complexity, ~60 min<br />
* $33.9764 / RVU<br />
Work Tot NF Tot Fac<br />
RVU RVU RVU<br />
0.48<br />
1.42<br />
3.17<br />
1.25<br />
3.13<br />
5.95<br />
0.78<br />
2.28<br />
4.93<br />
“Bundled” Office Visit Costs<br />
• Medical Expenditure Panel Survey Stat Brief #166<br />
Expenses for Office-Based Physician Visits by Specialty,<br />
2004*<br />
– Dentistry: 155<br />
–GP: 101<br />
– Pediatrics: 98<br />
– Ob/Gyn: 153<br />
– Opthalmology 206<br />
– Orthopedics 210<br />
– Psychiatry: 95<br />
– Dermatology: 142<br />
– Other: 235<br />
* Also see #157, Regional Differences in Total and Out-of-Pocket<br />
Expenditures for Selected Types of Office-Based Visits, 2004<br />
Medical Expenditure Panel Survey Statistical Briefs<br />
• #111: Expenses for a Hospital Emergency Room Visit,<br />
2003<br />
– <strong>Average</strong> expenditure*: $560<br />
– <strong>Average</strong> if surgical procedure performed: $904<br />
– <strong>Average</strong> if 1+ nonsurgical services † provided: $637<br />
– <strong>Average</strong> if no special service provided: $302<br />
* Direct payments from individuals, private insurance, Medicare, Medicaid,<br />
Workers’ Compensation, and miscellaneous other sources. Expenditures<br />
include those for both facility and separately billed physicians’ services<br />
† Laboratory test, sonogram or ultrasound, X-ray, mammogram, MRI, CAT<br />
scan EKG, ECG, EEG, vaccination, anesthesia, and other miscellaneous<br />
diagnostic tests<br />
11
2011 Clinical Diagnostic Laboratory Fee Schedule<br />
HCPC<br />
85520<br />
85525<br />
85530<br />
85536<br />
85540<br />
85547<br />
85576<br />
85597<br />
85610<br />
85612<br />
Heparin neutralization<br />
Heparine-protamine tolerance<br />
Iron stain peripheral blood<br />
WBC alkaline phosphatase<br />
RBC mechanical fragility<br />
Blood platelet aggregation<br />
Phospholipid platelet neutralization<br />
Prothrombin time<br />
Viper venom prothrombin time<br />
16.67<br />
19.95<br />
9.11<br />
12.11<br />
12.11<br />
30.23<br />
25.30<br />
5.53<br />
13.47<br />
http://www.cms.hhs.gov/ClinicalLabFeeSched/02_clinlab.asp#TopOfPage<br />
HCPC<br />
A5500<br />
A5501<br />
A5503<br />
A6010<br />
A6023<br />
V2475<br />
V2750<br />
Short Description<br />
Heparin assay<br />
Nat Limit<br />
18.43<br />
2011 Medicare Durable Good Fee Schedule<br />
Short Description<br />
Diab shoe for density insert<br />
Diabetic custom molded shoe<br />
Diabetic shoe w/roller rockr<br />
Collagen based wound filler<br />
Collagen dressing>48 sq in<br />
Tint, any color/solid/grad<br />
Anti-reflective coating<br />
Ceiling<br />
80.03<br />
240.06<br />
39.12<br />
32.48<br />
199.62<br />
12.34<br />
22.93<br />
Mid point<br />
24.90<br />
22.53<br />
26.96<br />
12.31<br />
16.36<br />
16.36<br />
40.85<br />
34.19<br />
7.47<br />
18.2<br />
Floor<br />
60.02<br />
180.05<br />
29.34<br />
27.61<br />
169.68<br />
9.25<br />
17.20<br />
http://www.cms.hhs.gov/DMEPOSFeeSched/LSDMEPOSFEE/<br />
HOME HEALTH VISIT COSTS *<br />
N, Mean<br />
Visit Type Agen. Cost S.D. Min Max<br />
Skilled nurse 4609 87.68 35.10 12.65 756.89<br />
Physical therapist 4287 104.40 43.37 12.29 663.63<br />
Occupat therapist 3492 107.78 52.31 10.20 773.86<br />
Speech therapist 3292 110.50 58.60 10.84 724<br />
Med/Soc services 3661 139.77 82.01 10.20 883.8<br />
Home health aid 4603 40.30 20.97 5.67 848.7<br />
* Cost data used in establishing the Home Health Agency(HHA) Per-Visit Cost Limits for<br />
fiscal periods beginning after October 1, 1999. The cost and statistical data were<br />
obtained from Free Standing Medicare HHA cost reports (Form 1728-94) for full cost<br />
reporting periods beginning on or after October 1, 1994 and settled by March 1998.<br />
Data may no longer be maintained by CMS<br />
12
Medicare Fee Schedules Home Pages<br />
• http://www.cms.hhs.gov/FeeScheduleGenInfo/<br />
• http://www.cms.hhs.gov/ProspMedicareFeeSvcPmtGen/<br />
Drug Prices<br />
• <strong>Average</strong> wholesale price (AWP) has been commonly<br />
used in the literature as an estimate of drug prices<br />
• AWP is an unregulated number that has been found by<br />
courts to be a fairly artificial construct that has been<br />
gamed by the pharmaceutical industry<br />
• Historically, AWP was the average price charged by<br />
wholesalers to providers, like doctors and pharmacies,<br />
derived from an industry-wide formulaic 20%-%25<br />
markup between actual acquisition cost and AWP<br />
• Over time, actual margins have fallen to 2%-3%, and the<br />
20%-25% markups no longer reflect actual wholesaler<br />
margins<br />
ASP<br />
• For non-Part D drugs, Medicare has moved to<br />
reimbursing drugs by use of a small mark-up of average<br />
sales price (ASP)<br />
– ASP represents the sales price including volume<br />
discounts, prompt pay discounts, cash discounts, free<br />
goods that are contingent on any purchase<br />
requirement, chargebacks, and rebates<br />
– Applies to physician-administered drugs (e.g.,<br />
chemotherapy infused in physicians’ offices)<br />
13
AWP / ASP Comparison<br />
• The US Inspector General's office* has reported:<br />
– The median difference between ASP and AWP is<br />
49%<br />
– For generic drugs, ASP is 68% less than AWP at the<br />
median<br />
– For single source brand drugs, ASP is 26% less than<br />
AWP<br />
– For multisource branded drugs, ASP is 30% less<br />
* Medicaid Drug Price Comparison: <strong>Average</strong> Sales Price To <strong>Average</strong><br />
Wholesale Price, Office of the Inspector General, DHHS, June 2005<br />
HCPCS<br />
90658<br />
90716<br />
90647<br />
J0130<br />
J9260<br />
J1438<br />
J3370<br />
J2020<br />
J9182<br />
J3480<br />
J7330<br />
Description<br />
Selected 2009 ASP Prices<br />
Flu vaccine, 3+ years, im<br />
Chicken pox vaccine, sc<br />
HIB, PRP-OMP, im<br />
Abciximab injection<br />
Methotrexate sodium inj<br />
Etanercept injection<br />
Vancomycin hcl injection<br />
Linezolid injection<br />
Etoposide injection<br />
Inj potassium chloride<br />
Cultured chondrocytes, impnt<br />
0.5 ML<br />
10 MG<br />
50 MG<br />
25 MG<br />
500 MG<br />
200 MG<br />
10 MG<br />
2 MEQ<br />
https://www.cms.gov/McrPartBDrugAvgSalesPrice/01_overview.asp#TopOfP<br />
age<br />
AMP<br />
Dosage<br />
0.5 ML<br />
0.5 ML<br />
1<br />
Payment limit<br />
$13.218<br />
$77.651<br />
$23.34<br />
$438.872<br />
$2.201<br />
$180.782<br />
$3.017<br />
$30.23<br />
$0.463<br />
$0.015<br />
$23,102<br />
• Alternatively, Medicaid upper limits are based on<br />
average manufacturers price (AMP) plus a dispensing<br />
fee for pharmaceuticals<br />
– AMP represents the average price paid to the<br />
manufacturer by wholesalers for drugs distributed to<br />
the retail pharmacy class of trade including discounts<br />
and other price concessions provided by the<br />
manufacturer, but without regard to customary prompt<br />
pay discounts extended to wholesalers<br />
14
AWP / AMP Comparison<br />
• The US Inspector General's office* has reported:<br />
– For generic drugs, AMP on average is between 65%<br />
(simple average) and 74% (sales-weighted average)<br />
less than AWP<br />
– For single-branded drugs AMP on average is 25%<br />
less than AWP<br />
– For multisource branded drugs, AMP on average is<br />
between 35% and 40% less than AWP<br />
* Medicaid Drug Price Comparisons: <strong>Average</strong> Manufacturer Price to<br />
Published Prices, Office of the Inspector General, DHHS, June 2005<br />
Thomson Reuters Redbook<br />
• Provides<br />
–AWP<br />
– Wholesale Acquisition Cost (WAC)<br />
– Direct Price (DP)<br />
– Suggested Retail Price (SRP)<br />
– Federal Upper Limit (FUL)<br />
VA Federal Supply Schedule (FSS)<br />
• Some of the most complete / accessable pharmaceutical<br />
price lists<br />
– FSS Big 4 prices (for VA, DoD, PHS, and Coast<br />
Guard) based on vendor’s most favored commercial<br />
customer pricing or statutorily-required pricing<br />
calculations<br />
– FSS Dual prices -- for Other Government Agencies<br />
authorized to use the FSS program -- based on most<br />
favored commercial customer pricing negotiations<br />
• Web address:<br />
http://www.pbm.va.gov/DrugPharmaceuticalPrices.aspx<br />
15