On the occurrence and consequences of inaccurate ... - Acsu Buffalo
On the occurrence and consequences of inaccurate ... - Acsu Buffalo
On the occurrence and consequences of inaccurate ... - Acsu Buffalo

You also want an ePaper? Increase the reach of your titles
YUMPU automatically turns print PDFs into web optimized ePapers that Google loves.
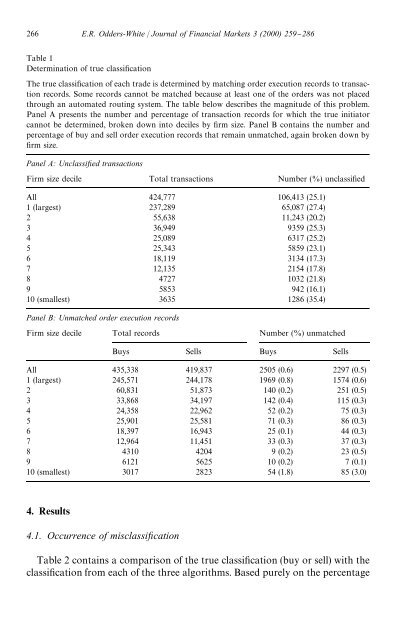
266 E.R. Odders-White / Journal <strong>of</strong> Financial Markets 3 (2000) 259}286<br />
Table 1<br />
Determination <strong>of</strong> true classi"cation<br />
The true classi"cation <strong>of</strong> each trade is determined by matching order execution records to transaction<br />
records. Some records cannot be matched because at least one <strong>of</strong> <strong>the</strong> orders was not placed<br />
through an automated routing system. The table below describes <strong>the</strong> magnitude <strong>of</strong> this problem.<br />
Panel A presents <strong>the</strong> number <strong>and</strong> percentage <strong>of</strong> transaction records for which <strong>the</strong> true initiator<br />
cannot be determined, broken down into deciles by "rm size. Panel B contains <strong>the</strong> number <strong>and</strong><br />
percentage <strong>of</strong> buy <strong>and</strong> sell order execution records that remain unmatched, again broken down by<br />
"rm size.<br />
Panel A: Unclassixed transactions<br />
Firm size decile Total transactions Number (%) unclassi"ed<br />
All 424,777 106,413 (25.1)<br />
1 (largest) 237,289 65,087 (27.4)<br />
2 55,638 11,243 (20.2)<br />
3 36,949 9359 (25.3)<br />
4 25,089 6317 (25.2)<br />
5 25,343 5859 (23.1)<br />
6 18,119 3134 (17.3)<br />
7 12,135 2154 (17.8)<br />
8 4727 1032 (21.8)<br />
9 5853 942 (16.1)<br />
10 (smallest) 3635 1286 (35.4)<br />
Panel B: Unmatched order execution records<br />
Firm size decile Total records Number (%) unmatched<br />
Buys Sells Buys Sells<br />
All 435,338 419,837 2505 (0.6) 2297 (0.5)<br />
1 (largest) 245,571 244,178 1969 (0.8) 1574 (0.6)<br />
2 60,831 51,873 140 (0.2) 251 (0.5)<br />
3 33,868 34,197 142 (0.4) 115 (0.3)<br />
4 24,358 22,962 52 (0.2) 75 (0.3)<br />
5 25,901 25,581 71 (0.3) 86 (0.3)<br />
6 18,397 16,943 25 (0.1) 44 (0.3)<br />
7 12,964 11,451 33 (0.3) 37 (0.3)<br />
8 4310 4204 9 (0.2) 23 (0.5)<br />
9 6121 5625 10 (0.2) 7 (0.1)<br />
10 (smallest) 3017 2823 54 (1.8) 85 (3.0)<br />
4. Results<br />
4.1. Occurrence <strong>of</strong> misclassixcation<br />
Table 2 contains a comparison <strong>of</strong> <strong>the</strong> true classi"cation (buy or sell) with <strong>the</strong><br />
classi"cation from each <strong>of</strong> <strong>the</strong> three algorithms. Based purely on <strong>the</strong> percentage