Effects of Acutely Elevated Hydrostatic Pressure in a - Investigative ...
Effects of Acutely Elevated Hydrostatic Pressure in a - Investigative ...
Effects of Acutely Elevated Hydrostatic Pressure in a - Investigative ...

You also want an ePaper? Increase the reach of your titles
YUMPU automatically turns print PDFs into web optimized ePapers that Google loves.
Glaucoma<br />
<strong>Effects</strong> <strong>of</strong> <strong>Acutely</strong> <strong>Elevated</strong> <strong>Hydrostatic</strong> <strong>Pressure</strong> <strong>in</strong> a Rat<br />
Ex Vivo Ret<strong>in</strong>al Preparation<br />
Makoto Ishikawa, 1 Takeshi Yoshitomi, 1 Charles F. Zorumski, 2 and Yukitoshi Izumi 2<br />
PURPOSE. A new experimental glaucoma model was developed<br />
by us<strong>in</strong>g an ex vivo rat ret<strong>in</strong>al preparation to exam<strong>in</strong>e the<br />
effects <strong>of</strong> elevated hydrostatic pressure on ret<strong>in</strong>al morphology<br />
and glutam<strong>in</strong>e synthetase (GS) activity.<br />
METHODS. Ex vivo rat ret<strong>in</strong>as were exposed to elevated hydrostatic<br />
pressure for 24 hours <strong>in</strong> the presence <strong>of</strong> glutamate or<br />
glutamate receptor antagonists and exam<strong>in</strong>ed histologically. GS<br />
activity was assessed by colorimetric assay.<br />
RESULTS. <strong>Pressure</strong> elevation <strong>in</strong>duced axonal swell<strong>in</strong>g <strong>in</strong> the<br />
nerve fiber layer. Axonal swell<strong>in</strong>g was prevented by a comb<strong>in</strong>ation<br />
<strong>of</strong> non-N-methyl-D-aspartate (non-NMDA) receptor antagonist<br />
and an NMDA receptor antagonist, <strong>in</strong>dicat<strong>in</strong>g that the<br />
damage results from activation <strong>of</strong> both types <strong>of</strong> glutamate<br />
receptor. When glial function was preserved, the typical<br />
changes <strong>in</strong>duced by glutamate consisted <strong>of</strong> reversible Müller<br />
cell swell<strong>in</strong>g result<strong>in</strong>g from excessive glial glutamate uptake.<br />
The irreversible Müller cell swell<strong>in</strong>g <strong>in</strong> hyperbaric conditions<br />
may <strong>in</strong>dicate that pressure disrupts glutamate metabolism. Indeed,<br />
elevated pressure <strong>in</strong>hibited GS activity. In addition, glutamate<br />
exposure after term<strong>in</strong>ation <strong>of</strong> pressure exposure exhibited<br />
apparent Müller cell swell<strong>in</strong>g.<br />
CONCLUSIONS. These results suggest that the neural degeneration<br />
observed dur<strong>in</strong>g pressure elevation is caused by impaired<br />
glial glutamate metabolism after uptake. (Invest Ophthalmol<br />
Vis Sci. 2010;51:6414–6423) DOI:10.1167/iovs.09-5127<br />
Glaucoma is a heterogeneous disorder caused by several<br />
dist<strong>in</strong>ct pathologic processes. Although the pathogenesis<br />
<strong>of</strong> glaucoma is not fully understood, it is believed that <strong>in</strong>creased<br />
<strong>in</strong>traocular pressure (IOP) is a major contributor. Increased<br />
IOP may cause ocular ischemia, because the vascular<br />
perfusion pressure, def<strong>in</strong>ed as the difference between local<br />
arterial pressure and IOP, is decreased by elevated IOP. Thus,<br />
it has been hypothesized that excitotoxicity, which plays a key<br />
role <strong>in</strong> ischemic damage, may be <strong>in</strong>volved <strong>in</strong> glaucomatous<br />
ret<strong>in</strong>al degeneration.<br />
Activation <strong>of</strong> glutamate receptors plays a key role <strong>in</strong> <strong>in</strong>duc<strong>in</strong>g<br />
excitotoxicity <strong>in</strong> the ret<strong>in</strong>a. 1,2 However, the primary<br />
change produced by exogenously applied glutamate is a swell<strong>in</strong>g<br />
<strong>of</strong> glial Müller cells. 3 Under these conditions, neurons are<br />
From the 1 Department <strong>of</strong> Ophthalmology, Akita University School<br />
<strong>of</strong> Medic<strong>in</strong>e, Akita, Japan; and the 2 Department <strong>of</strong> Psychiatry, Wash<strong>in</strong>gton<br />
University School <strong>of</strong> Medic<strong>in</strong>e, St. Louis, Missouri.<br />
Supported <strong>in</strong> part by National Institute <strong>of</strong> Health Grant<br />
MH077791, Neuroscience Bluepr<strong>in</strong>t Core Grant NS57105, and the<br />
Bantly Foundation.<br />
Submitted for publication December 24, 2009; revised May 15,<br />
2010; accepted July 22, 2010.<br />
Disclosure: M. Ishikawa, None; T. Yoshitomi, None; C.F.<br />
Zorumski, None; Y. Izumi, None<br />
Correspond<strong>in</strong>g author: Makoto Ishikawa, Department <strong>of</strong> Ophthalmology,<br />
Akita University Faculty <strong>of</strong> Medic<strong>in</strong>e, 1-1-1 Hondo, Akita 010-<br />
8543, Japan; mako@med.akita-u.ac.jp.<br />
not damaged. However, glutamate becomes excitotoxic to<br />
neurons when Müller glia are unable to metabolize the am<strong>in</strong>o<br />
acid. 4,5 This suggests that changes <strong>in</strong> glial function are important<br />
<strong>in</strong> ret<strong>in</strong>al excitotoxicity. Several studies have shown that<br />
the expression <strong>of</strong> glutam<strong>in</strong>e synthetase (GS), a key enzyme<br />
<strong>in</strong>volved <strong>in</strong> glial glutamate metabolism, 6 <strong>in</strong>creases after pressure<br />
elevation, 7–9 whereas others have reported decreases <strong>in</strong><br />
GS activity and expression. 10,11 Thus, it rema<strong>in</strong>s controversial<br />
whether elevated IOP alters glial cell glutamate metabolism as<br />
a potential mechanism <strong>of</strong> ret<strong>in</strong>al excitotoxicity.<br />
We used an ex vivo rat ret<strong>in</strong>al preparation 12 to exam<strong>in</strong>e<br />
histologically and biochemically whether elevated pressure<br />
disrupts glutamate metabolism. In addition, we exam<strong>in</strong>ed<br />
whether elevated pressure alters glial fibrillary acidic prote<strong>in</strong><br />
(GFAP), an <strong>in</strong>termediate filament prote<strong>in</strong> expressed <strong>in</strong> <strong>in</strong>jured<br />
Müller glia, 13,14 because GFAP is considered to be a pathologic<br />
marker <strong>of</strong> Müller cell stress. 15 An <strong>in</strong>crease <strong>in</strong> GFAP expression<br />
<strong>in</strong> Müller cells has recently been reported after the elevation <strong>of</strong><br />
IOP. 7,13,16–21<br />
MATERIALS AND METHODS<br />
All experiments were performed <strong>in</strong> accordance with the guidel<strong>in</strong>es <strong>of</strong><br />
the ARVO Statement for the Use <strong>of</strong> Animals <strong>in</strong> Ophthalmic and Vision<br />
Research.<br />
Ret<strong>in</strong>al Segment Preparation<br />
Ret<strong>in</strong>al segments were prepared from approximately 30-day-old male<br />
Sprague-Dawley rats (Charles River Laboratories International Inc.,<br />
Wilm<strong>in</strong>gton, MA), accord<strong>in</strong>g to published methods. 12 The eyes were<br />
carefully dissected from the orbits and placed <strong>in</strong> a hold<strong>in</strong>g device on<br />
the floor <strong>of</strong> an ice-cold Petri dish filled with chilled aCSF (artificial<br />
cerebrosp<strong>in</strong>al fluid) medium conta<strong>in</strong><strong>in</strong>g (<strong>in</strong> mM): 124 NaCl, 5 KCl, 2<br />
MgSO4, 2 CaCl2, 1.25 NaH2PO4, 22 NaHCO3, and 10 glucose. The<br />
hold<strong>in</strong>g device consisted <strong>of</strong> an <strong>in</strong>verted cap (<strong>in</strong>side diameter, 5 mm)<br />
removed from a 1.5-mL plastic vial. The cornea was excised circumferentially<br />
with microscissors and the lens and vitreous were removed.<br />
The empty eye cup (diameter, 5 mm) was placed on a flat cutt<strong>in</strong>g<br />
surface and immersed <strong>in</strong> ice-cold aCSF. With a no. 22 surgical scalpel<br />
blade, the eye cup was divided <strong>in</strong>to four equal fan-shaped segments.<br />
The ret<strong>in</strong>a was carefully and gently detached from the sclera with a f<strong>in</strong>e<br />
forceps and the scalpel blade. This detachment <strong>of</strong> the ret<strong>in</strong>a did not<br />
affect morphologic <strong>in</strong>tegrity dur<strong>in</strong>g a 24-hour <strong>in</strong>cubation. Each specimen<br />
was placed <strong>in</strong> a plastic dish that was 0.5 cm deep and 2.5 cm <strong>in</strong><br />
diameter. The dish was slowly sunk with a guide wire to the bottom <strong>of</strong><br />
a tall glass cyl<strong>in</strong>der filled with aCSF. To exam<strong>in</strong>e the optic disc region,<br />
we cut some eye cups <strong>in</strong>to a central eye cup segment approximately<br />
2.0 mm <strong>in</strong> diameter. The 95% O2–5% CO2 gas mixture was delivered<br />
through PE90 plastic tub<strong>in</strong>g that term<strong>in</strong>ated 3 cm above the bottom <strong>of</strong><br />
the cyl<strong>in</strong>der (Fig. 1). The pH was ma<strong>in</strong>ta<strong>in</strong>ed at 7.35 to 7.40, and <strong>in</strong><br />
some experiments, phenol red was added to the medium to monitor<br />
changes <strong>in</strong> pH. Experiments were performed at 30°C.<br />
The pressure at the bottom <strong>of</strong> the <strong>in</strong>cubation cyl<strong>in</strong>der was calculated<br />
as P gH (P, pressure; , density <strong>of</strong> the aCSF; g, gravity; and H,<br />
height <strong>of</strong> the aCSF column). The depth <strong>of</strong> aCSF <strong>in</strong> the control column<br />
<strong>Investigative</strong> Ophthalmology & Visual Science, December 2010, Vol. 51, No. 12<br />
6414 Copyright © Association for Research <strong>in</strong> Vision and Ophthalmology
IOVS, December 2010, Vol. 51, No. 12 <strong>Pressure</strong> Elevation and Ret<strong>in</strong>al Excitotoxicity 6415<br />
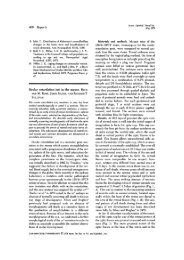
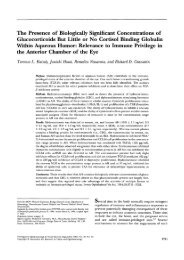
FIGURE 1. Diagram <strong>of</strong> the present experiments. Ret<strong>in</strong>al segments or<br />
eye cups prepared from Sprague-Dawley rats were placed <strong>in</strong> plastic<br />
dishes that were 5 mm high and 2.5 cm <strong>in</strong> diameter. Each dish was<br />
suspended by a long sta<strong>in</strong>less steel wire hooked through a hole <strong>in</strong> the<br />
lateral wall. With the wire, the specimen <strong>in</strong> the dish was slowly<br />
submerged to the bottom <strong>of</strong> a tall glass cyl<strong>in</strong>der filled with aCSF at 30°C<br />
and left for 24 hours. The wire was fixed at the top <strong>of</strong> the cyl<strong>in</strong>der after<br />
the dish was settled at the bottom <strong>of</strong> the cyl<strong>in</strong>der. The diameter <strong>of</strong> the<br />
glass cyl<strong>in</strong>der was 3 cm, and the height was 20, 50, 80, or 120 cm.<br />
<strong>Hydrostatic</strong> pressure at the bottom <strong>of</strong> the cyl<strong>in</strong>der was calculated to be<br />
10, 25, 50, or 75 mm Hg when aCSF was added to a height <strong>of</strong> 13.5,<br />
33.7, 67.3, or 101.2 cm, respectively. The medium was constantly<br />
bubbled with 95% O 2–5% CO 2 throughout the experiments. The m<strong>in</strong>imum<br />
gas pressure needed to drive gas through the PE90 plastic tub<strong>in</strong>g<br />
was monitored before <strong>in</strong>cubation. This m<strong>in</strong>imum gas pressure reflects<br />
the pressure at the bottom <strong>of</strong> the open, tall cyl<strong>in</strong>der. Glutamate, GYKI,<br />
or MK-801 was added to the aCSF dur<strong>in</strong>g some experiments.<br />
was adjusted to 13.5 cm to atta<strong>in</strong> a pressure <strong>of</strong> 10 mm Hg. An IOP <strong>of</strong><br />
75 mm Hg, a pressure that can occur dur<strong>in</strong>g a severe, acute glaucoma<br />
episode, was simulated by adjust<strong>in</strong>g the CSF column height to 101.2<br />
cm. <strong>Pressure</strong>-dependent changes <strong>in</strong> the ret<strong>in</strong>a were exam<strong>in</strong>ed by <strong>in</strong>cubat<strong>in</strong>g<br />
the specimens <strong>in</strong> the aCSF column with heights <strong>of</strong> 33.7 and<br />
67.3 cm, which correspond to 25 and 50 mm Hg, respectively. In some<br />
experiments, glutamate (30 M, 300 M, and 1.0 mM) or glutamate<br />
receptor antagonists were added to the aCSF. In a previous study,<br />
typical Müller cell swell<strong>in</strong>g was observed with 300 M and 1.0 mM<br />
glutamate, although 30 M glutamate did not <strong>in</strong>duce remarkable<br />
changes <strong>in</strong> any layers <strong>of</strong> the ret<strong>in</strong>a. Based on these f<strong>in</strong>d<strong>in</strong>gs, we used<br />
glutamate concentrations <strong>of</strong> 30 M, 300 M, and 1.0 mM to exam<strong>in</strong>e<br />
excitotoxicity <strong>in</strong> the ret<strong>in</strong>a <strong>in</strong> the present study. A non-NMDA-type<br />
glutamate receptor antagonist, 100 M GYKI 52446 (GYKI), and an<br />
NMDA type glutamate receptor antagonist, 10 M dizocilp<strong>in</strong>e (MK-<br />
801), were added to the aCSF start<strong>in</strong>g 10 m<strong>in</strong>utes before the <strong>in</strong>troduction<br />
<strong>of</strong> pressure load<strong>in</strong>g. The concentration <strong>of</strong> each antagonist was<br />
more than three times higher than the reported IC 50s. Glutamate,<br />
MK-801, and GYKI were obta<strong>in</strong>ed from Sigma-Aldrich (St. Louis, MO).<br />
The effects <strong>of</strong> hydrostatic pressure elevation, glutamate, and glutamate<br />
receptor antagonists on Müller cell swell<strong>in</strong>g were determ<strong>in</strong>ed by<br />
light and electron microscopy. To exam<strong>in</strong>e the reversibility <strong>of</strong> Müller<br />
cell swell<strong>in</strong>g, we decreased the glutamate <strong>in</strong>cubation period to 30<br />
m<strong>in</strong>utes. After that, the ret<strong>in</strong>al segments were <strong>in</strong>cubated <strong>in</strong> drug-free<br />
medium for 20 hours, with or without pressure elevation. Some ret<strong>in</strong>as<br />
were exposed to pressure elevation for 20 hours after <strong>in</strong>cubation with<br />
1.0 mM glutamate for 30 m<strong>in</strong>utes to exam<strong>in</strong>e the changes <strong>in</strong> glutamate<br />
uptake ability.<br />
Light Microscopy<br />
On completion <strong>of</strong> each experiment, the ret<strong>in</strong>al segments were fixed <strong>in</strong><br />
1% paraformaldehyde and 1.5% glutaraldehyde <strong>in</strong> 0.1 M phosphate<br />
buffer overnight at 4°C. The fixed ret<strong>in</strong>as were r<strong>in</strong>sed <strong>in</strong> 0.1 M phosphate<br />
buffer and placed <strong>in</strong> 1% buffered osmium tetroxide for 60<br />
m<strong>in</strong>utes. The ret<strong>in</strong>as were dehydrated with alcohol, embedded <strong>in</strong> Epon<br />
812 res<strong>in</strong> (TAAB Laboratories, Aldermaston, UK) and cut <strong>in</strong>to 1-mthick<br />
sections for light microscopy. The tissue was then sta<strong>in</strong>ed with<br />
methylene blue and azure II or toluid<strong>in</strong>e blue and evaluated by light<br />
microscopy. In the present study, we exam<strong>in</strong>ed the optic disc regions<br />
and the ret<strong>in</strong>al segments taken from the middle part <strong>of</strong> the ret<strong>in</strong>a,<br />
approximately 1200 m from the center <strong>of</strong> the optic disc.<br />
Electron Microscopy<br />
The ret<strong>in</strong>al specimens were trimmed to a smaller size, and ultrath<strong>in</strong><br />
sections (75 nm) were cut with a diamond knife and suspended over<br />
formvar-coated slot grids (1 2 mm open<strong>in</strong>g). They were sta<strong>in</strong>ed with<br />
uranyl acetate and lead citrate and viewed <strong>in</strong> a transmission electron<br />
microscope (H-7650, Hitachi High-Technologies Corp., Tokyo, Japan).<br />
Data Analysis<br />
For quantitative assessment <strong>of</strong> pressure-dependent changes <strong>of</strong> the<br />
nerve fiber layer thickness (NFLT) <strong>in</strong> the middle part <strong>of</strong> the ret<strong>in</strong>a,<br />
NFLT and total ret<strong>in</strong>al thickness were measured at 30 different locations<br />
<strong>in</strong> light micrographs from each ret<strong>in</strong>al block. When the ret<strong>in</strong>as<br />
were <strong>in</strong>cubated with glutamate <strong>in</strong> hyperbaric conditions, it sometimes<br />
became difficult to clearly identify the NFL at the level <strong>of</strong> light microscopic<br />
resolution. For quantitative assessment <strong>of</strong> the structural changes<br />
<strong>in</strong> NFL <strong>in</strong> these experimental conditions, NFLT was measured at 30<br />
different locations <strong>in</strong> electron micrographs from each ret<strong>in</strong>al block.<br />
In the central ret<strong>in</strong>a, it became easy to dist<strong>in</strong>guish the NFL from<br />
other structures by light microscopy. NFL thickness was analyzed<br />
accord<strong>in</strong>g to the algorithms <strong>of</strong> optical coherence tomography 22 as<br />
follows: The boundary <strong>of</strong> the optic disc was determ<strong>in</strong>ed by the po<strong>in</strong>t<br />
at which the ret<strong>in</strong>al pigment epithelium term<strong>in</strong>ated at the scleral canal<br />
and served as a landmark. The disc diameter can be determ<strong>in</strong>ed by<br />
measur<strong>in</strong>g the distance between the disc boundaries (landmarks) on<br />
opposite sides <strong>of</strong> the disc. The NFLT and total ret<strong>in</strong>al thickness can be<br />
measured by construct<strong>in</strong>g a perpendicular to the l<strong>in</strong>e that def<strong>in</strong>es the<br />
disc diameter from the landmarks.<br />
Swollen axons, def<strong>in</strong>ed as hav<strong>in</strong>g edematous axoplasm and shorter<br />
diameter greater than 1 m, were counted <strong>in</strong> 30 electron micrographs<br />
<strong>of</strong> each specimen. The area <strong>of</strong> the NFL was measured with ImageJ 1.34<br />
s<strong>of</strong>tware (developed by Wayne Rasband, National Institutes <strong>of</strong> Health,<br />
Bethesda, MD; available at http://rsb.<strong>in</strong>fo.nih.gov/ij/<strong>in</strong>dex.html), and<br />
the density <strong>of</strong> the swollen axons was calculated per 100 m <strong>of</strong> the NFL<br />
area.<br />
The density <strong>of</strong> degenerated ganglion cells (GCs) was determ<strong>in</strong>ed by<br />
count<strong>in</strong>g 30 fields <strong>of</strong> 500-m length at 30 different locations <strong>in</strong> light<br />
micrographs taken from the block <strong>of</strong> the middle ret<strong>in</strong>al part.<br />
The severity <strong>of</strong> neuronal damage was assessed <strong>in</strong> 30 fields <strong>of</strong><br />
light micrographs from each middle ret<strong>in</strong>al block by us<strong>in</strong>g a neuronal<br />
damage score (NDS). 4 The NDS rates neuronal damage <strong>in</strong> the<br />
INLandIPLona0to4scale, with 0 signify<strong>in</strong>g no neuronal damage<br />
and four <strong>in</strong>dicat<strong>in</strong>g very severe damage. Criteria used <strong>in</strong> establish<strong>in</strong>g
6416 Ishikawa et al. IOVS, December 2010, Vol. 51, No. 12<br />
the degree <strong>of</strong> neuronal damage <strong>in</strong>cluded the extent <strong>of</strong> cytoplasmic<br />
swell<strong>in</strong>g <strong>in</strong> the IPL and the number <strong>of</strong> neurons <strong>in</strong> the INL show<strong>in</strong>g<br />
signs <strong>of</strong> severe cytoplasmic swell<strong>in</strong>g and coarse clump<strong>in</strong>g <strong>of</strong> nuclear<br />
chromat<strong>in</strong>. Müller cell swell<strong>in</strong>g was not counted. The highest NDS<br />
(4) was assigned when the IPL showed an apparent spongiform<br />
appearance due to dendritic swell<strong>in</strong>g and when most somas <strong>in</strong> the<br />
INL showed severe cytoplasmic swell<strong>in</strong>g and coarse clump<strong>in</strong>g <strong>of</strong><br />
nuclear chromat<strong>in</strong>. If the damage was to a lesser degree, a score <strong>of</strong><br />
3 was assigned. NDS 2 was assigned when somas <strong>in</strong> the INL were<br />
sporadically swollen. In NDS 1, damage did not fulfill the higher<br />
criteria, but the ret<strong>in</strong>as differed from the control ret<strong>in</strong>as (NDS 0).<br />
F<strong>in</strong>e dendritic swell<strong>in</strong>g <strong>in</strong> a limited area <strong>of</strong> the IPL without damage<br />
<strong>in</strong> the INL was assigned NDS 2.<br />
These morphometric parameters were assessed by three raters who<br />
rema<strong>in</strong>ed unaware <strong>of</strong> the experimental condition. Before the study<br />
commenced, 12 samples <strong>of</strong> ret<strong>in</strong>as <strong>in</strong>cubated with various concentrations<br />
<strong>of</strong> ka<strong>in</strong>ate (0, 1, 10, 100, and 300 M) were scaled by the raters,<br />
to determ<strong>in</strong>e the reliability <strong>of</strong> the scor<strong>in</strong>g system. No significant differences<br />
were detected between the raters by one-way analysis <strong>of</strong> variance<br />
(one-way ANOVA) followed by the Tukey-Kramer test. On completion<br />
<strong>of</strong> data assessment, the significance <strong>of</strong> <strong>in</strong>dividual differences by<br />
the raters was evaluated with 10 randomly selected samples <strong>in</strong> each<br />
morphometric parameter, aga<strong>in</strong>. The data were double-checked and<br />
analyzed (Bioscience ver. 9.53, SPBS; Nankodo Publisher, Tokyo, Japan;<br />
StatView ver. 5; SAS Institute Inc., Cary, NC). Each parameter was<br />
compared with those <strong>of</strong> the control group by Mann-Whitney U test or<br />
Student’s t-test. All analyses were two-sided and the results were<br />
considered statistically significant at P 0.05.<br />
Immunocytochemistry<br />
For immunocytochemistry, specimens were fixed with 2% paraformaldehyde<br />
<strong>in</strong> 0.1 M phosphate-buffer for 2 hours at 4°C. They were<br />
then embedded <strong>in</strong> OCT compound (Sakura Global Hold<strong>in</strong>gs, Tokyo,<br />
Japan), and frozen with liquid nitrogen. The cryosections were<br />
<strong>in</strong>cubated with anti-human GFAP antibody (Shima Laboratories Co.,<br />
Tokyo, Japan). FITC-conjugated goat anti-rabbit IgG (Zymed Laboratories,<br />
Carlsbad, CA) was applied to the frozen sections as a<br />
secondary antibody. B<strong>in</strong>d<strong>in</strong>g sites <strong>of</strong> IgGs were detected by confocal<br />
laser scann<strong>in</strong>g microscopy (LSM510 Axiovert200M; Carl Zeiss Meditec,<br />
Gött<strong>in</strong>gen, Germany) imag<strong>in</strong>g the localization <strong>of</strong> 4,6-diamid<strong>in</strong>o-2-phenyl<strong>in</strong>dole<br />
(DAPI; 405-nm laser l<strong>in</strong>e excitation; 420/480<br />
emission filter) and FITC (488-nm laser l<strong>in</strong>e excitation; 505/530<br />
emission filter). DAPI was used for nuclear sta<strong>in</strong><strong>in</strong>g. The images<br />
were captured with identical photomultiplier tube ga<strong>in</strong> sett<strong>in</strong>gs and<br />
processed (LSM-PC; Carl Zeiss Meditec, Inc., Foster City. CA), us<strong>in</strong>g<br />
the z-stack option. Images were reproduced for publication with<br />
image-management s<strong>of</strong>tware (Photoshop 7.0; Adobe Systems Inc.,<br />
Mounta<strong>in</strong> View, CA).<br />
GS Assay<br />
GS catalyzes the reaction, glutamate NH 4 ATP 3 glutam<strong>in</strong>e <br />
ADP P i H , <strong>in</strong> the presence <strong>of</strong> Mn 2 or Mg 2 . In the present study,<br />
<strong>in</strong>organic phosphate released from ATP <strong>in</strong> the GS biosynthetic assay<br />
was detected colorimetrically. 23<br />
The ret<strong>in</strong>as were recovered after <strong>in</strong>cubation with pressure overload<br />
as just described, washed thoroughly with cold Hanks’ buffer homogenized<br />
on ice <strong>in</strong> a solution conta<strong>in</strong><strong>in</strong>g 100 mM MOPS, 5 mM EDTA, and<br />
200 mM sucrose (pH 7.0). After centrifugation (10,000g for 30 m<strong>in</strong>utes<br />
at 4°C), the supernatant was kept at 70°C until assay. The prote<strong>in</strong><br />
concentration <strong>of</strong> ret<strong>in</strong>a samples was determ<strong>in</strong>ed by the Bradford<br />
method (Bio-Rad ABC solution; Bio-Rad Laboratories, Hercules, CA)<br />
and serum -globul<strong>in</strong> as the standard. 24 GS was assayed at optimum<br />
assay conditions, as described. 25,26<br />
RESULTS<br />
<strong>Pressure</strong>-Dependent Changes <strong>in</strong> the<br />
Peripheral Ret<strong>in</strong>a<br />
The pressure dependence <strong>of</strong> axonal swell<strong>in</strong>g <strong>in</strong> the NFL was<br />
determ<strong>in</strong>ed by obta<strong>in</strong><strong>in</strong>g ret<strong>in</strong>al segments from the middle part<br />
<strong>of</strong> the ret<strong>in</strong>a and <strong>in</strong>cubat<strong>in</strong>g them <strong>in</strong> aCSF for 24 hours at 10,<br />
25, 50, or 75 mm Hg. The ret<strong>in</strong>as <strong>in</strong>cubated at 10 and 25 mm<br />
Hg exhibited a normal appearance (Figs. 2a, 2b, 2e, 2f). By<br />
contrast, pressure overload at 50 mm Hg led to axonal swell<strong>in</strong>g<br />
<strong>in</strong> the NFL (Figs. 2c, 2g). The other ret<strong>in</strong>al layers rema<strong>in</strong>ed<br />
<strong>in</strong>tact except the IPL, <strong>in</strong> which several small vacuoles were<br />
present. <strong>Pressure</strong> overload at 75 mm Hg <strong>in</strong>creased the density<br />
and size <strong>of</strong> the swollen axons <strong>in</strong> the NFL (Fig. 2d, 2h), and small<br />
vacuoles were present <strong>in</strong> the IPL. A few GC nuclei became<br />
pyknotic and shrunken at 50 and 75 mm Hg (Figs. 2g, 2h).<br />
Glutamate-Dependent Changes <strong>in</strong> the<br />
Peripheral Ret<strong>in</strong>as<br />
The concentration dependence <strong>of</strong> glutamate toxicity was determ<strong>in</strong>ed<br />
by <strong>in</strong>cubat<strong>in</strong>g ret<strong>in</strong>al segments obta<strong>in</strong>ed from the<br />
middle part <strong>of</strong> the ret<strong>in</strong>a with various concentrations <strong>of</strong> glutamate<br />
for 24 hours at 10 mm Hg. Adm<strong>in</strong>istration <strong>of</strong> 30 M<br />
glutamate did not <strong>in</strong>duce remarkable changes <strong>in</strong> any layers <strong>of</strong><br />
the ret<strong>in</strong>a (Fig. 3a). Müller cell swell<strong>in</strong>g was <strong>in</strong>duced by 300<br />
M glutamate without detectable changes <strong>in</strong> the ret<strong>in</strong>al neurons<br />
(Fig. 3b). Several GCs showed degeneration and shr<strong>in</strong>kage<br />
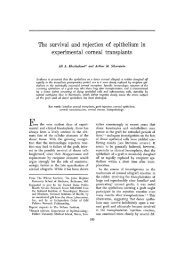
FIGURE 2. Light micrographs <strong>of</strong> pressure-dependent changes <strong>in</strong> the<br />
middle part <strong>of</strong> the ret<strong>in</strong>a. In ret<strong>in</strong>as <strong>in</strong>cubated at (a) 10 and (b) 25mm<br />
Hg, no abnormal changes were detected <strong>in</strong> any layers. (c) Axonal<br />
swell<strong>in</strong>g (arrowheads) was found <strong>in</strong> the NFL <strong>of</strong> a ret<strong>in</strong>a <strong>in</strong>cubated at<br />
50 mm Hg. Several small vacuoles were present <strong>in</strong> the IPL. The other<br />
ret<strong>in</strong>al layers rema<strong>in</strong>ed <strong>in</strong>tact. (d) Prom<strong>in</strong>ent swell<strong>in</strong>g <strong>of</strong> the optic<br />
nerve fibers (arrowheads) was observed <strong>in</strong> a ret<strong>in</strong>a <strong>in</strong>cubated at 75<br />
mm Hg. Several small vacuoles were present <strong>in</strong> the IPL. Ret<strong>in</strong>al degeneration<br />
was not observed <strong>in</strong> other layers <strong>of</strong> the ret<strong>in</strong>a. Light micrographs<br />
<strong>of</strong> pressure-dependent changes <strong>in</strong> the NFL. In ret<strong>in</strong>as <strong>in</strong>cubated<br />
at (e) 10and(f) 25 mm Hg, no remarkable changes were<br />
observed. (g) Axonal swell<strong>in</strong>g was found <strong>in</strong> the NFL <strong>of</strong> a ret<strong>in</strong>a<br />
<strong>in</strong>cubated at 50 mm Hg. Arrowheads: shrunken nuclei <strong>of</strong> GCs. (h) A<br />
ret<strong>in</strong>a <strong>in</strong>cubated at 75 mm Hg exhibited remarkable swell<strong>in</strong>g <strong>of</strong> the<br />
optic nerve fibers <strong>in</strong> the NFL. Arrowheads: shrunken GC nuclei;<br />
arrow: a capillary. Scale bar: (a–d) 10m; (e–h) 23m.
IOVS, December 2010, Vol. 51, No. 12 <strong>Pressure</strong> Elevation and Ret<strong>in</strong>al Excitotoxicity 6417<br />
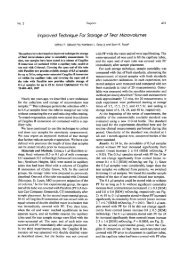
FIGURE 3. Light micrographs <strong>of</strong> glutamate-dependent changes <strong>in</strong> the<br />
middle part <strong>of</strong> the ret<strong>in</strong>a. (a) No remarkable changes were <strong>in</strong>duced by<br />
30 M glutamate <strong>in</strong> any layers <strong>of</strong> the ret<strong>in</strong>a <strong>in</strong>cubated at 10 mm Hg.<br />
OLM, outer limit<strong>in</strong>g membrane. (b) This ret<strong>in</strong>a exhibited Müller cell<br />
swell<strong>in</strong>g beneath the ILM (✱) <strong>in</strong>duced by 300 M glutamate at 10 mm<br />
Hg. The glial swell<strong>in</strong>g was also observed <strong>in</strong> the IPL (arrowheads), INL<br />
(arrows), and ONL (✯). (c) A ret<strong>in</strong>a exhibit<strong>in</strong>g prom<strong>in</strong>ent Müller cell<br />
swell<strong>in</strong>g beneath the ILM (✱) <strong>in</strong>duced by 1.0 mM glutamate at 10 mm<br />
Hg. Glial swell<strong>in</strong>g is observed <strong>in</strong> the IPL (arrowheads), INL (arrows),<br />
and ONL (✯). Scale bar, 15 m.<br />
<strong>of</strong> the nuclei. The ret<strong>in</strong>as exposed to 1.0 mM glutamate also<br />
showed Müller cell swell<strong>in</strong>g along with nuclear pyknosis <strong>in</strong> the<br />
GC layer (GCL; Fig. 3c).<br />
<strong>Effects</strong> <strong>of</strong> <strong>Pressure</strong> on Glutamate-Induced Toxicity<br />
Adm<strong>in</strong>istration <strong>of</strong> 30 M glutamate did not <strong>in</strong>duce remarkable<br />
changes <strong>in</strong> any layers <strong>of</strong> the ret<strong>in</strong>a at 25 mm Hg (Fig. 4a).<br />
Prom<strong>in</strong>ent axonal swell<strong>in</strong>g was <strong>in</strong>duced by 30 M glutamate at<br />
50 mm Hg (Fig. 4b), and several GCs showed degeneration and<br />
nuclear shr<strong>in</strong>kage. Dendritic swell<strong>in</strong>g <strong>in</strong> the IPL and nuclear<br />
shr<strong>in</strong>kage <strong>in</strong> the INL were also observed. Ret<strong>in</strong>as exposed to 30<br />
M glutamate at 75 mm Hg showed axonal swell<strong>in</strong>g <strong>in</strong> the NFL<br />
along with excitotoxic neural damage, characterized by a spongiform<br />
appearance <strong>of</strong> the IPL and bull’s-eye formation <strong>in</strong> the<br />
INL (Fig. 4c).<br />
Adm<strong>in</strong>istration <strong>of</strong> 300 M glutamate <strong>in</strong>duced pyknosis <strong>of</strong><br />
GC nuclei at 25 mm Hg along with prom<strong>in</strong>ent Müller cell<br />
swell<strong>in</strong>g (Fig. 4d). At 50 and 75 mm Hg, adm<strong>in</strong>istration <strong>of</strong><br />
300 M glutamate <strong>in</strong>duced typical excitotoxic neural damage<br />
characterized by dendritic swell<strong>in</strong>g <strong>in</strong> the IPL and bull’seye<br />
formation <strong>in</strong> the INL, along with axonal swell<strong>in</strong>g <strong>in</strong> the<br />
NFL (Figs. 4e, 4f).<br />
Adm<strong>in</strong>istration <strong>of</strong> 1.0 mM glutamate caused marked Müller<br />
cell swell<strong>in</strong>g <strong>in</strong> the <strong>in</strong>ner ret<strong>in</strong>a at 25 mm Hg (Fig. 4g). In<br />
addition, nuclei <strong>of</strong> the GCs developed a shrunken appearance.<br />
Adm<strong>in</strong>istration <strong>of</strong> 1.0 mM, glutamate at 50 and 75 mm Hg<br />
<strong>in</strong>duced excitotoxic neural damage, along with axonal swell<strong>in</strong>g<br />
<strong>in</strong> the NFL (Figs. 4h, 4i). In addition, the optic nerve fibers and<br />
GCs showed severe damage.<br />
Structural Changes Induced by <strong>Pressure</strong> Elevation<br />
and Glutamate <strong>in</strong> the Ganglion Cell Layer and<br />
Optic Disc Region<br />
Middle Part <strong>of</strong> the Ret<strong>in</strong>a. Compared with the control<br />
ret<strong>in</strong>as (Fig. 5a), a few GC nuclei became pyknotic and<br />
shrunken, and marked axonal swell<strong>in</strong>g was observed <strong>in</strong> the<br />
NFL <strong>in</strong> ret<strong>in</strong>as at high pressure (Fig. 5b). After exposure to<br />
glutamate at control pressure, the GCs were surrounded by the<br />
swollen end feet <strong>of</strong> Müller cells (Fig. 5c). A few <strong>of</strong> the GC<br />
nuclei became pyknotic and shrunken. With the comb<strong>in</strong>ation<br />
<strong>of</strong> high pressure and glutamate, the GCs became necrotic, and<br />
most exhibited nuclear chromat<strong>in</strong> condensation (Fig. 5d). Severe<br />
degeneration was <strong>in</strong>duced <strong>in</strong> the NFL.<br />
Central Ret<strong>in</strong>a around the Optic Disc. Control ret<strong>in</strong>as<br />
showed a normal appearance <strong>in</strong> the vic<strong>in</strong>ity <strong>of</strong> the optic disc<br />
(Fig. 5e). The NFL adjacent to the optic disc was prom<strong>in</strong>ently<br />
thick but exhibited a gradual decrease <strong>in</strong> thickness toward the<br />
peripheral ret<strong>in</strong>a. High pressure (75 mm Hg) <strong>in</strong>duced remarkable<br />
axonal swell<strong>in</strong>g <strong>in</strong> the optic disc region (Fig. 5f), and<br />
several GC nuclei showed degeneration. The rema<strong>in</strong><strong>in</strong>g layers<br />
<strong>in</strong> the ret<strong>in</strong>a showed no remarkable changes. Adm<strong>in</strong>istration <strong>of</strong><br />
1.0 mM glutamate caused swell<strong>in</strong>g <strong>of</strong> the Müller glia surround<strong>in</strong>g<br />
the optic nerve fiber bundles <strong>in</strong> the vic<strong>in</strong>ity <strong>of</strong> the optic<br />
disc (Fig. 5g). Some excitotoxic degeneration, characterized by<br />
bull’s-eye formation <strong>in</strong> the INL and a spongiform appearance <strong>in</strong><br />
the IPL, was noted, but the changes were not dramatic. Ganglion<br />
cells appeared to be float<strong>in</strong>g <strong>in</strong> the swollen end-feet <strong>of</strong><br />
Müller cells. The comb<strong>in</strong>ation <strong>of</strong> high pressure and glutamate<br />
<strong>in</strong>duced severe excitotoxic ret<strong>in</strong>al degeneration, and optic<br />
nerve fibers also showed severe degeneration (Fig. 5h).<br />
Optic Disc Area. In control ret<strong>in</strong>as, the lam<strong>in</strong>a cribrosa <strong>of</strong><br />
the optic disc was rudimentary (Fig. 5i). The axons <strong>of</strong> the GCs<br />
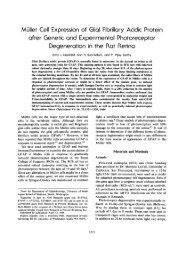
FIGURE 4. Light micrographs <strong>of</strong> pressure- and glutamate-dependent<br />
changes <strong>in</strong> the middle part <strong>of</strong> the ret<strong>in</strong>a. OLM, outer limit<strong>in</strong>g membrane.<br />
(a) Adm<strong>in</strong>istration <strong>of</strong> 30 M glutamate at 25 mm Hg <strong>in</strong>duced no<br />
remarkable changes. (b) Adm<strong>in</strong>istration <strong>of</strong> 30 M glutamate (GA) at 50<br />
mm Hg <strong>in</strong>duced marked axonal swell<strong>in</strong>g (arrowheads) <strong>in</strong> the NFL.<br />
Several GCs showed nuclear pyknosis. The ret<strong>in</strong>a exhibited a spongy<br />
appearance <strong>in</strong> the IPL and neural degeneration <strong>in</strong> the INL (arrows).<br />
(c) A ret<strong>in</strong>a exposed to 30 M glutamate at 75 mm Hg showed axonal<br />
swell<strong>in</strong>g (arrowheads) <strong>in</strong> the NFL, along with neural degeneration <strong>in</strong><br />
the IPL, INL, and ONL. (d) Adm<strong>in</strong>istration <strong>of</strong> 300 M glutamate <strong>in</strong>duced<br />
Müller cell swell<strong>in</strong>g and pyknosis <strong>of</strong> the GCs at 25 mm Hg. Glial<br />
swell<strong>in</strong>g was observed beneath the ILM (✱), and <strong>in</strong> the INL (arrows)<br />
and ONL (arrowheads). (e, f) Adm<strong>in</strong>istration <strong>of</strong> 300 M glutamate<br />
<strong>in</strong>duced excitotoxic neural damage, characterized by dendritic swell<strong>in</strong>g<br />
<strong>in</strong> the IPL and bull’s-eye formation <strong>in</strong> the INL at (e) 50 and (f) 75<br />
mm Hg. The optic nerve fibers <strong>in</strong> the NFL were swollen and damaged<br />
and nuclei <strong>of</strong> GCs became pyknotic. (g) Ret<strong>in</strong>a exhibit<strong>in</strong>g prom<strong>in</strong>ent<br />
Müller cell swell<strong>in</strong>g beneath the ILM (✱) <strong>in</strong>duced by 1.0 mM glutamate<br />
at 25 mm Hg. Glial swell<strong>in</strong>g was observed <strong>in</strong> the INL (arrows) and ONL<br />
(arrowheads). Adm<strong>in</strong>istration <strong>of</strong> 1.0 mM glutamate <strong>in</strong>duced excitotoxic<br />
neural damage, characterized by dendritic swell<strong>in</strong>g <strong>in</strong> the IPL and<br />
bull’s-eye formation <strong>in</strong> the INL at (h) 50 and (i) 75 mm Hg. The optic<br />
nerve fibers were swollen and damaged <strong>in</strong> the NFL. The GCL showed<br />
severe degeneration. Scale bar, 55 m.
6418 Ishikawa et al. IOVS, December 2010, Vol. 51, No. 12<br />
FIGURE 5. Light micrographs <strong>of</strong> the<br />
GCL <strong>in</strong> the middle ret<strong>in</strong>al segments.<br />
(a) A control ret<strong>in</strong>a <strong>in</strong>cubated at 10<br />
mm Hg. (b) Axonal swell<strong>in</strong>g <strong>of</strong> the<br />
ret<strong>in</strong>al GCs was observed after exposure<br />
to elevated hydrostatic pressure<br />
(75 mm Hg). A small number <strong>of</strong> GCs<br />
showed nuclear pyknosis (arrowhead).<br />
Open arrows <strong>in</strong>dicate the<br />
process <strong>of</strong> a Müller cell surround<strong>in</strong>g<br />
the GCs. (c) Müller cell swell<strong>in</strong>g<br />
(✱) was <strong>in</strong>duced by adm<strong>in</strong>istration<br />
<strong>of</strong> 1.0 mM glutamate. Several GCs<br />
showed nuclear pyknosis (arrowheads).<br />
(d) The comb<strong>in</strong>ation <strong>of</strong> 1.0<br />
mM glutamate and 75 mm Hg pressure<br />
load<strong>in</strong>g resulted <strong>in</strong> severe excitotoxicity.<br />
The NFL exhibits marked<br />
degeneration, and GCs show necrosis<br />
(arrow) or nuclear pyknosis (arrowheads).<br />
(e–h) Light micrographs<br />
<strong>in</strong> regions adjacent to the optic discs (the optic disc is usually situated to the left <strong>in</strong> each photograph). (e) A ret<strong>in</strong>a <strong>in</strong>cubated at 10 mm Hg show<strong>in</strong>g<br />
normal appearance. The NFL was prom<strong>in</strong>ent <strong>in</strong> the vic<strong>in</strong>ity <strong>of</strong> the optic disc, but tapered <strong>of</strong>f toward the periphery <strong>in</strong> the control ret<strong>in</strong>a.<br />
(f) Remarkable axonal swell<strong>in</strong>g <strong>in</strong> the NFL was <strong>in</strong>duced by pressure load<strong>in</strong>g (75 mm Hg). Several GCs exhibited degeneration (arrowheads). No<br />
significant changes were observed <strong>in</strong> the rema<strong>in</strong><strong>in</strong>g layers <strong>of</strong> the ret<strong>in</strong>a. (g) Adm<strong>in</strong>istration <strong>of</strong> 1.0 mM glutamate <strong>in</strong>duced Müller cell swell<strong>in</strong>g (✱)<br />
adjacent to the nerve fiber bundles <strong>in</strong> the NFL. GCs (arrows) are observed float<strong>in</strong>g <strong>in</strong> swollen Müller cell. Black arrows: degenerated GCs.<br />
Excitotoxic changes characterized by bull’s-eye formation (white arrows) <strong>in</strong> the INL and a spongiform appearance <strong>of</strong> synapses <strong>in</strong> the IPL were<br />
observed. White arrowheads:Müller cell swell<strong>in</strong>g <strong>in</strong> the INL. (h) Excitotoxic degeneration characterized by bull’s-eye formation (arrows) <strong>in</strong> the INL and<br />
Swiss cheese–pattern dendritic swell<strong>in</strong>g <strong>in</strong> the IPL was <strong>in</strong>duced by comb<strong>in</strong><strong>in</strong>g pressure load<strong>in</strong>g (75 mm Hg) and glutamate (1.0 mM). The NFL and GCs<br />
(open arrows) were severely damaged. (i–l) Light micrographs <strong>of</strong> the optic discs. (i) A control ret<strong>in</strong>a <strong>in</strong>cubated at 10 mm Hg. The rat optic nerve<br />
head has only rudimentary lam<strong>in</strong>a cribrosa. Unmyel<strong>in</strong>ated fibers run through the scleral canal, and converge <strong>in</strong>to the optic nerve. A, central ret<strong>in</strong>al<br />
artery; V, central ret<strong>in</strong>al ve<strong>in</strong>. (j) After pressure load<strong>in</strong>g (75 mm Hg), the axons <strong>in</strong> the optic nerve head were swollen. (k) Adm<strong>in</strong>istration <strong>of</strong> 1.0<br />
mM glutamate-<strong>in</strong>duced neural degeneration <strong>in</strong> the IPL and INL. (l) A comb<strong>in</strong>ation <strong>of</strong> pressure load<strong>in</strong>g (75 mm Hg) and glutamate (1.0 mM)<br />
<strong>in</strong>duced severe degeneration <strong>in</strong> the NFL and excitotoxic degeneration <strong>in</strong> the rema<strong>in</strong><strong>in</strong>g layers <strong>of</strong> the ret<strong>in</strong>a. Scale bar: (a–d) 12m; (e–h)<br />
35 m; (i–l) 65m.<br />
organized <strong>in</strong>to bundles and extended to the optic nerve<br />
through the scleral canal. At high pressure (75 mm Hg), axonal<br />
swell<strong>in</strong>g <strong>in</strong> the optic disc led to histologic evidence <strong>of</strong> disc<br />
edema (Fig. 5j). Adm<strong>in</strong>istration <strong>of</strong> glutamate (1.0 mM) <strong>in</strong>duced<br />
neuronal degeneration <strong>in</strong> the IPL and the INL (Fig. 5k). Comb<strong>in</strong>ation<br />
<strong>of</strong> high pressure and glutamate <strong>in</strong>duced excitotoxic<br />
degeneration, and optic nerve fibers exhibited severe degeneration<br />
(Fig. 5l).<br />
Involvement <strong>of</strong> Glutamate Receptors <strong>in</strong> Axonal<br />
Swell<strong>in</strong>g Induced by <strong>Pressure</strong> Elevation<br />
To determ<strong>in</strong>e whether the axonal swell<strong>in</strong>g <strong>in</strong>duced by pressure<br />
elevation resulted from the activation <strong>of</strong> glutamate receptors,<br />
we adm<strong>in</strong>istered GYKI, a non-NMDA receptor antagonist,<br />
and MK-801, an NMDA receptor antagonist, alone or <strong>in</strong> comb<strong>in</strong>ation,<br />
to ret<strong>in</strong>as exposed to high pressure (75 mm Hg) for<br />
24 hours. GYKI partially attenuated the axonal swell<strong>in</strong>g and<br />
significantly reduced the number <strong>of</strong> swollen axons (Fig. 6a). In<br />
contrast, MK-801-treated ret<strong>in</strong>as showed substantial neuroprotection<br />
aga<strong>in</strong>st high pressure, but failed to protect the GC<br />
nuclei (Fig. 6b), many <strong>of</strong> which showed pyknosis or nuclear<br />
shr<strong>in</strong>kage. GYKI and MK-801 comb<strong>in</strong>ed provided nearly complete<br />
neuroprotection (Fig. 6c).<br />
Reversibility <strong>of</strong> Glutamate-Induced Müller<br />
Cell Swell<strong>in</strong>g<br />
To exam<strong>in</strong>e the reversibility <strong>of</strong> Müller cell swell<strong>in</strong>g, we<br />
shortened the <strong>in</strong>cubation period with glutamate to 30 m<strong>in</strong>utes.<br />
After that time, Müller cell swell<strong>in</strong>g was apparent <strong>in</strong><br />
the end feet <strong>in</strong> the GCL and <strong>in</strong> glial nuclei <strong>of</strong> the INL<br />
(Fig. 7a). The swell<strong>in</strong>g was reversed by subsequent <strong>in</strong>cubation<br />
<strong>in</strong> drug-free medium for 20 hours at 30°C without<br />
pressure elevation (Fig. 7b). In contrast, the reversibility <strong>of</strong><br />
glutamate-mediated Müller cell swell<strong>in</strong>g was <strong>in</strong>hibited by<br />
subsequent <strong>in</strong>cubation <strong>in</strong> the drug-free medium for 20 hours<br />
under high-pressure load<strong>in</strong>g (75 mm Hg; Fig. 7c). Ret<strong>in</strong>al<br />
segments exposed to high pressure for 20 hours and then<br />
<strong>in</strong>cubation with 1.0 mM glutamate for 30 m<strong>in</strong>utes showed<br />
apparent swell<strong>in</strong>g <strong>of</strong> the end feet <strong>of</strong> the Müller cells <strong>in</strong> the<br />
GCL and <strong>in</strong> glial nuclei <strong>in</strong> the INL (Fig. 7d).<br />
FIGURE 6. Light micrographs <strong>of</strong> middle ret<strong>in</strong>al segments treated with<br />
glutamate receptor antagonists. (a) Ret<strong>in</strong>al segments exposed to elevated<br />
pressure (75 mm Hg) and treated with 100 M GYKI alone had<br />
partial axonal swell<strong>in</strong>g (arrowheads) <strong>in</strong> the NFL. OLM outer limit<strong>in</strong>g<br />
membrane. (b) MK-801 (10 M) alone substantially prevented axonal<br />
swell<strong>in</strong>g, but pyknotic GC nuclei rema<strong>in</strong>ed (arrow). No remarkable<br />
changes were observed <strong>in</strong> other layers <strong>of</strong> the ret<strong>in</strong>a. (c) A comb<strong>in</strong>ation<br />
<strong>of</strong> GYKI and MK-801 produced almost complete neuroprotection<br />
aga<strong>in</strong>st the effects <strong>of</strong> pressure load<strong>in</strong>g (75 mm Hg). Scale bar, 15 m.
IOVS, December 2010, Vol. 51, No. 12 <strong>Pressure</strong> Elevation and Ret<strong>in</strong>al Excitotoxicity 6419<br />
FIGURE 7. Reversibility <strong>of</strong> glutamatemediated<br />
Müller cell swell<strong>in</strong>g. (a) Glutamate<br />
(1.0 mM) adm<strong>in</strong>istered at normal<br />
pressure for 30 m<strong>in</strong>utes <strong>in</strong>duced<br />
swell<strong>in</strong>g <strong>of</strong> the Müller cell end feet (✱)<br />
<strong>in</strong> the GC layer and <strong>in</strong> the nuclei (arrows).<br />
Black arrowheads and arrows:<br />
swell<strong>in</strong>g <strong>of</strong> Müller cell bodies and nuclei,<br />
respectively. There was swell<strong>in</strong>g<br />
<strong>of</strong> Müller cell bodies <strong>in</strong> the outer nuclear<br />
layer (white arrowheads). OLM,<br />
outer limit<strong>in</strong>g membrane. (b) Müller<br />
cell swell<strong>in</strong>g <strong>in</strong>duced by 1.0 mM glutamate<br />
was not present 20 hours after<br />
removal <strong>of</strong> glutamate from the medium.<br />
OLM, outer limit<strong>in</strong>g membrane.<br />
(c) The reversal <strong>of</strong> Müller cell swell<strong>in</strong>g<br />
dur<strong>in</strong>g <strong>in</strong>cubation <strong>in</strong> glutamate-free<br />
medium was prevented by elevated<br />
pressure (75 mm Hg) for 20 hours. (✱)<br />
Swell<strong>in</strong>g <strong>of</strong> the Müller cell end feet. There was swell<strong>in</strong>g <strong>of</strong> Müller cell bodies <strong>in</strong> the IPL, INL, and ONL. Arrowheads: the degenerated or pyknotic GC<br />
nuclei. OLM, outer limit<strong>in</strong>g membrane. (d) Incubation with 1.0 mM glutamate after pressure load<strong>in</strong>g (75 mm Hg) for 20 hours <strong>in</strong>duced apparent swell<strong>in</strong>g<br />
<strong>of</strong> the Müller cell end feet (✱) <strong>in</strong> the GCL. Black arrowheads and arrows: the swell<strong>in</strong>g <strong>of</strong> the Müller cell bodies and nuclei, respectively. There was a<br />
remarkable swell<strong>in</strong>g <strong>of</strong> the Müller cell bodies <strong>in</strong> the ONL (✯). Arrowheads: degenerated or pyknotic GC nuclei. OLM, outer limit<strong>in</strong>g membrane. Scale<br />
bar, 15 m.<br />
Ultrastructural Investigation by<br />
Electron Microscopy<br />
Compared with control ret<strong>in</strong>as <strong>in</strong>cubated at 10 mm Hg (Fig. 8a),<br />
electron microscopy revealed degeneration and substantial<br />
swell<strong>in</strong>g <strong>of</strong> axons after exposure to high pressure (75 mm Hg;<br />
Fig. 8b). In addition, the comb<strong>in</strong>ation <strong>of</strong> high pressure and<br />
glutamate (1.0 mM) resulted <strong>in</strong> disruption <strong>of</strong> the GC axonal<br />
membranes (Fig. 8c) and marked accumulation <strong>of</strong> membranous<br />
structures or electron-dense materials <strong>in</strong> the swollen<br />
axons. The cytoplasm <strong>of</strong> the Müller cells became edematous,<br />
and electron-dense materials were deposited <strong>in</strong> some parts <strong>of</strong><br />
the cytoplasm. The comb<strong>in</strong>ation <strong>of</strong> high pressure and glutamate<br />
also <strong>in</strong>duced an <strong>in</strong>crease <strong>in</strong> the number <strong>of</strong> necrotic GCs<br />
(Fig. 8d), with chromat<strong>in</strong> condensation at the edge <strong>of</strong> the<br />
nucleus, and apoptotic bodies (Fig. 8e).<br />
Quantitative Analysis <strong>of</strong> the Structural Changes<br />
A quantitative assessment <strong>of</strong> the pressure-dependent structural<br />
changes is summarized <strong>in</strong> Table 1. The NFLT <strong>in</strong> ret<strong>in</strong>as <strong>in</strong>cu-<br />
FIGURE 8. Electron micrographs <strong>of</strong><br />
the NFL and GCL. (a) Control NFLs conta<strong>in</strong>ed<br />
numerous axons <strong>of</strong> various sizes.<br />
Each axon conta<strong>in</strong>ed neur<strong>of</strong>ilaments<br />
and microtubules. (b) After exposure to<br />
high pressure (75 mm Hg) for 24 hours,<br />
numerous axons <strong>in</strong> the NFL were swollen.<br />
Mt, mitochondrion; Mu, cytoplasm<br />
<strong>of</strong> the Müller cell. (c) After exposure to<br />
high pressure (75 mm Hg) and glutamate<br />
(1.0 mM), there were degenerated<br />
organelles (arrowheads) and filamentous<br />
structures (arrows) <strong>in</strong> the swollen<br />
axons. Electron-dense materials (✱) or<br />
granular structures are distributed <strong>in</strong> the<br />
cytoplasm <strong>of</strong> Müller cell (Mu). (d) After<br />
exposure to high pressure (75 mm Hg)<br />
and glutamate (1.0 mM), ganglion cells<br />
(G) became necrotic, as <strong>in</strong>dicated by the<br />
abundant presence <strong>of</strong> vacuoles <strong>in</strong> the<br />
cytoplasm. De, degenerated dendrites;<br />
Mu, edematous cytoplasm <strong>of</strong> the Müller<br />
cell. (e) Some GCs had condensed nuclear<br />
chromat<strong>in</strong> and cytoplasmic shr<strong>in</strong>kage.<br />
Scale bar: (a, b) 0.5 m; (c–e)2m.<br />
bated at higher pressure (50 or 75 mm Hg) was significantly<br />
<strong>in</strong>creased compared with that <strong>in</strong> the control ret<strong>in</strong>as (<strong>in</strong>cubated<br />
at 10 mm Hg). Similarly, the density <strong>of</strong> swollen axons and<br />
damaged GCs and NDS rat<strong>in</strong>gs were significantly <strong>in</strong>creased at<br />
higher pressures. <strong>Pressure</strong> overload at 75 mm Hg, compared<br />
with 50 mm Hg, <strong>in</strong>creased the NFLT, the densities <strong>of</strong> the<br />
swollen axons, and the damaged GCs and NDS (P 0.01).<br />
There were no significant differences <strong>in</strong> these parameters at 10<br />
and 25 mm Hg (P 0.87).<br />
The quantitative assessment <strong>of</strong> the structural changes <strong>in</strong>duced<br />
by high pressure (75 mm Hg) and/or adm<strong>in</strong>istration <strong>of</strong><br />
1.0 mM glutamate is summarized <strong>in</strong> Table 2. The NFLT after<br />
exposure to high pressure alone or after a comb<strong>in</strong>ation <strong>of</strong> high<br />
pressure and 1.0 mM glutamate was significantly <strong>in</strong>creased<br />
compared with that <strong>in</strong> the control ret<strong>in</strong>as, whereas glutamate<br />
alone did not <strong>in</strong>crease NFLT <strong>in</strong> the middle and central ret<strong>in</strong>a.<br />
Similarly, the densities <strong>of</strong> swollen axons and damaged GCs and<br />
the NDS were significantly <strong>in</strong>creased after exposure to high<br />
pressure or a comb<strong>in</strong>ation <strong>of</strong> glutamate and high pressure. The
6420 Ishikawa et al. IOVS, December 2010, Vol. 51, No. 12<br />
TABLE 1. <strong>Pressure</strong>-Dependent Changes <strong>in</strong> NFLT or a Percentage <strong>of</strong> NFLT to Total Ret<strong>in</strong>al Thickness, Densities <strong>of</strong> Swollen Axons (Ax), and<br />
Damaged GCs and NDS<br />
Condition (n) NFLT SE (m) [P] NFLT SE (%) [P] Ax SE (n) [P] GC SE (n) [P] NDS SE (n) [P]<br />
10 mm Hg (5) 2.4 1.3 [] 1.5 0.6 [] 0.2 0.5 [] 0.5 0.2 [] 0.1 0.1 []<br />
25 mm Hg (5) 2.6 1.2 [0.92] 1.7 0.7 [0.96] 0.3 0.7 [0.98] 0.6 0.4 [0.89] 0.2 0.1 [0.93]<br />
50 mm Hg (5) 7.9 4.2 [0.002]* 5.8 1.7 [0.002]* 6.5 4.6 [0.001]* 7.5 2.8 [0.002]* 0.8 0.3 [0.010]*<br />
75 mm Hg (7) 12.8 3.7 [0.001]* 9.2 2.6 [0.001]* 13.5 4.3 [0.001]* 8.8 3.6 [0.002]* 0.9 0.4 [0.009]*<br />
The density <strong>of</strong> swollen axons was counted per 100 m 2 <strong>of</strong> the NFL. The density <strong>of</strong> damaged GCs was counted per 500 m <strong>of</strong> ret<strong>in</strong>a. Ps were<br />
calculated vs. the control (10 mm Hg) by Mann-Whitney U test.<br />
* Statistical significance was set at P 0.05.<br />
density <strong>of</strong> damaged GCs also <strong>in</strong>creased after the adm<strong>in</strong>istration<br />
<strong>of</strong> glutamate.<br />
Quantitative assessment <strong>of</strong> the structural changes <strong>in</strong> the<br />
presence <strong>of</strong> the glutamate receptor antagonists GYKI and MK-<br />
801 is summarized <strong>in</strong> Table 3. The NFLT <strong>in</strong> the ret<strong>in</strong>as treated<br />
with GYKI alone was significantly greater than <strong>in</strong> the control<br />
ret<strong>in</strong>as. Similarly, the density <strong>of</strong> swollen axons and the NDS<br />
were significantly <strong>in</strong>creased after treatment with GYKI alone<br />
compared with that <strong>in</strong> the control ret<strong>in</strong>as. The density <strong>of</strong> the<br />
damaged GCs was greater <strong>in</strong> the ret<strong>in</strong>as treated with GYKI<br />
alone or MK-801 alone compared with those <strong>in</strong> the control<br />
ret<strong>in</strong>as. By contrast, there were no significant differences <strong>in</strong><br />
these parameters compared with those <strong>in</strong> the control <strong>in</strong> ret<strong>in</strong>as<br />
treated with a comb<strong>in</strong>ation <strong>of</strong> GYKI and MK-801.<br />
To confirm the reproducibility <strong>of</strong> data assessment, we evaluated<br />
the significance <strong>of</strong> <strong>in</strong>dividual differences <strong>in</strong> the raters by<br />
one-way ANOVA followed by the Tukey-Kramer test. For example,<br />
there was no significant difference <strong>in</strong> the NFLT at 10<br />
mm Hg between three raters (27 df, P 0.05 by one-way<br />
ANOVA). As a result, there were no significant <strong>in</strong>dividual differences<br />
between the raters for each morphometric parameter.<br />
GFAP Immunoreactivity<br />
GFAP was expressed by the end feet <strong>of</strong> the Müller cells <strong>in</strong> the<br />
ret<strong>in</strong>as <strong>in</strong>cubated at pressures <strong>of</strong> 10 mm Hg (Fig. 9a) and 25<br />
mm Hg (Fig. 9b). The Müller cells expressed GFAP <strong>in</strong> the <strong>in</strong>ner<br />
ret<strong>in</strong>a after exposure to higher pressure (50 mm Hg) for 24<br />
hours (Fig. 9c), and GFAP expression markedly <strong>in</strong>creased after<br />
<strong>in</strong>cubation at 75 mm Hg (Fig. 9d). After exposure to 1.0 mM<br />
glutamate alone, expression was conf<strong>in</strong>ed <strong>in</strong> the vic<strong>in</strong>ity <strong>of</strong> the<br />
end feet <strong>of</strong> the Müller cells (Fig. 9e). The comb<strong>in</strong>ation <strong>of</strong> high<br />
pressure (75 mm Hg) and 1.0 mM glutamate <strong>in</strong>duced extensive<br />
Müller cell GFAP expression, even extend<strong>in</strong>g <strong>in</strong>to the <strong>in</strong>ner<br />
ret<strong>in</strong>a (Fig. 9f).<br />
GS Activity<br />
A colorimetric enzyme assay showed GS activity to be 144 <br />
29, 140 23, 112 17, and 92 25 U/mg prote<strong>in</strong> at 10, 25,<br />
50, and 75 mm Hg, respectively (Fig. 10). There were no<br />
significant differences <strong>in</strong> GS activity between pressures <strong>of</strong> 10<br />
and 25 mm Hg. GS activity was significantly reduced at 50 and<br />
75 mm Hg compared with that at 10 mm Hg. In addition, there<br />
was a significant reduction <strong>of</strong> GS activity at 75 mm Hg compared<br />
with that at 50 mm Hg.<br />
DISCUSSION<br />
In the present study, we developed a new ex vivo experimental<br />
model for acute glaucoma that <strong>in</strong>volves <strong>in</strong>cubat<strong>in</strong>g rat ret<strong>in</strong>al<br />
segments under hydrostatic pressure at the bottom <strong>of</strong> a<br />
deep cyl<strong>in</strong>der. Although this system produced reliable results,<br />
we noted several limitations <strong>in</strong> the model. First, critical survival<br />
factors supplied from the bloodstream or axonal transport<br />
were not provided to the ret<strong>in</strong>al segments. Thus, the <strong>in</strong>cubation<br />
period had to be time limited. Second, the hydrostatic<br />
pressure used did not precisely simulate the pressure changes<br />
observed <strong>in</strong> glaucoma. <strong>Pressure</strong> was exerted on the submerged<br />
ret<strong>in</strong>al segments from all directions. In contrast, the <strong>in</strong>tact<br />
ret<strong>in</strong>a, as a membranous tissue, receives pressure from only<br />
one direction. Furthermore, <strong>in</strong>terpretation <strong>of</strong> the damage was<br />
complicated because separation <strong>of</strong> the pigment layer dur<strong>in</strong>g<br />
dissection may cause a situation similar to ret<strong>in</strong>al detachment<br />
and because optic nerve transection dur<strong>in</strong>g dissection may<br />
<strong>in</strong>duce additional damage. Despite these limitations, we believe<br />
that our ex vivo experimental model is beneficial for<br />
address<strong>in</strong>g questions about mechanisms contribut<strong>in</strong>g to glaucoma.<br />
The advantages <strong>of</strong> this model <strong>in</strong>clude the higher degree<br />
<strong>of</strong> control over experimental variables and better preservation<br />
<strong>of</strong> neuron–neuron and neuron–glial <strong>in</strong>teractions than is possible<br />
<strong>in</strong> dissociated cell preparations.<br />
Of <strong>in</strong>terest <strong>in</strong> the present study is the f<strong>in</strong>d<strong>in</strong>g that axonal<br />
swell<strong>in</strong>g <strong>of</strong> the GCs was <strong>in</strong>duced <strong>in</strong> a pressure-dependent<br />
manner. The ret<strong>in</strong>as <strong>in</strong>cubated <strong>in</strong> control pressure exhibited<br />
normal appearance, whereas axonal swell<strong>in</strong>g became more<br />
prom<strong>in</strong>ent as pressure <strong>in</strong>creased. In the central nervous sys-<br />
TABLE 2. <strong>Effects</strong> <strong>of</strong> <strong>Pressure</strong> Elevation to 75 mm Hg and 1.0 mM GA on NFLT or a Percentage <strong>of</strong> NFLT to Total Ret<strong>in</strong>al Thickness, Density <strong>of</strong><br />
Swollen Axons (Ax), and Damaged GCs and NDS<br />
Condition (n)<br />
Middle NFLT SE<br />
(m) [P] NFLT <br />
SE (%) [P]<br />
Central NFLT SE<br />
(m) [P] NFLT <br />
SE (%) [P] Middle Ax SE [P] Middle GC SE [P]<br />
Whole Ret<strong>in</strong>a<br />
NDS SE [P]<br />
Control (5) 2.6 0.8 [] 13.5 2.6 [] 0.9 0.5 [] 0.1 0.5 [] 0.2 0.1 []<br />
1.4 0.5 [] 6.1 1.2 []<br />
<strong>Pressure</strong> (5) 13.9 4.7 [0.001]* 22.9 4.4 [0.001]* 11.2 2.5 [0.001]* 9.7 5.6 [0.001]* 1.0 0.5 [0.002]*<br />
9.0 2.4 [0.001]* 9.3 1.6 [0.002]*<br />
GA (5) 2.7 0.9 [0.96] 12.9 2.0 [0.82] 1.3 0.7 [0.99] 10.0 1.5 [0.001]* 0.4 0.4 [0.29]<br />
1.5 0.7 [] 5.8 2.2 [0.93]<br />
<strong>Pressure</strong> GA (7) 15.4 3.5 [0.001]* 25.3 8.9 [0.001]* 38.3 6.3 [0.001]* 20.1 5.6 [0.001]* 3.6 0.5 [0.001]*<br />
9.8 3.4 [0.001]* 11.3 5.4 [0.002]*<br />
Axon and GC counts and calculation <strong>of</strong> probabilities are as described <strong>in</strong> Table 1. GA, glutamate.<br />
* Statistical significance was set at P 0.05.
IOVS, December 2010, Vol. 51, No. 12 <strong>Pressure</strong> Elevation and Ret<strong>in</strong>al Excitotoxicity 6421<br />
TABLE 3. <strong>Effects</strong> <strong>of</strong> the Glutamate Receptor Antagonists GYKI and MK-801 on NFLT or a Percentage <strong>of</strong> NFLT to Total Ret<strong>in</strong>al Thickness,<br />
Density <strong>of</strong> Swollen Axons (Ax), and Damaged GCs and NDS <strong>in</strong> the Middle Ret<strong>in</strong>a<br />
Condition (n) NFLT SE (m) [P] NFLT SE (%) [P] Ax SE (n) [P] GC SE (n) [P] NDS SE (n) [P]<br />
Control (5) 3.4 1.8 [] 2.1 1.3% [] 0.6 0.4 [] 0.6 0.5 [] 0.3 0.2 []<br />
GYKI alone (6) 7.8 3.7 [0.032]* 4.2 1.6 [0.034]* 6.5 3.8 [0.005]* 2.5 1.6 [0.045]* 0.7 0.3 [0.043]*<br />
MK-801 (5) 2.7 0.9 [0.91] 1.2 0.7 [0.88] 0.3 0.7 [0.89] 2.3 1.2 [0.034]* 0.6 0.4 [0.39]<br />
GYKI MK-801 (7) 2.4 0.5 [0.98] 1.8 0.6 [0.79] 0.2 0.5 [0.98] 0.3 0.6 [0.84] 0.3 0.3 [0.85]<br />
Axon and GC counts and calculation <strong>of</strong> probabilities are as described <strong>in</strong> Table 1. GA, glutamate.<br />
* Statistical significance was set at P 0.05.<br />
tem, activation <strong>of</strong> neuronal glutamate receptors <strong>in</strong>duces swell<strong>in</strong>g<br />
<strong>of</strong> cell bodies and dendrites 27–30 and also produces Na -<br />
dependent blebs <strong>in</strong> acutely isolated hippocampal neurons. 31<br />
This swell<strong>in</strong>g is caused by the <strong>in</strong>flux <strong>of</strong> Na and Ca 2 and the<br />
passive redistribution <strong>of</strong> chloride and water across neuronal<br />
membranes. 29,32 Similar events occurr<strong>in</strong>g <strong>in</strong> axons could contribute<br />
to the f<strong>in</strong>d<strong>in</strong>gs observed <strong>in</strong> this study. Because a comb<strong>in</strong>ation<br />
<strong>of</strong> the glutamate receptor antagonists GYKI and MK-801 attenuated<br />
the axonal swell<strong>in</strong>g, we hypothesize that glutamate-mediated<br />
excitotoxicity contributes to the development <strong>of</strong> axonal swell<strong>in</strong>g<br />
<strong>in</strong> hyperbaric conditions. The partial attenuation <strong>of</strong> the<br />
axonal swell<strong>in</strong>g by GYKI alone may be expla<strong>in</strong>ed by a smaller<br />
contribution <strong>of</strong> non-NMDA receptors to pressure-<strong>in</strong>duced ret<strong>in</strong>al<br />
damage and may also reflect the predom<strong>in</strong>ant distribution<br />
<strong>of</strong> NMDA receptors <strong>in</strong> GCs. 33<br />
It has been reported that presynaptically released glutamate<br />
may reach levels <strong>of</strong> 1.0 mM <strong>in</strong> the synaptic cleft. 34 We have<br />
shown that, <strong>in</strong> normal conditions, 1.0 mM glutamate <strong>in</strong>duces<br />
significant changes <strong>in</strong> the ret<strong>in</strong>a as a result <strong>of</strong> Müller cell uptake<br />
<strong>of</strong> glutamate along with sodium ions. However, this Müller cell<br />
swell<strong>in</strong>g is reversible after glutamate washout, and neurons are<br />
not damaged. Higher concentrations <strong>of</strong> glutamate may <strong>in</strong>duce<br />
neuronal damage, 12 and concentrations below 100 M produce<br />
few changes <strong>in</strong> either Müller cells or neurons. In the<br />
present study, we observed that 30 M glutamate did not<br />
<strong>in</strong>duce remarkable changes <strong>in</strong> any layers <strong>of</strong> the ret<strong>in</strong>a at the<br />
lower pressures (10 or 25 mm Hg). However, it became excitotoxic<br />
at elevated pressures (50 or 75 mm Hg). Because 30 M<br />
glutamate is usually nontoxic, these results suggest that <strong>in</strong>tr<strong>in</strong>sic<br />
glutamate <strong>in</strong>duces excitotoxicity under hyperbaric conditions.<br />
Glutamate concentration may rise significantly <strong>in</strong> pathologic<br />
conditions such as glaucoma. When glutamate levels are<br />
persistently elevated, Müller cell swell<strong>in</strong>g is an <strong>in</strong>dicator <strong>of</strong><br />
Müller cell function as manifested by glutamate transport. The<br />
present study showed that <strong>in</strong>itial changes <strong>in</strong>duced by excessive<br />
glutamate (300 M or 1.0 mM) at normal pressure consisted <strong>of</strong><br />
reversible Müller cell swell<strong>in</strong>g. Under these conditions, neu-<br />
FIGURE 9. Immun<strong>of</strong>luorescent localization <strong>of</strong> GFAP by confocal microscopy. Nuclei <strong>in</strong> the GCL, INL, and<br />
ONL were countersta<strong>in</strong>ed with DAPI. (a) GFAP expression was restricted to the end feet <strong>of</strong> Müller cells<br />
(arrow) <strong>in</strong> a control ret<strong>in</strong>a (10 mm Hg). (b) The ret<strong>in</strong>a <strong>in</strong>cubated at 25 mm Hg showed positive<br />
fluorescence only <strong>in</strong> the end feet <strong>of</strong> the Müller cells (arrow). (c) A ret<strong>in</strong>a <strong>in</strong>cubated at 50 mm Hg showed<br />
positive fluorescence (arrowheads) throughout the Müller cell body along with the end feet <strong>of</strong> Müller cells<br />
(arrow). (d) At 75 mm Hg, prom<strong>in</strong>ent GFAP expression was observed throughout the Müller cell body<br />
(arrowheads) along with the end feet <strong>of</strong> the Müller cells (arrow). (e) After adm<strong>in</strong>istration <strong>of</strong> 1.0 mM<br />
glutamate, GFAP expression was restricted to the vic<strong>in</strong>ity <strong>of</strong> the Müller cell end feet (arrowheads).<br />
(f) Müller cells expressed prom<strong>in</strong>ent immunolabel<strong>in</strong>g for GFAP throughout the length <strong>of</strong> the cell body<br />
(arrowheads) along with the end feet <strong>of</strong> the Müller cells after a comb<strong>in</strong>ation <strong>of</strong> pressure load<strong>in</strong>g (75 mm<br />
Hg) and 1.0 mM glutamate. Scale bar, 20 m.
6422 Ishikawa et al. IOVS, December 2010, Vol. 51, No. 12<br />
FIGURE 10. GS activity <strong>in</strong> ret<strong>in</strong>al homogenates <strong>in</strong>cubated at various<br />
pressures for 24 hours. There were no statistically significant changes<br />
<strong>in</strong> GS activity at 10 and 25 mm Hg. GS activity was significantly reduced<br />
after exposure to 50 or 75 mm Hg compared with that at 10 mm Hg.<br />
There was also a significant reduction <strong>of</strong> GS activity at 75 mm Hg<br />
compared with that at 50 mm Hg (P 0.014, *P 0.05 by Mann-<br />
Whitney U test). For these studies, we exam<strong>in</strong>ed 10 control and 10<br />
pressure-loaded ret<strong>in</strong>al samples. NS, no significant difference. **P <br />
0.001 by Mann-Whitney U test versus control ret<strong>in</strong>a (<strong>in</strong>cubated at 10<br />
mm Hg).<br />
rons are not damaged; rather, the swell<strong>in</strong>g appears to be a<br />
result <strong>of</strong> protect<strong>in</strong>g neurons from glutamate toxicity. 35 However,<br />
glutamate did not <strong>in</strong>duce typical Müller cell swell<strong>in</strong>g at<br />
higher hydrostatic pressures (50 or 75 mm Hg) <strong>in</strong> the present<br />
study. If Müller cell swell<strong>in</strong>g is an <strong>in</strong>dicator <strong>of</strong> glial function,<br />
higher pressure may suppress the neuroprotective function <strong>of</strong><br />
the Müller cells aga<strong>in</strong>st glutamate and <strong>in</strong>duce glutamate-mediated<br />
excitotoxicity.<br />
Prior studies <strong>in</strong>dicate that Müller cell swell<strong>in</strong>g is associated<br />
with the uptake <strong>of</strong> glutamate and sodium, and the<br />
passive redistribution <strong>of</strong> chloride and water through the<br />
astrocyte-specific transporter GLAST. 5 After be<strong>in</strong>g taken up<br />
by the Müller cells, glutamate is rapidly converted to glutam<strong>in</strong>e<br />
by the enzyme GS. GS activity <strong>in</strong> turn <strong>in</strong>fluences the<br />
rate <strong>of</strong> glutamate uptake by the Müller cells, 36 and the rapid<br />
conversion <strong>of</strong> glutamate to glutam<strong>in</strong>e causes a strong driv<strong>in</strong>g<br />
force for glutamate uptake <strong>in</strong> the Müller cells. Thus, when<br />
GS activity is dim<strong>in</strong>ished, it is likely that glutamate uptake by<br />
the Müller cells will be reduced and typical Müller cell<br />
swell<strong>in</strong>g <strong>in</strong> the presence <strong>of</strong> elevated glutamate will be depressed.<br />
Consistent with this, we observed a significant<br />
decrease <strong>in</strong> GS activity along with <strong>in</strong>hibition <strong>of</strong> typical Müller<br />
cell swell<strong>in</strong>g at higher <strong>in</strong>cubation pressures (50 and 75<br />
mm Hg). Based on these f<strong>in</strong>d<strong>in</strong>gs, we speculate that high<br />
pressure impairs glutamate metabolism primarily by <strong>in</strong>hibit<strong>in</strong>g<br />
GS, thus reduc<strong>in</strong>g glutamate uptake by the Müller glia<br />
and result<strong>in</strong>g <strong>in</strong> glutamate-mediated excitotoxicity. A previous<br />
report demonstrat<strong>in</strong>g a decl<strong>in</strong>e <strong>in</strong> GS immunoreactivity<br />
<strong>in</strong> Müller cells <strong>in</strong> a can<strong>in</strong>e model <strong>of</strong> glaucoma is consistent<br />
with this notion. 11<br />
As has been reported, 37 Müller cell swell<strong>in</strong>g is reversible<br />
if glutamate is converted to glutam<strong>in</strong>e via GS, as the <strong>in</strong>hibition<br />
<strong>of</strong> GS disrupts the reversibility. However, Müller cell<br />
swell<strong>in</strong>g was irreversible <strong>in</strong> hyperbaric conditions. These<br />
results are consistent with the results <strong>of</strong> the GS enzyme<br />
assay, which revealed a significant decrease <strong>in</strong> GS activity at<br />
higher pressures.<br />
In our study, it was difficult to determ<strong>in</strong>e whether <strong>in</strong>hibition<br />
<strong>of</strong> Müller cell swell<strong>in</strong>g <strong>in</strong> hyperbaric conditions was<br />
primarily caused by impairment <strong>of</strong> glutamate uptake or was<br />
secondary to GS <strong>in</strong>hibition. We had observed <strong>in</strong> previous<br />
work that <strong>in</strong>hibition <strong>of</strong> glutamate uptake without add<strong>in</strong>g<br />
exogenous glutamate leads to severe excitotoxic degeneration.<br />
5,37 To exam<strong>in</strong>e these questions histologically, we <strong>in</strong>cubated<br />
ex vivo rat ret<strong>in</strong>al segments that were exposed to<br />
elevated hydrostatic pressure with 1.0 mM glutamate at<br />
normal pressure for short periods. In this protocol, Müller<br />
cell swell<strong>in</strong>g was apparent, <strong>in</strong>dicat<strong>in</strong>g that glial glutamate<br />
uptake is preserved after pressure load<strong>in</strong>g. Based on these<br />
f<strong>in</strong>d<strong>in</strong>gs, we speculate that high pressure impairs glutamate<br />
metabolism but not glutamate uptake.<br />
The present study also demonstrated pressure-dependent<br />
changes <strong>in</strong> GFAP expression <strong>in</strong> Müller cells. GFAP was<br />
expressed by the end feet <strong>of</strong> Müller cells <strong>in</strong> ret<strong>in</strong>as <strong>in</strong>cubated<br />
at lower pressures (10 or 25 mm Hg), whereas GFAP expression<br />
markedly <strong>in</strong>creased after exposure to higher pressures<br />
(50 or 75 mm Hg). These f<strong>in</strong>d<strong>in</strong>gs correlate well with results<br />
from the GS enzyme assay <strong>in</strong> which we observed a significant<br />
decrease <strong>in</strong> GS activity at higher pressures. Although<br />
the precise role <strong>of</strong> GFAP expression <strong>in</strong> the pathogenesis <strong>of</strong><br />
glaucoma is still unclear, 7 GFAP expression suggests that<br />
Müller cell dysfunction <strong>in</strong>duced by pressure elevation <strong>in</strong>fluences<br />
neuron–glia <strong>in</strong>teractions via changes <strong>in</strong> glutamate<br />
metabolism and an imbalance <strong>of</strong> <strong>in</strong>tra- and extracellular<br />
ionic homeostasis.<br />
Acknowledgments<br />
The authors thank Yoko Hayami, Sanae Takaseki, and Yumi Hirata for<br />
technical support on the rat<strong>in</strong>g <strong>of</strong> the morphologic f<strong>in</strong>d<strong>in</strong>gs.<br />
References<br />
1. Lucas DR, Newhouse JP. The toxic effect <strong>of</strong> sodium L-glutamate on<br />
the <strong>in</strong>ner layers <strong>of</strong> the ret<strong>in</strong>a. Arch Ophthalmol. 1957;58:193–201.<br />
2. Olney JW. Glutamate-<strong>in</strong>duced ret<strong>in</strong>al degeneration <strong>in</strong> neonatal<br />
mice: electron microscopy <strong>of</strong> the acutely evolv<strong>in</strong>g lesion. J Neurophathol<br />
Exp Neurol. 1969;28:455–474.<br />
3. Casper DS, Trelstad RL, Reif-Lehrer L. Glutamate-<strong>in</strong>duced cellular<br />
<strong>in</strong>jury <strong>in</strong> isolated chick embryo ret<strong>in</strong>a: Müller cell localization <strong>of</strong><br />
<strong>in</strong>itial effects. J Comp Neurol. 1982;209:79–90.<br />
4. Izumi Y, Kirby CO, Benz AM, Olney JW, Zorumski CF. Swell<strong>in</strong>g <strong>of</strong><br />
Müller cells <strong>in</strong>duced by AP3 and glutamate transport substrates <strong>in</strong><br />
rat ret<strong>in</strong>a. Glia. 1996;17:285–293.<br />
5. Izumi Y, Kirby CO, Benz AM, Olney JW, Zorumski CF. Müller cell<br />
swell<strong>in</strong>g, glutamate uptake and excitotoxic neurodegeneration <strong>in</strong><br />
the isolated rat ret<strong>in</strong>a. Glia. 1999;25:379–389.<br />
6. Gorovits R, Avidan N, Avisar N, Shaked I, Vardimon L. Glutam<strong>in</strong>e<br />
synthetase protects aga<strong>in</strong>st neuronal degeneration <strong>in</strong> <strong>in</strong>jured ret<strong>in</strong>al<br />
tissue. Proc Natl Acad Sci USA. 1997;94:7024–7029.<br />
7. Woldemussie E, Wijono M, Ruiz G. Müller cell response to laser<strong>in</strong>duced<br />
<strong>in</strong>crease <strong>in</strong> <strong>in</strong>traocular pressure <strong>in</strong> rats. Glia. 2004;47:<br />
109–119.<br />
8. Shen F, Chen B, Danias J, et al. Glutamate-<strong>in</strong>duced glutam<strong>in</strong>e<br />
synthetase expression <strong>in</strong> ret<strong>in</strong>al Müller cells after short-term ocular<br />
hypertension <strong>in</strong> the rat. Invest Ophthalmol Vis Sci. 2004;45(9):<br />
3107–3111.<br />
9. Zhang S, Wang H, Lu Q, et al. Detection <strong>of</strong> early neuron degeneration<br />
and accompany<strong>in</strong>g glial responses <strong>in</strong> the visual pathway <strong>in</strong> a<br />
rat model <strong>of</strong> acute <strong>in</strong>traocular hypertension. Bra<strong>in</strong> Res. 2009;<br />
1303:131–143.<br />
10. Moreno MC, Sande P, Marcos HA, et al. Effect <strong>of</strong> glaucoma on the<br />
ret<strong>in</strong>al glutamate/glutam<strong>in</strong>e cycle activity. FASEB J. 2005 19:1161–<br />
1162.<br />
11. Chen C-H, Alyahya K, Gionfriddo JR, Dubielzig RR, Madl JE. Loss <strong>of</strong><br />
glutamate synthetase immunoreactivity from the ret<strong>in</strong>a <strong>in</strong> can<strong>in</strong>e<br />
primary glaucoma. Vet Ophthalmol. 2008;11:150–157.<br />
12. Izumi Y, Benz AM, Kirby CO, et al. An ex vivo rat ret<strong>in</strong>al preparation<br />
for excitotoxicity studies. J Neurosci Methods. 1995;60:219–<br />
225.<br />
13. Ahmed F, Brown KM, Stephan DA, et al. Microarray analysis <strong>of</strong><br />
changes <strong>in</strong> mRNA levels <strong>in</strong> the rat ret<strong>in</strong>a after experimental eleva-
IOVS, December 2010, Vol. 51, No. 12 <strong>Pressure</strong> Elevation and Ret<strong>in</strong>al Excitotoxicity 6423<br />
tion <strong>of</strong> <strong>in</strong>traocular pressure. Invest Ophthalmol Vis Sci. 2004;45:<br />
1247–1258.<br />
14. Br<strong>in</strong>gmann A, Pannicke T, Grosche J, et al. Müller cells <strong>in</strong> the<br />
healthy and diseased ret<strong>in</strong>a. Prog Ret<strong>in</strong> Eye Res. 2006;25:397–424.<br />
15. Br<strong>in</strong>gmann A, Iandiev I, Pannicke T, et al. Cellular signal<strong>in</strong>g and<br />
factors <strong>in</strong>volved <strong>in</strong> Müller cell gliosis: neuroprotective and detrimental<br />
effects. Prog Ret<strong>in</strong> Eye Res. 2009;28:423–451.<br />
16. Kim IB, Kim KY, Joo CK, et al. Reaction <strong>of</strong> Müller cells after<br />
<strong>in</strong>creased <strong>in</strong>traocular pressure <strong>in</strong> the rat ret<strong>in</strong>a. Exp Bra<strong>in</strong> Res.<br />
1998;121:419–424.<br />
17. Hernandez MR, Agapova OA, Yang P, et al. Differential gene expression<br />
<strong>in</strong>astrocytes from human normal and glaucomatous optic nerve<br />
head analyzed by cDNA microarray. Glia. 2002;38:45–64.<br />
18. Wang L, Ci<strong>of</strong>fi GA, Cull G, Dong J, Fortune B. Immunohistologic<br />
evidence for ret<strong>in</strong>al glial cell changes <strong>in</strong> human glaucoma. Invest<br />
Ophthalmol Vis Sci. 2002;43:1088–1094.<br />
19. Lam TT, Kwong JMK, Tso MOM. Early glial responses after acute<br />
elevated <strong>in</strong>traocular pressure <strong>in</strong> rats. Invest Ophthalmol Vis Sci.<br />
2003;44:638–645.<br />
20. Naskar R, Thanos S. Ret<strong>in</strong>al gene pr<strong>of</strong>il<strong>in</strong>g <strong>in</strong> a hereditary rodent<br />
model <strong>of</strong> elevated <strong>in</strong>traocular pressure. Mol Vis. 2006;12:1199–<br />
1210.<br />
21. Steele MR, Inman DM, Calk<strong>in</strong>s DJ, Horner PJ, Vetter ML. Microarray<br />
analysis <strong>of</strong> ret<strong>in</strong>al gene expression <strong>in</strong> the DBA/2J model <strong>of</strong><br />
glaucoma. Invest Ophthalmol Vis Sci. 2006;47:977–985.<br />
22. Schuman JS, Wollste<strong>in</strong> G, Farra T, et al. Comparison <strong>of</strong> optic nerve<br />
head measurements obta<strong>in</strong>ed by optical coherence tomography<br />
and confocal scann<strong>in</strong>g laser ophthalmoscopy. Am J Ophthalmol.<br />
2003;135:504–512.<br />
23. Gawronski JD, Benson DR. Microtiter assay for glutam<strong>in</strong>e synthetase<br />
biosynthetic activity us<strong>in</strong>g <strong>in</strong>organic phosphate detection.<br />
Anal Biochem. 2004;327:114–118.<br />
24. K<strong>in</strong>gdon HS, Hubbard JS, Stadtman ER. Regulation <strong>of</strong> glutam<strong>in</strong>e<br />
synthesis. XI. The nature and implications <strong>of</strong> a lag phase <strong>in</strong> the<br />
Escherichia coli glutam<strong>in</strong>e synthetase reaction. Biochemstry.<br />
1968;7:2136–2142.<br />
25. Izumi Y, Hammerman SB, Kirby CO, et al. Involvement <strong>of</strong> glutamate<br />
<strong>in</strong> ischemic neurodegeneration <strong>in</strong> isolated ret<strong>in</strong>a. Vis Neurosci.<br />
2003;20:97–107.<br />
26. Woolfolk CA, Shapiro B, Stadtman ER. Regulation <strong>of</strong> glutam<strong>in</strong>e<br />
synthetase. 1. Purification and properties <strong>of</strong> glutam<strong>in</strong>e synthetase<br />
from Escherichia coli. Arch Biochem Biophys. 1966;116:177–192.<br />
27. Olney JW, Fuller T, de Gubareff T. Acute dendrotoxic changes <strong>in</strong><br />
the hippocampus <strong>of</strong> ka<strong>in</strong>ate treated rats. Bra<strong>in</strong> Res. 1979;176:91–<br />
100.<br />
28. Sloviter RS, Dempster DW. “Epileptic” bra<strong>in</strong> damage is replicated<br />
qualitatively <strong>in</strong> the rat hippocampus by central <strong>in</strong>jection <strong>of</strong> glutamate<br />
or aspartate but not by GABA or acetylchol<strong>in</strong>e. Bra<strong>in</strong> Res<br />
Bull. 1985;15:39–60.<br />
29. Dessi F, Charriaut-Marlangue C, Ben-Ari Y. Glutamate-<strong>in</strong>duced neuronal<br />
death <strong>in</strong> cerebellar culture is mediated by two dist<strong>in</strong>ct<br />
components: a sodium-chloride component and a calcium component.<br />
Bra<strong>in</strong> Res. 1994;650:49–55.<br />
30. Peterson C, Neal JH, Cotman CW. Development <strong>of</strong> N-methyl-Daspartate<br />
excitotoxicity <strong>in</strong> cultured hippocampal neurons. Bra<strong>in</strong><br />
Res Dev Bra<strong>in</strong> Res. 1989;48:187–195.<br />
31. Friedman JE, Haddad GG. Major Differences <strong>in</strong> Ca 2 i response to<br />
anoxia between neonatal and adult rat CA1 neurons: role <strong>of</strong> Ca 2 0<br />
and Na 0. J Neurosci. 1993;13:63–72.<br />
32. Rothman SM. The neurotoxicity <strong>of</strong> excitatory am<strong>in</strong>o acids is produced<br />
by passive chloride <strong>in</strong>flux. J Neurosci. 1985;5:1483–1489.<br />
33. Krisnamoorthy RR, Agarwal P, Prasanna G, et al. Characterization<br />
<strong>of</strong> a transformed rat ret<strong>in</strong>al ganglion cell l<strong>in</strong>e. Mol Bra<strong>in</strong> Res.<br />
2001;86:1–12.<br />
34. Clements JD, Lester RA, Tong G, Jahr CE, Westbrook GL. The time<br />
corse <strong>of</strong> glutamate <strong>in</strong> the synaptic cleft. Science. 1992;258:1498–<br />
1501.<br />
35. Rosenberg PA, Am<strong>in</strong> S, Letner M. Glutamate uptake disguises<br />
neurotoxic potency <strong>of</strong> glutamate agonists <strong>in</strong> cerebral cortex <strong>in</strong><br />
dissociated cell culture. J Neurosci. 1992;12:56–61.<br />
36. T Rauen, Taylor WR, Kuhlbrodt K, Wiessner M, High-aff<strong>in</strong>ity<br />
glutamate transporters <strong>in</strong> the rat ret<strong>in</strong>a: a major role <strong>of</strong> the glial<br />
glutamate transporter GLAST-1 <strong>in</strong> transmitter clearance. Cell Tissue<br />
Res. 1998;291:19–31.<br />
37. Izumi Y, Matsukawa M, Benz AM, et al. Role <strong>of</strong> ammonia <strong>in</strong> reversal<br />
<strong>of</strong> glutamate-mediated Müller cell swell<strong>in</strong>g <strong>in</strong> the rat ret<strong>in</strong>a. Glia.<br />
2004;48:44–50.