Echelle Spectrographs – a flexible tool for Spectroscopy: - L.O.T.-Oriel
Echelle Spectrographs – a flexible tool for Spectroscopy: - L.O.T.-Oriel
Echelle Spectrographs – a flexible tool for Spectroscopy: - L.O.T.-Oriel

Create successful ePaper yourself
Turn your PDF publications into a flip-book with our unique Google optimized e-Paper software.
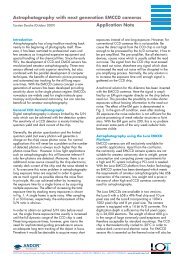
<strong>Echelle</strong> <strong>Spectrographs</strong> <strong>–</strong> a <strong>flexible</strong> <strong>tool</strong> <strong>for</strong> <strong>Spectroscopy</strong>:<br />
Raman and LIBS <strong>Spectroscopy</strong> Mayank Tripathi, Andor Technology<br />
Introduction<br />
An <strong>Echelle</strong> spectrograph spreads out the spectral components<br />
in both X and Y directions (echelle in French<br />
means a ladder, hence the connotation being that<br />
the spectrum is spread over a vertical and horizontal<br />
axis) to better fill a 2-D detector (like a CCD camera).<br />
<strong>Echelle</strong> spectrographs are very similar to Czerny Turner<br />
spectrographs except that they have two dispersive<br />
elements, these are typically a grating and a prism or<br />
until more recently, dual-order prism and a grating.<br />
The two dispersive elements disperse the light at 90° to<br />
one another. The result is that the dispersed light on the<br />
CCD provides spectral in<strong>for</strong>mation on both, the X and<br />
Y directions. This gives high spectral bandpass as obtained<br />
from a low dispersion Czerny Turner while simultaneously<br />
providing the resolution of a high dispersion<br />
Czerny Turner. In most <strong>Echelle</strong> systems there are no<br />
moving parts, there<strong>for</strong>e analysis is fast, and calibration<br />
is very convenient and reliable.<br />
Optical Layout<br />
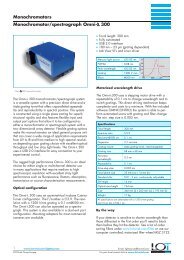
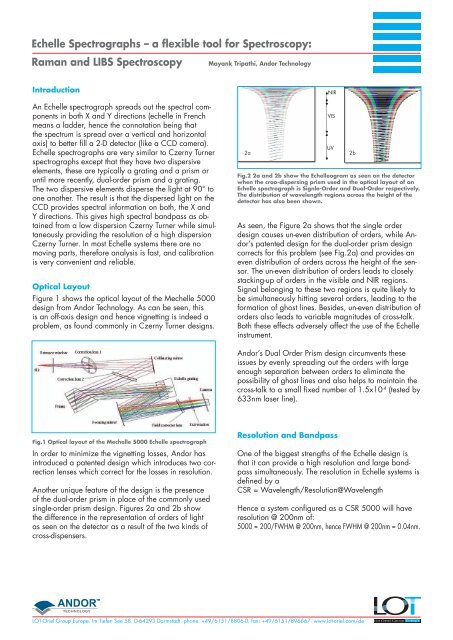
Figure 1 shows the optical layout of the Mechelle 5000<br />
design from Andor Technology. As can be seen, this<br />
is an off-axis design and hence vignetting is indeed a<br />
problem, as found commonly in Czerny Turner designs.<br />
Fig.1 Optical layout of the Mechelle 5000 <strong>Echelle</strong> spectrograph<br />
In order to minimize the vignetting losses, Andor has<br />
introduced a patented design which introduces two correction<br />
lenses which correct <strong>for</strong> the losses in resolution.<br />
Another unique feature of the design is the presence<br />
of the dual-order prism in place of the commonly used<br />
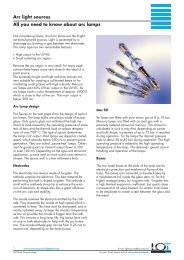
single-order prism design. Figures 2a and 2b show<br />
the difference in the representation of orders of light<br />
as seen on the detector as a result of the two kinds of<br />
cross-dispensers.<br />
UV<br />
2a 2b<br />
Fig.2 2a and 2b show the <strong>Echelle</strong>ogram as seen on the detector<br />
when the croo-dispersing prism used in the optical layout of an<br />
<strong>Echelle</strong> spectrograph is Signle-Order and Dual-Order respectively.<br />
The distribution of wavelength regions across the height of the<br />
detector has also been shown.<br />
As seen, the Figure 2a shows that the single order<br />
design causes un-even distribution of orders, while Andor’s<br />
patented design <strong>for</strong> the dual-order prism design<br />
corrects <strong>for</strong> this problem (see Fig.2a) and provides an<br />
even distribution of orders across the height of the sensor.<br />
The un-even distribution of orders leads to closely<br />
stacking-up of orders in the visible and NIR regions.<br />
Signal belonging to these two regions is quite likely to<br />
be simultaneously hitting several orders, leading to the<br />
<strong>for</strong>mation of ghost lines. Besides, un-even distribution of<br />
orders also leads to variable magnitudes of cross-talk.<br />
Both these effects adversely affect the use of the <strong>Echelle</strong><br />
instrument.<br />
Andor’s Dual Order Prism design circumvents these<br />
issues by evenly spreading out the orders with large<br />
enough separation between orders to eliminate the<br />
possibility of ghost lines and also helps to maintain the<br />
cross-talk to a small fixed number of 1.5x10 -4 (tested by<br />
633nm laser line).<br />
Resolution and Bandpass<br />
One of the biggest strengths of the <strong>Echelle</strong> design is<br />
that it can provide a high resolution and large bandpass<br />
simultaneously. The resolution in <strong>Echelle</strong> systems is<br />
defined by a<br />
CSR = Wavelength/Resolution@Wavelength<br />
Hence a system configured as a CSR 5000 will have<br />
resolution @ 200nm of:<br />
5000 = 200/FWHM @ 200nm, hence FWHM @ 200nm = 0.04nm.<br />
LOT-<strong>Oriel</strong> Group Europe. Im Tiefen See 58. D-64293 Darmstadt. phone: +49/6151/8806-0. fax: +49/6151/896667. www.lot-oriel.com/de<br />
NIR<br />
VIS
<strong>Echelle</strong> <strong>Spectrographs</strong> <strong>–</strong> a <strong>flexible</strong> <strong>tool</strong> <strong>for</strong> <strong>Spectroscopy</strong>:<br />
Raman and LIBS <strong>Spectroscopy</strong> Mayank Tripathi, Andor Technology<br />
The bandpass provided by <strong>Echelle</strong> systems is mainly<br />
dependant on the size of the <strong>Echelle</strong> grating and also<br />
the camera onto which the <strong>Echelle</strong> lines are foussed.<br />
Typically, the maximum band-width that these systems<br />
give ranges from 200nm to 950nm in a single shot.<br />
Depending on the design, there are other <strong>Echelle</strong><br />
designs that provided a smaller coverage, i.e., from<br />
522 to 1076nm (Compact <strong>Echelle</strong> from Andor Technology<br />
designed <strong>for</strong> Raman spectroscopy) or from 200nm<br />
to 600nm etc. The CSRs too are available in different<br />
configurations depending on the model used, and it<br />
can vary from 2500 (low resolution) to 40000 (very<br />
high resolution).<br />
Ruggedness<br />
<strong>Echelle</strong> systems can be made very compact and are<br />
typically designed without any moving parts and that<br />
makes them very suitable <strong>for</strong> field based applications.<br />
These systems are known to have been deployed online<br />
processes to identify alloy concentrations in metal<br />
furnace hearths and have also been used in flight to<br />
capture trace element in<strong>for</strong>mation of exhaust gas from<br />
jet engines.<br />
Application<br />
<strong>Echelle</strong> systems have been in use <strong>for</strong> many years <strong>for</strong><br />
research based spectroscopy, however, they have not<br />
been used as widely as the Czerny Turner systems.<br />
The main reason <strong>for</strong> this is that the earlier models had<br />
a very low throughput, of f/10 <strong>–</strong> f/12. However, with<br />
changes in <strong>Echelle</strong> designs, f/6 and lower are also<br />
now available. Given their ability to capture large<br />
bandpass spectral coverage of ~750nm and simultaneously<br />
provide high resolution of 0.04nm (at 200nm),<br />
these systems can prove to be extremely handy and<br />
<strong>flexible</strong> <strong>tool</strong>s <strong>for</strong> varied types of spectroscopy research<br />
in laboratories.<br />
<strong>Echelle</strong> systems first found their use in Laser Induced<br />
Breakdown <strong>Spectroscopy</strong> (LIBS) applications where the<br />
<strong>for</strong>mation of plasma is captured by the spectrograph<br />
and sent typically to an ICCD and the combination<br />
works well to provide elemental data of the plasma.<br />
The wide spectral coverage provides strong advantage<br />
to the LIBS researcher as elements needed to be identified<br />
in the target sample can belong to any part of the<br />
spectrum. The strong intensity of plasmas is enough <strong>for</strong><br />
even low throughput <strong>Echelle</strong>s like those having an f/12<br />
to successfully detect the elemental constituents of the<br />
sample.<br />
The newer <strong>Echelle</strong> designs now available in the market<br />
provide 40-60% improvement in throughput over previously<br />
available designs hence opening the doors <strong>for</strong><br />
use of <strong>Echelle</strong>s in a variety of applications other than<br />
LIBS, like Raman spectroscopy and Fluorescence.<br />
Typical Applications of the <strong>Echelle</strong> have been discussed<br />
here below:<br />
n (a) Raman <strong>Spectroscopy</strong>: NIR Raman<br />
n (b) LIBS<br />
a) Raman <strong>Spectroscopy</strong>:<br />
NIR using the <strong>Echelle</strong> Spectrograph<br />
Raman experiments were conducted at the Children’s<br />
Hospital in Los Angeles with Dr. James Lambert using<br />
the 532nm and 785nm lines. The spectrograph used in<br />
this case is one of Andor’s newest <strong>Echelle</strong> designs<br />
called the Compact <strong>Echelle</strong> VIS-NIR. It is an f/6<br />
instrument with a CSR of 7000, and it has a detection<br />
range from 520 to 1076nm. The setup used <strong>for</strong> the two<br />
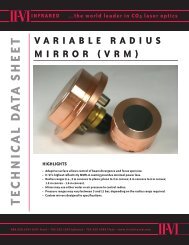
laser lines is as shown in Fig. 3. For the 785nm setup,<br />
we used a Verdi diode pumped Ti-Sapphire <strong>for</strong> excitation.<br />
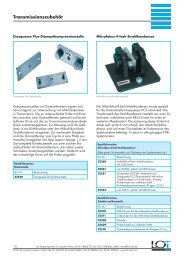
Figure 4 shows a zoomed-in section of the spectra<br />
obtained with 785nm excitation. The spectra was<br />
collected with a 5 second exposure and fed into the<br />
spectrograph through a 100µm VIS-NIR fiber and into<br />
a TE cooled CCD detector from Andor Technology<br />
called iDus DV420A-OE, cooled to -60 °C and operating<br />
at 33kHz readout rates.<br />
Figure 3: A schematic of the setup used <strong>for</strong> the NIR Raman<br />
experiments conducted using the Compact <strong>Echelle</strong> design from<br />
ndor Technology<br />
LOT-<strong>Oriel</strong> Group Europe. Im Tiefen See 58. D-64293 Darmstadt. phone: +49/6151/8806-0. fax: +49/6151/896667. www.lot-oriel.com/de
<strong>Echelle</strong> <strong>Spectrographs</strong> <strong>–</strong> a <strong>flexible</strong> <strong>tool</strong> <strong>for</strong> <strong>Spectroscopy</strong>:<br />
Raman and LIBS <strong>Spectroscopy</strong> Mayank Tripathi, Andor Technology<br />
Intensity (Counts bg Corr)<br />
60000<br />
40000<br />
20000<br />
0<br />
Cyclohexane bands<br />
830 880 930 980 1030<br />
Wavelength (nm)<br />
Series1<br />
Figure 4: Zoom-in shot of the spectral window showing<br />
Cyclohexane bands as seen by the Compact <strong>Echelle</strong><br />
As seen from the spectra, the cyclohexane bands in the<br />
837-885nm range and the 992- 1020nm group are all<br />
clearly visible.<br />
b) Micro - Laser Induced Breakdown <strong>Spectroscopy</strong>:<br />
UV-VIS-NIR <strong>Spectroscopy</strong> µLIBS experiments were conducted<br />
in collaboration with Dr. Robert Fedosejevs from<br />
University of Alberta and his team. The per<strong>for</strong>mance of<br />
the <strong>Echelle</strong> spectrometer was used to compare it with a<br />
1/3 m focal length Czerny Turner Spectrograph <strong>for</strong> 2D<br />
mapping of surfaces via the µLIBS technique. Simultaneous<br />
observation of the µLIBS plasma the two systems<br />
was conducted and the sensitivity of the two systems<br />
was compared.<br />
The experimental setup is given in Fig. 5. The µLIBS<br />
plasma is observed at 45 degrees from the laser axis<br />
<strong>for</strong> both a f/3.9 Czerny Turner spectrometer (<strong>Oriel</strong><br />
MS260i) and an f/7 <strong>Echelle</strong> spectrometer (Andor<br />
Mechelle 5000). A Ti:Sapphire laser (Spectra Physics<br />
Hurricane) produced 800 nm, 120 fs pulses with a<br />
maximum pulse energy of ~80 µJ on target. The laser<br />
is focused using a 15X Schwarzschild objective. An<br />
50 µm diameter optical fiber (Ocean Optics Q50-2-<br />
UV/VIS) is used to couple the plasma emission into the<br />
<strong>Echelle</strong> spectrometer and define the entrance aperture<br />
of the <strong>Echelle</strong>.<br />
Figure 5: A schematic view of experimental setup. The plasma is<br />
observed simultaneously by both spectrometers at an angle of<br />
45 degrees from the incident laser beam.<br />
The <strong>Echelle</strong> was coupled with a ICCD (Andor iStar<br />
DH734-18U-13) with an enhanced response from<br />
500 nm to 800 nm, while the Czerny Turner was<br />
coupled with a ICCD (Andor iStar DH720-25F-03) with<br />
an enhanced response from 200 nm to 500 nm. The<br />
gate delays used ranged from 2 to 5 ns, gate width<br />
was 1 µs and both ICCDs were operated at -10 °C.<br />
The ICCD on the Czerny Turner spectrometer was used<br />
in full vertical binning mode with a pixel readout time<br />
of 16 µs, while the ICCD on the <strong>Echelle</strong> was operated<br />
in imaging mode with a pixel readout time of 1 µs.<br />
One of the key advantages of an <strong>Echelle</strong> spectrometer<br />
is the extremely broadband spectrum that may<br />
be acquired. A sample spectra from a 29 µJ shot on<br />
a sample of Al2024 alloy is presented in Fig. 6. The<br />
spectral width presented is limited by the achromatic<br />
imaging lenses used to image the plasma light onto the<br />
optical fiber.<br />
The insets are regions which are relevant to the detection<br />
and identification of precipitates in aluminum<br />
alloys [8,9]. Using the Czerny Turner spectrometer only<br />
two unresolved doublets are visible [8,9]. Following the<br />
procedure outlined in [9], the spectra were analyzed<br />
<strong>for</strong> Mg and Mn SNR. Fig. 7a gives the results of the<br />
analysis of the Czerny Turner observations using the<br />
current setup <strong>for</strong> 4 µJ pulses on Al2024 alloy. The same<br />
analysis was per<strong>for</strong>med using the spectra observed by<br />
the Mechelle <strong>for</strong> the same 4 µJ shots, but using all of<br />
the lines identified in the insets of Fig. 4. The results of<br />
this analysis is presented in Fig. 7b.<br />
LOT-<strong>Oriel</strong> Group Europe. Im Tiefen See 58. D-64293 Darmstadt. phone: +49/6151/8806-0. fax: +49/6151/896667. www.lot-oriel.com/de
<strong>Echelle</strong> <strong>Spectrographs</strong> <strong>–</strong> a <strong>flexible</strong> <strong>tool</strong> <strong>for</strong> <strong>Spectroscopy</strong>:<br />
Raman and LIBS <strong>Spectroscopy</strong> Mayank Tripathi, Andor Technology<br />
Figure 6: Mechelle spectra from Al2024 alloy, using a single<br />
29 µJ, 800 nm pulse. Current spectral width is limited by use<br />
of achromatic imaging lenses. Insets are regions relevant to<br />
detection and identification of precipitates [8,9].<br />
The use of the multiple lines available with the Mechelle<br />
improves the detection of Mn precipitates. Combined<br />
with the detection of Mg precipitates, this result indicates<br />
that single shot 2D mapping of Al2024 surfaces<br />
would be possible at 4 µJ. Many more lines are available<br />
<strong>for</strong> simultaneous analysis with high resolution as a<br />
result of the high bandpass and high resolution provided<br />
by the <strong>Echelle</strong> design vs. the Czerny Turner design.<br />
Figure 7: Correlation plot of Mg and Mn SNR from 4 µJ shots on<br />
Al2024 alloy <strong>for</strong> (a) Czerny Turner spectrometer (2 Lines) and (b)<br />
Mechelle spectrometer (12 Lines).<br />
Future of <strong>Echelle</strong>s<br />
As has been shown from the variety applications of the<br />
<strong>Echelle</strong> design, it can be confidently said that these systems<br />
can be successfully used to per<strong>for</strong>m varied types<br />
of spectroscopy techniques in laboratories. However,<br />
<strong>for</strong> these systems to become popularly accepted solutions<br />
they will need to be redesigned on several fronts:-<br />
n The throughput of <strong>Echelle</strong> systems need to be<br />
improved to make them comparable to that available<br />
from a typical 1/3 m CZ design (The SR303i<br />
from Andor Technology has an f/4). Low throughput<br />
makes the use of <strong>Echelle</strong> systems <strong>for</strong> Raman applications,<br />
restrictive.<br />
n <strong>Echelle</strong> systems must be designed to address the<br />
application in a more specific manner, i.e., systems<br />
specifically designed <strong>for</strong> known Raman excitation<br />
laser lines, i.e., a UV-VIS system with range from<br />
244nm to 480nm, and a VIS <strong>–</strong> NIR system with a<br />
range of 480 to 1076nm. These designs will enable<br />
the instrument to deliver the entire wavelength range<br />
in the lower orders instead of going into orders<br />
above 50 and consequently maintaining high SNR<br />
<strong>for</strong> the instrument.<br />
n Detectors used at the back of <strong>Echelle</strong> systems are<br />
typically Intensified CCDs so as to facilitate LIBS<br />
research. However, LIBS plasmas have a typical<br />
lifetime of 1- 100 µs, and the time resolution of<br />
nano-seconds that ICCDs provide is overkill. Faster<br />
and cheaper detectors with larger time resolutions<br />
such as CMOS or Interline CCDs should be used<br />
instead. This will bring down the system cost by half<br />
and make <strong>Echelle</strong> systems a potent choice versus<br />
other spectroscopy instrumentation solutions.<br />
LOT-<strong>Oriel</strong> Group Europe. Im Tiefen See 58. D-64293 Darmstadt. phone: +49/6151/8806-0. fax: +49/6151/896667. www.lot-oriel.com/de