Page 1 of 3 UNDERSTANDING SURVEY DIAGRAMS ... - Durban
Page 1 of 3 UNDERSTANDING SURVEY DIAGRAMS ... - Durban
Page 1 of 3 UNDERSTANDING SURVEY DIAGRAMS ... - Durban

You also want an ePaper? Increase the reach of your titles
YUMPU automatically turns print PDFs into web optimized ePapers that Google loves.
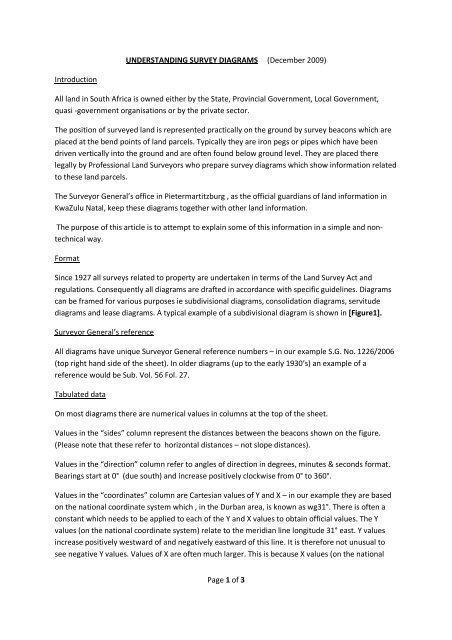
Introduction<br />
<strong>UNDERSTANDING</strong> <strong>SURVEY</strong> <strong>DIAGRAMS</strong> (December 2009)<br />
All land in South Africa is owned either by the State, Provincial Government, Local Government,<br />
quasi ‐government organisations or by the private sector.<br />
The position <strong>of</strong> surveyed land is represented practically on the ground by survey beacons which are<br />
placed at the bend points <strong>of</strong> land parcels. Typically they are iron pegs or pipes which have been<br />
driven vertically into the ground and are <strong>of</strong>ten found below ground level. They are placed there<br />
legally by Pr<strong>of</strong>essional Land Surveyors who prepare survey diagrams which show information related<br />
to these land parcels.<br />
The Surveyor General’s <strong>of</strong>fice in Pietermartitzburg , as the <strong>of</strong>ficial guardians <strong>of</strong> land information in<br />
KwaZulu Natal, keep these diagrams together with other land information.<br />
The purpose <strong>of</strong> this article is to attempt to explain some <strong>of</strong> this information in a simple and non‐<br />
technical way.<br />
Format<br />
Since 1927 all surveys related to property are undertaken in terms <strong>of</strong> the Land Survey Act and<br />
regulations. Consequently all diagrams are drafted in accordance with specific guidelines. Diagrams<br />
can be framed for various purposes ie subdivisional diagrams, consolidation diagrams, servitude<br />
diagrams and lease diagrams. A typical example <strong>of</strong> a subdivisional diagram is shown in [Figure1].<br />
Surveyor General’s reference<br />
All diagrams have unique Surveyor General reference numbers – in our example S.G. No. 1226/2006<br />
(top right hand side <strong>of</strong> the sheet). In older diagrams (up to the early 1930’s) an example <strong>of</strong> a<br />
reference would be Sub. Vol. 56 Fol. 27.<br />
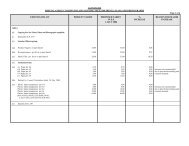
Tabulated data<br />
On most diagrams there are numerical values in columns at the top <strong>of</strong> the sheet.<br />
Values in the “sides” column represent the distances between the beacons shown on the figure.<br />
(Please note that these refer to horizontal distances – not slope distances).<br />
Values in the “direction” column refer to angles <strong>of</strong> direction in degrees, minutes & seconds format.<br />
Bearings start at 0° (due south) and increase positively clockwise from 0° to 360°.<br />
Values in the “coordinates” column are Cartesian values <strong>of</strong> Y and X – in our example they are based<br />
on the national coordinate system which , in the <strong>Durban</strong> area, is known as wg31°. There is <strong>of</strong>ten a<br />
constant which needs to be applied to each <strong>of</strong> the Y and X values to obtain <strong>of</strong>ficial values. The Y<br />
values (on the national coordinate system) relate to the meridian line longitude 31° east. Y values<br />
increase positively westward <strong>of</strong> and negatively eastward <strong>of</strong> this line. It is therefore not unusual to<br />
see negative Y values. Values <strong>of</strong> X are <strong>of</strong>ten much larger. This is because X values (on the national<br />
<strong>Page</strong> 1 <strong>of</strong> 3
coordinate system) are measured from the equator and increase positively southward from this line<br />
and are therefore always positive.<br />
Please note that if a local coordinate system has been used then the comments above are not<br />
relevant.<br />
Sometimes there are only a few or no coordinates listed and bearings may be replaced by the<br />
internal angles <strong>of</strong> the figure.<br />
Units <strong>of</strong> measure<br />
The first surveys in the <strong>Durban</strong> area were undertaken in the 1840’s and the units <strong>of</strong> distance and<br />
area have changed over the years. The earliest diagrams show distances measured in Chains & Links<br />
with the corresponding areas given in Acres, Roods & Perches. From the late 1920’s distances were<br />
measured in English Feet with areas given in Acres & Square Feet. Finally, with metrication in the<br />
late 1960’s, distances are now measured in metres and corresponding areas in Hectares & Square<br />
Metres.<br />
Coordinate systems<br />
Initially there was no National Coordinate system so surveys were based on local systems. In the<br />
<strong>Durban</strong> area the National Coordinate System was known as lo31° but this changed to wg31° in<br />
January 1999. Please note that the values <strong>of</strong> the two systems differ by a large amount. The<br />
coordinate system used for the survey is noted above the coordinate values and can be either<br />
“local”, lo31°,lo31° approx, wg31° or wg31° approx.<br />
Servitudes<br />
Some diagrams indicate and describe either existing or new servitudes<br />
Servitudes confer rights <strong>of</strong> individuals or other properties over the property in question. In our<br />
example, there are two servitude notes. Firstly , a Sewer & Drain Servitude and secondly a Drainage<br />
Servitude. Both these servitudes are intended to protect council sewers and drains.<br />
Other types <strong>of</strong> servitudes (not shown on our diagram) would cover other features including water<br />
pipelines, electric powerlines and underground cables, rights <strong>of</strong> way (roads) etc<br />
The figure<br />
The figure on the diagram represents the boundaries <strong>of</strong> the property and is lettered (see the figure<br />
and the description below it). In our example, all boundaries consist <strong>of</strong> straight lines but sometimes<br />
rivers and coastal reserves define boundaries by irregular lines which can sometimes move in<br />
accordance with the provision <strong>of</strong> various laws.<br />
Beacon information<br />
In all but the earliest <strong>of</strong> diagrams, beacons that have been placed are represented by small circles –<br />
in our example at A,B,C,D,E,F & G. The description <strong>of</strong> these beacons in our example is given just<br />
below the figure.<br />
<strong>Page</strong> 2 <strong>of</strong> 3
Scale & Area<br />
The scale factor for the figure invariably appears just below it – in our example 1:2000. This scale<br />
means that 1centimetre on the figure represents 20 metres on the ground.<br />
Description and Area <strong>of</strong> the Property<br />
The area defined by the lettered figure appears below the scale and just above the cadastral<br />
description <strong>of</strong> the property (usually underlined) ‐ in our example PORTION 105 (OF 80) OF ERF 1<br />
RIVERHORSE VALLEY .<br />
Officially approved diagrams<br />
An <strong>of</strong>ficial survey diagram has been signed by the Pr<strong>of</strong>essional Land Surveyor who undertook the<br />
survey (near the bottom <strong>of</strong> the sheet). It is approved by a designated representative <strong>of</strong> the Surveyor<br />
General (top right hand corner). If these two signatures do not appear, then the diagram is not a<br />
legal document and cannot be used for land registration. Please note that the fact that a diagram is<br />
approved does not necessarily mean that the property is registered in a title deed. If it exists, the<br />
title deed reference number should appear in the box at the bottom left hand side <strong>of</strong> the sheet.<br />
<strong>Page</strong> 3 <strong>of</strong> 3
![INK Environmental Sustainability Booklet [19 MB] - Durban](https://img.yumpu.com/22025104/1/190x136/ink-environmental-sustainability-booklet-19-mb-durban.jpg?quality=85)