Page 1 of 3 UNDERSTANDING SURVEY DIAGRAMS ... - Durban
Page 1 of 3 UNDERSTANDING SURVEY DIAGRAMS ... - Durban
Page 1 of 3 UNDERSTANDING SURVEY DIAGRAMS ... - Durban

You also want an ePaper? Increase the reach of your titles
YUMPU automatically turns print PDFs into web optimized ePapers that Google loves.
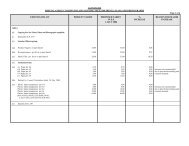
Scale & Area<br />
The scale factor for the figure invariably appears just below it – in our example 1:2000. This scale<br />
means that 1centimetre on the figure represents 20 metres on the ground.<br />
Description and Area <strong>of</strong> the Property<br />
The area defined by the lettered figure appears below the scale and just above the cadastral<br />
description <strong>of</strong> the property (usually underlined) ‐ in our example PORTION 105 (OF 80) OF ERF 1<br />
RIVERHORSE VALLEY .<br />
Officially approved diagrams<br />
An <strong>of</strong>ficial survey diagram has been signed by the Pr<strong>of</strong>essional Land Surveyor who undertook the<br />
survey (near the bottom <strong>of</strong> the sheet). It is approved by a designated representative <strong>of</strong> the Surveyor<br />
General (top right hand corner). If these two signatures do not appear, then the diagram is not a<br />
legal document and cannot be used for land registration. Please note that the fact that a diagram is<br />
approved does not necessarily mean that the property is registered in a title deed. If it exists, the<br />
title deed reference number should appear in the box at the bottom left hand side <strong>of</strong> the sheet.<br />
<strong>Page</strong> 3 <strong>of</strong> 3
![INK Environmental Sustainability Booklet [19 MB] - Durban](https://img.yumpu.com/22025104/1/190x136/ink-environmental-sustainability-booklet-19-mb-durban.jpg?quality=85)