Bacterial indicators of faecal pollution and physiochemical ... - RMZ
Bacterial indicators of faecal pollution and physiochemical ... - RMZ
Bacterial indicators of faecal pollution and physiochemical ... - RMZ

You also want an ePaper? Increase the reach of your titles
YUMPU automatically turns print PDFs into web optimized ePapers that Google loves.
<strong>RMZ</strong> – Materials <strong>and</strong> Geoenvironment, Vol. 58, No. 2, pp. 129–142, 2011<br />
<strong>Bacterial</strong> <strong>indicators</strong> <strong>of</strong> <strong>faecal</strong> <strong>pollution</strong> <strong>and</strong> <strong>physiochemical</strong><br />
assessment <strong>of</strong> tributaries <strong>of</strong> Ganges River in Garhwal<br />
Himalayas, India<br />
Bakterijski indikatorji fekalnega onesnaženja in<br />
fiziološko-kemijska ocena pritokov reke Ganges v Garhwalski<br />
Himalaji v Indiji<br />
ArcHna Sati 1 , AncHal Sood 1 , SHiveSH SHarMa 2, * , S<strong>and</strong>eeP BiSHT 1 ,<br />
VivEk KUMar 3<br />
1 Department <strong>of</strong> Microbiology, SBS Post Graduate Institute <strong>of</strong> Bio-Medical Sciences<br />
<strong>and</strong> Research Balawala, Dehradun, Uttarakh<strong>and</strong>, India<br />
2 Department <strong>of</strong> Applied Mechanics (Biotechnology), Motilal Nehru National Institute<br />
<strong>of</strong> Technology, Allahabad, Uttar Pradesh, India<br />
3 Microbiology Section, Department <strong>of</strong> Soil <strong>and</strong> Water Research, Public Authority <strong>of</strong><br />
Agricultural Affairs & Fish Resources, PO Box 21422, Safat-13075, Kuwait<br />
Original scientific paper<br />
*Corresponding author. E-mail: dr.shiveshsharma@gmail.com<br />
Received: February 22, 2011 Accepted: March 27, 2011<br />
Abstract: A study was undertaken to investigate the water quality <strong>of</strong><br />
Alakn<strong>and</strong>a <strong>and</strong> Bhagirathi rivers (tributaries <strong>of</strong> River Ganges) in<br />
Garhwal Himalayan region during the periods <strong>of</strong> monsoon, summer<br />
<strong>and</strong> winter seasons. Both the rivers are sacred <strong>and</strong> are important<br />
source <strong>of</strong> water for drinking <strong>and</strong> irrigation. Water samples<br />
were analyzed for various bacteriological parameters including total<br />
viable count (TVC), total coliform (TC), <strong>faecal</strong> coliform (FC)<br />
<strong>and</strong> <strong>faecal</strong> streptococci (FS). Also, physicochemical attributes viz.<br />
dissolved oxygen (DO), biological oxygen dem<strong>and</strong> (BOD) <strong>and</strong><br />
chemical oxygen dem<strong>and</strong> (COD) was assessed. Total viable count<br />
exceeded the maximum permissible limits in all the samples irrespective<br />
to different seasons. The high most probable number<br />
(MPN) values <strong>and</strong> presence <strong>of</strong> <strong>faecal</strong> coliforms <strong>and</strong> streptococci<br />
in the water samples suggests the potential presence <strong>of</strong> pathogenic<br />
microorganisms which might cause water borne diseases. A direct<br />
effect <strong>of</strong> season <strong>and</strong> human activities on the <strong>pollution</strong> status was<br />
129
130 SaTi, a., Sood, a., SHarMa, S., BiSHT, S., kUMar, v.<br />
introduction<br />
observed at all the water sampling sites. The over all objective <strong>of</strong><br />
this work was to investigate the incidence <strong>of</strong> these indicator organisms,<br />
coliform, <strong>faecal</strong> coliform, <strong>faecal</strong> streptococci <strong>and</strong> <strong>physiochemical</strong><br />
parameters during different seasons in two main tributaries<br />
<strong>of</strong> Ganges River.<br />
Izvleček: Namen študije je bil raziskati kakovost vode rek Alakn<strong>and</strong>a in<br />
Bhagirathi (pritokov Gangesa) na območju Garhwalske Himalaje<br />
v monsunskem, poletnem in zimskem obdobju. Obe reki veljata<br />
za sveti in sta hkrati pomemben vir pitne in namakalne vode. V<br />
vzorcih vode so določali različne bakteriološke parametre, kot tudi<br />
celotno število za življenje sposobnih organizmov (TVC), celotne<br />
koliformne organizme (TC), fekalne koliformne organizme (FC)<br />
in fekalne streptokoke (FS). Določali so tudi fiziološko-kemijske<br />
lastnosti, kot so raztopljeni kisik (DO), biološka potreba po kisiku<br />
(BOD) in kemijska potreba po kisiku (COD). Celotno število<br />
za življenje sposobnih organizmov presega najvišje dopustne<br />
meje v vseh vzorcih, ne glede na čas vzorčenja. Visoke vrednosti<br />
najverjetnejšega števila (MPN) in navzočnost fekalnih koliformov<br />
ter streptokokov v vzorcih nakazuje možno navzočnost patogenih<br />
mikroorganizmov, ki utegnejo povzročati obolenja, ki se širijo z<br />
vodo. Na vseh vzorčnih mestih je mogoče opazovati vpliv letnega<br />
odobja in človekovih dejavnosti na stanje onesnaženosti. Poglavitni<br />
namen dela je bil raziskati pogostnost indikatorskih organizmov,<br />
koliformov, fekalnih koliformov, fekalnih streptokokov in<br />
fiziološko-kemijskih parametrov v različnih obdobjih leta v dveh<br />
glavnih pritokih reke Ganges.<br />
Key words:, coliforms, bacteriological, physicochemical, Ganges, river<br />
Ključne besede: koliformi, bakteriološki, fiziološko-kemijski, reka Ganges<br />
The Ganges or Ganga rises in the<br />
Northern Himalayas on the Indian side<br />
<strong>of</strong> the Tibet border. Its five headstreams<br />
i.e. the Bhagirathi, Alakn<strong>and</strong>a, M<strong>and</strong>akini,<br />
Dhauliganga <strong>and</strong> Pindar rise in<br />
Uttarakh<strong>and</strong> region. Of these, the two<br />
main headstreams are the Alakn<strong>and</strong>a<br />
(Latitude: 30°7’60’’ N, Longitude:<br />
78°35’60’’ E) about 4 402 meter above<br />
sea level (the longer <strong>of</strong> the two), which<br />
rises about 30 miles north <strong>of</strong> the Himalayan<br />
Peak <strong>of</strong> N<strong>and</strong>a Devi <strong>and</strong> the Bhagirathi<br />
(Latitude: 30°7’60’’ N, Longitude:<br />
78°34’60’’ E) about 3 050 meters<br />
<strong>RMZ</strong>-M&G 2011, 58
<strong>Bacterial</strong> <strong>indicators</strong> <strong>of</strong> <strong>faecal</strong> <strong>pollution</strong> <strong>and</strong> <strong>physiochemical</strong> assessment <strong>of</strong> ...<br />
above sea level in an ice cave at the<br />
foot <strong>of</strong> the Himalayan glacier known<br />
as Gangotri, merges at Dev Prayag<br />
to form river Ganges, flows through<br />
the northern Indian planes, providing<br />
drainage <strong>and</strong> water for around 400 million<br />
people.<br />
In the recent past, exp<strong>and</strong>ing human<br />
population, industrialization, intensive<br />
agricultural practices <strong>and</strong> discharges<br />
<strong>of</strong> massive amount <strong>of</strong> wastewater into<br />
the river have resulted in deterioration<br />
<strong>of</strong> water quality. The impact <strong>of</strong> these<br />
anthropogenic activities has been so<br />
extensive that the water bodies have<br />
lost their self-purification capacity to a<br />
large extent. Therefore, there is a grown<br />
recognition <strong>and</strong> need that aquatic water<br />
bodies or ecosystem like Ganga must<br />
be sustained so that they may support<br />
human life. This has resulted in scarcity<br />
<strong>of</strong> potable water supply <strong>and</strong> loss<br />
<strong>of</strong> biodiversity in aquatic system. The<br />
health <strong>and</strong> well being <strong>of</strong> the human<br />
race is closely tied up with the quality<br />
<strong>of</strong> water used (SHarMa et al., 2005).<br />
Most <strong>of</strong> the people in the Himalayan<br />
region use surface water for drinking<br />
which is most vulnerable to <strong>pollution</strong><br />
due to the surface run <strong>of</strong>f. Almost<br />
all major rivers have been tapped at<br />
source for drinking water supplies, but<br />
there is no monitoring <strong>of</strong> water quantity<br />
or quality on regular bases. During<br />
bathing the river water is also used for<br />
drinking (Aachman), irrespective <strong>of</strong> its<br />
<strong>RMZ</strong>-M&G 2011, 58<br />
131<br />
water quality. But, it is evident from a<br />
course <strong>of</strong> studies carried out by different<br />
(SRivaStava et al., 1996; kUlSHreS-<br />
THa & SHarMa, 2006) that Ganges<br />
water is highly contaminated with coliforms.<br />
Microorganisms are widely distributed<br />
in nature, <strong>and</strong> their abundance <strong>and</strong> diversity<br />
may be used as an indicator for<br />
the suitability <strong>of</strong> water (okPokwaSili<br />
& akUjoBi, 1996). The use <strong>of</strong> bacteria<br />
as water quality <strong>indicators</strong> can be<br />
viewed in two ways, first, the presence<br />
<strong>of</strong> such bacteria can be taken as an indication<br />
<strong>of</strong> <strong>faecal</strong> contamination <strong>of</strong> the<br />
water <strong>and</strong> thus as a signal to determine<br />
why such contamination is present,<br />
how serious it is <strong>and</strong> what steps can<br />
be taken to eliminate it; second, their<br />
presence can be taken as an indication<br />
<strong>of</strong> the potential danger <strong>of</strong> health risks<br />
that <strong>faecal</strong> contamination posses. The<br />
higher the level <strong>of</strong> indicator bacteria,<br />
the higher the level <strong>of</strong> <strong>faecal</strong> contamination<br />
<strong>and</strong> the greater the risk <strong>of</strong> waterborne<br />
diseases (PiPeS, 1981). A wide<br />
range <strong>of</strong> pathogenic microorganisms<br />
can be transmitted to humans via water<br />
contaminated with <strong>faecal</strong> material.<br />
These include enteropathogenic agents<br />
such as salmonellas, shigellas, enteroviruses,<br />
<strong>and</strong> multicellular parasites as<br />
well as opportunistic pathogens like<br />
Pseudomonas aeroginosa, Klebsiella,<br />
Vibrio parahaemolyticus <strong>and</strong> Aeromonas<br />
hydrophila (HodeGkiSS, 1988).<br />
It is not practicable to test water for
132 SaTi, a., Sood, a., SHarMa, S., BiSHT, S., kUMar, v.<br />
all these organisms, because the isolation<br />
<strong>and</strong> identification <strong>of</strong> many <strong>of</strong> these<br />
is seldom quantitative <strong>and</strong> extremely<br />
complicated (cairneroSS et al., 1980;<br />
world HealTH orGaniZaTion (WHO),<br />
1983). An indirect approach is based<br />
on assumption that the estimation <strong>of</strong><br />
groups <strong>of</strong> normal enteric organisms<br />
will indicate the level <strong>of</strong> <strong>faecal</strong> contamination<br />
<strong>of</strong> the water supply (WHO,<br />
1983). The most widely used <strong>indicators</strong><br />
are the coliform bacteria, which may<br />
be the total coliform that got narrowed<br />
down to the <strong>faecal</strong> coliforms <strong>and</strong> the<br />
<strong>faecal</strong> streptococci (Harwood et al.,<br />
2001; PaTHak & GoPal, 2001; kiStE-<br />
Mann et al., 2002). Concurrently, contamination<br />
<strong>of</strong> water by enteric pathogens<br />
has increased worldwide (craUn,<br />
1986; iSlaM et al., 2001). However, to<br />
the best <strong>of</strong> our knowledge, no report<br />
is available on the bacterial as well as<br />
<strong>physiochemical</strong> parameters analysis <strong>of</strong><br />
two main tributaries <strong>of</strong> Ganges River<br />
in Garhwal Himalayan region. The<br />
overall objective <strong>of</strong> this work was to<br />
investigate the incidence <strong>of</strong> these indicator<br />
organisms, coliforms, <strong>faecal</strong><br />
coliforms <strong>and</strong> <strong>faecal</strong> streptococci in relation<br />
with <strong>physiochemical</strong> parameters<br />
<strong>of</strong> Alakn<strong>and</strong>a <strong>and</strong> Bhagirathi rivers in<br />
different seasons in Garhwal Himalayas,<br />
India.<br />
Materials <strong>and</strong> Methods<br />
Collection <strong>of</strong> water samples<br />
Intensive survey <strong>of</strong> the study area<br />
was done to select different sites from<br />
Gangetic river system <strong>of</strong> Garhwal region.<br />
The Ganges River in Garhwal<br />
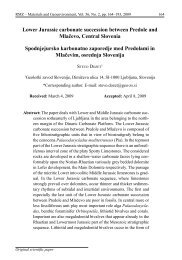
Figure 1. Map <strong>of</strong> the study area <strong>of</strong> Bhagirathi <strong>and</strong> Alakn<strong>and</strong>a river system<br />
<strong>of</strong> Garhwal Himalayas.<br />
<strong>RMZ</strong>-M&G 2011, 58
<strong>Bacterial</strong> <strong>indicators</strong> <strong>of</strong> <strong>faecal</strong> <strong>pollution</strong> <strong>and</strong> <strong>physiochemical</strong> assessment <strong>of</strong> ...<br />
Table 1. Sample collection sites <strong>of</strong> Alakn<strong>and</strong>a <strong>and</strong> Bhagirathi rivers.<br />
Alaknada Bhagirathi<br />
A1 Vasundhara B1 Bhojwasa<br />
A2 Mana B2 Chirwasa<br />
A3 Badrinath (G<strong>and</strong>hi ghat) B3 Gangotri<br />
A4 Badrinath (Rishi ghat) B4 Harsil<br />
A5 Gobind ghat B5 Jhala<br />
A6 Hanuman Chatti B6 Bhaironghati<br />
B7 Gaumukh<br />
Himalayas comprises <strong>of</strong> two tributaries<br />
Bhagirathi <strong>and</strong> Alakn<strong>and</strong>a, so sampling<br />
was done from both the rivers<br />
(Figure 1). The total stretch covered<br />
in this study was about 250 km, out <strong>of</strong><br />
which Alakn<strong>and</strong>a comprised a stretch<br />
<strong>of</strong> 135 km <strong>and</strong> Bhagirathi about 115<br />
km. Samples were collected during the<br />
monsoon, summer <strong>and</strong> winter seasons.<br />
The samples were carefully collected<br />
in triplicate from 13 different places<br />
(Table 1) in sterile containers, <strong>and</strong><br />
were transported in ice boxes at 3° C<br />
<strong>and</strong> brought to the laboratory for analysis<br />
(SHarMa et al 2010). The results<br />
presented in the table are average <strong>of</strong><br />
triplicate samples <strong>of</strong> a particular site.<br />
<strong>Bacterial</strong> analysis<br />
The bacterial population (total viable<br />
count, TVC) in different samples was<br />
estimated by inoculating nutrient agar<br />
plates with 0.1 mL <strong>of</strong> suitable dilutions.<br />
The results were expressed as<br />
colony forming units (cfu) per unit volume,<br />
enumerated after 48 h <strong>of</strong> incubation.<br />
The water quality was determined<br />
by the st<strong>and</strong>ard most probable number<br />
(MPN) method. Coliforms were de-<br />
<strong>RMZ</strong>-M&G 2011, 58<br />
133<br />
tected by inoculation <strong>of</strong> samples into<br />
tubes <strong>of</strong> MacConkey broth <strong>and</strong> incubation<br />
at 37 ± 1 °C for 48 h. The positive<br />
tubes were sub cultured into brilliant<br />
green bile broth (BGBB) <strong>and</strong> were incubated<br />
at 44.5 ± 1 °C. Gas production<br />
in BGBB at 44.5 ± 1 °C was used for<br />
the detection <strong>of</strong> <strong>faecal</strong> coliform after<br />
48 h incubation. Faecal streptococci<br />
were detected by inoculation <strong>of</strong> water<br />
samples into Azide Dextrose broth <strong>and</strong><br />
incubation at 37.5 ± 1 °C for 24–48 h<br />
(APHA et al, 1999). All the culture media<br />
were obtained from Hi-Media Pvt.<br />
Ltd., Mumbai, India.<br />
Physiochemical analysis<br />
Physicochemical parameters including<br />
total dissolved solids (TDS), conductivity<br />
<strong>and</strong> pH were analyzed on site at<br />
the time <strong>of</strong> sample collection by water<br />
analysis kit (Model LT-61, Labtronics,<br />
Guelph, Ontario, Canada) as per<br />
manufacturer instruction. Other parameters<br />
i.e. dissolved oxygen (DO),<br />
biological oxygen dem<strong>and</strong> (BOD) <strong>and</strong><br />
chemical oxygen dem<strong>and</strong> (COD) were<br />
performed in laboratory by st<strong>and</strong>ard titrimetric<br />
method (APHA et al, 1999).
134 SaTi, a., Sood, a., SHarMa, S., BiSHT, S., kUMar, v.<br />
The data were analyzed statistically by<br />
using analysis <strong>of</strong> variance (ANOVA)<br />
to find out significance at 5 % levels.<br />
In figures, error bars indicate st<strong>and</strong>ard<br />
error <strong>of</strong> the mean, where error bars are<br />
not visible; they are smaller than the<br />
marker.<br />
results<br />
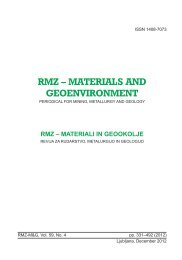
The TVC value showed a regular trend<br />
(Figure 2). The values increased in<br />
monsoon season, thus generally highest<br />
counts were observed, intermediate<br />
in summer season <strong>and</strong> least in winter<br />
season for each sampling site. The<br />
highest TVC was noted in Badrinath<br />
ghat <strong>of</strong> Alakn<strong>and</strong>a river <strong>and</strong> Gangotri<br />
<strong>of</strong> Bhagirathi river, where the values<br />
were as high as 22.2 × 10 3 <strong>and</strong> 19.8 ×<br />
10 3 , respectively. The lowest value 10.2<br />
× 10 3 were recorded in Gobind ghat <strong>of</strong><br />
Alakn<strong>and</strong>a <strong>and</strong> 10.2 × 10 3 in Bhaironghati<br />
<strong>of</strong> Bhagirathi river, respectively.<br />
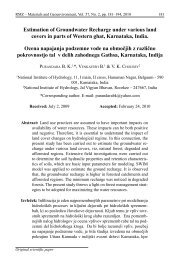
The total coliform count was high in<br />
all water samples (Figure 3), values<br />
ranged from 24/100 mL to 310/100 mL.<br />
The highest MPN (310/100 mL) was<br />
recorded during monsoon at Vasundhara<br />
<strong>of</strong> Alakn<strong>and</strong>a, the least count MPN<br />
(24/100 mL) was obtained in summer<br />
<strong>and</strong> winter season from Bharionghati<br />
<strong>of</strong> Bhagirathi. Even the water samples<br />
during less human activities in winter<br />
season were not found suitable for<br />
drinking as per the BUreaU oF indian<br />
ST<strong>and</strong>ardS (BIS), (1991).<br />
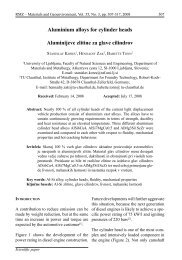
Results for FC <strong>and</strong> FS counts have also<br />
shown a similar trend to TVC <strong>and</strong> TC,<br />
i.e. higher in monsoon season, intermediate<br />
in summer season <strong>and</strong> least<br />
during winter season (Figure 4 <strong>and</strong><br />
5). Highest FC count was observed in<br />
Alakn<strong>and</strong>a at Badrinath (160.4, 122.3,<br />
101.2)/100 mL <strong>and</strong> lowest count was<br />
at Mana (15.3, 10.2, 9.8)/100 mL during<br />
monsoon, summer <strong>and</strong> winter season,<br />
respectively. In Bhagirathi the<br />
Chirwasa <strong>and</strong> Gangotri sites showed<br />
almost similar trend <strong>of</strong> highest count<br />
(45.7, 35.4, 29.8) <strong>and</strong> 45.3, 36.9,<br />
32.1)/100 mL during monsoon, summer<br />
<strong>and</strong> winter seasons, while the least<br />
was observed in Bhaironghati (5.9, 4.5,<br />
3.9)/100 mL during monsoon, summer<br />
<strong>and</strong> winter seasons. Similar trend was<br />
also observed in FS, the higher count<br />
in Alakn<strong>and</strong>a was at Badrinath (25,<br />
20, 18)/100 mL, lowest at Mana (8, 7,<br />
7)/100 mL, while in Bhagirathi, highest<br />
at Harsil (12, 11, 10)/100 mL <strong>and</strong><br />
least at Chirwasa (6, 3, 3)/100L.<br />
The DO value in Alakn<strong>and</strong>a ranged<br />
from 14.2–18.9 mg/L in monsoon<br />
samples <strong>and</strong> 16.9–23.1 mg/L in winter<br />
samples. In Bhagirathi DO values<br />
ranged from 10.2–15.4 mg/L in monsoon<br />
<strong>and</strong> 13.2–19.8 mg/L in winter<br />
season (Figure 6). Badrinath <strong>and</strong> Chirwasa<br />
showed a remarkable increase<br />
in DO in winter season. Though, in<br />
general the DO content <strong>of</strong> all the river<br />
water samples show a uniform trend<br />
with varying seasons i.e. least during<br />
<strong>RMZ</strong>-M&G 2011, 58
<strong>Bacterial</strong> <strong>indicators</strong> <strong>of</strong> <strong>faecal</strong> <strong>pollution</strong> <strong>and</strong> <strong>physiochemical</strong> assessment <strong>of</strong> ...<br />
Figure 2. Total viable count (TVC) from Alakn<strong>and</strong>a <strong>and</strong> Bhagirathi rivers<br />
Figure 3. Total coliforms Alakn<strong>and</strong>a <strong>and</strong> Bhagirathi rivers<br />
<strong>RMZ</strong>-M&G 2011, 58<br />
135
136 SaTi, a., Sood, a., SHarMa, S., BiSHT, S., kUMar, v.<br />
Figure 4. Feacal coliforms count in Alakn<strong>and</strong>a <strong>and</strong> Bhagirathi rivers<br />
Figure 5. Feacal streptococci from Alakn<strong>and</strong>a <strong>and</strong> Bhagirathi rivers<br />
<strong>RMZ</strong>-M&G 2011, 58
<strong>Bacterial</strong> <strong>indicators</strong> <strong>of</strong> <strong>faecal</strong> <strong>pollution</strong> <strong>and</strong> <strong>physiochemical</strong> assessment <strong>of</strong> ...<br />
monsoon, highest during winter <strong>and</strong><br />
intermediate in summer season. However,<br />
all the samples were found to be<br />
saturated with oxygen <strong>and</strong> were fit for<br />
bathing, wild life <strong>and</strong> irrigation with<br />
respect to the amount <strong>of</strong> dissolved oxygen.<br />
The BOD values for most <strong>of</strong> the<br />
water samples were above the permissible<br />
limit (Figure 7), samples in monsoon<br />
season have high BOD value, <strong>and</strong><br />
thus the water was not fit for drinking.<br />
Considerably higher COD values were<br />
recorded in the monsoon season in all<br />
the sites <strong>of</strong> study area, the COD ranged<br />
from 4.5 mg/L to 31 mg/L in all water<br />
samples (Figure 8). The effect <strong>of</strong> season<br />
was observed in the pH <strong>of</strong> water<br />
samples throughout this study. The pH<br />
was slightly alkaline in winter, but al-<br />
<strong>RMZ</strong>-M&G 2011, 58<br />
137<br />
most neutral in summer <strong>and</strong> monsoon<br />
seasons. Conductivity <strong>and</strong> TDS in all<br />
the sites were found to be well within<br />
the minimum prescribed limits (APHA<br />
et al, 1999) (data not given).<br />
discussion<br />
Figure 6. Dissolved oxygen in Alakn<strong>and</strong>a <strong>and</strong> Bhagirathi rivers<br />
In present study, all sites were found to<br />
have high TVC. In fact, the water <strong>of</strong><br />
Ganga is used for drinking (Aachman)<br />
as part <strong>of</strong> rituals in this region. Although<br />
the higher TVC values suggest<br />
that this practice should be avoided.<br />
Earlier BaGHel et al, (2005) <strong>and</strong> Sood<br />
et al., (2008) have also observed high<br />
TVC values in the entire stretch <strong>of</strong> river<br />
Ganga in Uttarakh<strong>and</strong> region. BaGHel
138 SaTi, a., Sood, a., SHarMa, S., BiSHT, S., kUMar, v.<br />
Figure 7. Biological oxygen dem<strong>and</strong> in Alakn<strong>and</strong>a <strong>and</strong> Bhagirathi rivers<br />
Figure 8. Chemical oxygen dem<strong>and</strong> in Alakn<strong>and</strong>a <strong>and</strong> Bhagirathi rivers<br />
<strong>RMZ</strong>-M&G 2011, 58
<strong>Bacterial</strong> <strong>indicators</strong> <strong>of</strong> <strong>faecal</strong> <strong>pollution</strong> <strong>and</strong> <strong>physiochemical</strong> assessment <strong>of</strong> ...<br />
et al, (2005) concluded that large number<br />
<strong>of</strong> animals used by natives <strong>and</strong> pilgrims<br />
in upper stretch <strong>of</strong> Gangetic river<br />
system increase FS load.<br />
As a matter <strong>of</strong> fact, the banks <strong>of</strong><br />
Alakn<strong>and</strong>a are more densely populated<br />
<strong>and</strong> face heavy anthropological<br />
activity as compared to Bhagirathi.<br />
Earlier, FokMare & MUSaddiQ (2001)<br />
have correlated high content <strong>of</strong> MPN<br />
in surface <strong>and</strong> ground water <strong>of</strong> Akola,<br />
Maharashtra (India) with the population<br />
density. Also the fact that the<br />
number <strong>of</strong> sub-tributaries falling in<br />
Alakn<strong>and</strong>a is more than Bhagirathi<br />
may be responsible for the higher coliform<br />
count. The less number <strong>of</strong> FC<br />
<strong>and</strong> FS in most <strong>of</strong> the sites <strong>of</strong> study<br />
area may be attributed to the fever anthropological<br />
activities. All the sites<br />
included in this study were found suitable<br />
for bathing purpose with respect<br />
to the maximum permissible limits <strong>of</strong><br />
FC <strong>and</strong> FS counts as per the st<strong>and</strong>ards<br />
laid by National River Conservation<br />
Directorate (NRCD), India.<br />
Earlier, Sood et al, (2008) have also<br />
studied water quality <strong>of</strong> Ganga in Uttarakh<strong>and</strong><br />
Himalayas, India <strong>and</strong> have<br />
reported a high level <strong>of</strong> BOD due to<br />
introduction <strong>of</strong> organic matter into the<br />
system as a result <strong>of</strong> anthropogenic<br />
activities. Also these values showed<br />
a proportional relation with human<br />
activities i.e. the fewer the human<br />
activities (in winter), the better the<br />
<strong>RMZ</strong>-M&G 2011, 58<br />
139<br />
water with respect to physicochemical<br />
parameters. Higher BOD values in<br />
most <strong>of</strong> the water samples suggest that<br />
either these rivers are rich in organic<br />
matter or organic matter is being introduced<br />
in the rivers by anthropogenic<br />
activities (Tijani et al, 2005), since,<br />
BOD provides a direct measurement<br />
<strong>of</strong> state <strong>of</strong> <strong>pollution</strong>. Relationship<br />
between BOD, COD <strong>and</strong> microbial<br />
count was found inversely proportional,<br />
implying that at high organic<br />
loading rates, the ecosystem retards<br />
the growth <strong>of</strong> aerobic microorganisms<br />
<strong>and</strong> favors the growth <strong>of</strong> anaerobes;<br />
our findings draws support from MTUi<br />
& nakaMUrS (2006).<br />
The use <strong>of</strong> coliform bacteria as a measure<br />
<strong>of</strong> the <strong>faecal</strong> contamination <strong>of</strong><br />
streams <strong>and</strong> lakes has been in practice<br />
for many years. Our study gives an<br />
indication <strong>of</strong> the extent <strong>of</strong> relation <strong>of</strong><br />
microbial <strong>pollution</strong> <strong>and</strong> <strong>physiochemical</strong><br />
parameters; any further addition <strong>of</strong><br />
wastes may deteriorate the existing hygienic<br />
quality in the area. These results<br />
suggest that increase <strong>of</strong> population <strong>of</strong><br />
coliforms in a river environment are<br />
directly proportional to the degree <strong>of</strong><br />
sewage <strong>and</strong> human waste <strong>pollution</strong>,<br />
which is reflected by BOD <strong>and</strong> COD<br />
levels. SaH et al. (2000) have stressed<br />
on the point that the <strong>pollution</strong> in rivers<br />
<strong>and</strong> water bodies from industries may<br />
adversely affect aquatic life <strong>of</strong> water<br />
bodies’ as well human health in the vicinity<br />
<strong>of</strong> rivers/lakes.
140 SaTi, a., Sood, a., SHarMa, S., BiSHT, S., kUMar, v.<br />
In a broad view, the river site with<br />
higher catchments area, soil cover<br />
<strong>and</strong> l<strong>and</strong> use are more polluted, owing<br />
to more anthropogenic activities.<br />
Mclellan et al, (2001) stated that<br />
<strong>faecal</strong> <strong>pollution</strong> indicator organisms<br />
can be used to a number <strong>of</strong> conditions<br />
related to the health <strong>of</strong> aquatic ecosystems<br />
<strong>and</strong> to the potential for health effects<br />
among individuals using aquatic<br />
environments. The presence <strong>of</strong> such<br />
indicator organisms may provide indication<br />
<strong>of</strong> water-borne problems <strong>and</strong><br />
is a direct threat to human <strong>and</strong> animal<br />
health. Our studies on microbial<br />
ecology <strong>and</strong> <strong>physiochemical</strong> analysis<br />
in the upper Gangetic tributaries in<br />
relation to <strong>pollution</strong> have clearly revealed<br />
that there is significant presence<br />
<strong>of</strong> bacterial <strong>indicators</strong> <strong>of</strong> <strong>faecal</strong><br />
<strong>pollution</strong>; the situation is serious <strong>and</strong><br />
alarming. Presence <strong>of</strong> bacterial <strong>indicators</strong><br />
<strong>of</strong> <strong>faecal</strong> contamination in river<br />
water at origin clearly revealed the<br />
bacteriological status <strong>of</strong> the water at<br />
that site. For this reason, monitoring<br />
<strong>of</strong> microbial contamination in river<br />
should be an essential component <strong>of</strong><br />
the protection strategy in that area.<br />
The base line data generated on bacteriological<br />
water quality <strong>of</strong> rivers<br />
may serve as biomonitoring st<strong>and</strong>ard<br />
<strong>and</strong> comparisons for other rivers <strong>and</strong><br />
may be useful for all scientists, decision<br />
makers <strong>and</strong> resource managers<br />
working with environmental planning<br />
<strong>and</strong> management <strong>of</strong> such areas.<br />
conclusions<br />
The rationale <strong>of</strong> this study was to<br />
evaluate the impact <strong>of</strong> season <strong>and</strong> human<br />
activities on the <strong>pollution</strong> status<br />
<strong>of</strong> main upper Gangetic tributaries.<br />
This study revealed that tributaries at<br />
origin are threatened by high influx <strong>of</strong><br />
pollutants <strong>and</strong> enteric pathogenic contamination<br />
<strong>and</strong> it can be concluded<br />
that In Alakn<strong>and</strong>a River, Badrinath is<br />
most polluted <strong>and</strong> Mana is the least,<br />
while in Bhagirathi River Gangotri is<br />
most polluted <strong>and</strong> Gaumukh is least.<br />
The constant surveillance <strong>of</strong> these<br />
water bodies with respect to the bacterial<br />
<strong>indicators</strong> <strong>and</strong> physicochemical<br />
parameters provides us with the<br />
opportunity <strong>of</strong> true microbiological<br />
monitoring <strong>of</strong> the area as well as<br />
proper management actions could be<br />
applied in order to improve the quality<br />
<strong>of</strong> these holy rivers <strong>and</strong> consequently<br />
reduce public health risk.<br />
Acknowledgments<br />
Authors are grateful to the Management<br />
<strong>of</strong> SBS Post Graduate Institute<br />
<strong>of</strong> Bio-Medical Sciences <strong>and</strong> Research<br />
Balawala, Dehradun, (UK), India for<br />
providing research facilities required<br />
to carry out this work.<br />
<strong>RMZ</strong>-M&G 2011, 58
<strong>Bacterial</strong> <strong>indicators</strong> <strong>of</strong> <strong>faecal</strong> <strong>pollution</strong> <strong>and</strong> <strong>physiochemical</strong> assessment <strong>of</strong> ...<br />
references<br />
APHA, AWWA, WEF (1998): St<strong>and</strong>ards<br />
for Examination <strong>of</strong> Water <strong>and</strong><br />
Wastewater, 20th ed. American<br />
Public Health Association, Washington<br />
DC USA.<br />
BaGHel, V. S., GoPal, K., diwedi, S. &<br />
TriPaTHi, R. D. (2005): <strong>Bacterial</strong><br />
<strong>indicators</strong> <strong>of</strong> <strong>faecal</strong> contamination<br />
<strong>of</strong> the Gangetic river system right<br />
at its source. Ecol. Indicators, Vol.<br />
5, pp 49–56.<br />
BIS (1991): Indian st<strong>and</strong>ard specification<br />
for drinking water. IS: 10500, Indian<br />
St<strong>and</strong>ard Institute.<br />
cairneroSS, S., carrUTHerS, I., cUrTiS,<br />
D., FeacHeM, R., Bradley, D. &<br />
Baldwin, G. (1980): Evaluation<br />
for Village Water Supply Planning.<br />
Wiley, Chichester, p. 277.<br />
craUn, G. F. (1986): Water Borne Disease<br />
in the United States. CRC Press,<br />
Boca Raton, FL.<br />
FokMare, A. K. & MUSaddiQ, M. (2001):<br />
Comparative studies <strong>of</strong> physico<br />
chemical & bacteriological quality<br />
<strong>of</strong> surface & groundwater at<br />
Akola (Maharastra). Pollution<br />
Res., Vol. 20, No. 4, pp 651–655.<br />
Harwood, V. J., Brownell, M., PerUSek,<br />
W. & wHiTelock, J. E (2001):<br />
Vancomycin-resistant enterococcus<br />
sp. Isolated from waste water<br />
<strong>and</strong> chicken feces in the United<br />
States. Appl. & Environ. Microbiol.<br />
Vol. 67, pp. 4930–4933.<br />
HodeGkiSS, I. J. (1988): Bacteriological<br />
monitoring <strong>of</strong> Hong Kong marine<br />
water quality. Environ. Int. Vol.<br />
14, pp. 495–499.<br />
<strong>RMZ</strong>-M&G 2011, 58<br />
141<br />
iSlaM, M. S., Siddika, A., kHan, M. N. H.,<br />
Goldar, M. M., SadiQUe, M. A.,<br />
kaBir, A. N. M. H., HUQ, A. &<br />
colwell, R. R. (2001): Microbiological<br />
analysis <strong>of</strong> tube-well water<br />
in a rural area <strong>of</strong> Bangladesh.<br />
Appl. & Environ. Microbiol. Vol.<br />
67, pp. 3328–3330.<br />
kiSTeMann, T., claBen, T., kocH, C., dan-<br />
GendorF, F., FiScHeder, R., GeBel,<br />
J., vacaTa,V. & eXner, M. (2002):<br />
Microbial load <strong>of</strong> drinking water<br />
reservoir Tributaries during extreme<br />
rainfall <strong>and</strong> run<strong>of</strong>f. Appl. &<br />
Environ. Microbiol. Vol. 68, pp.<br />
2188–2197.<br />
kUlSHreSTHa, H. & SHarMa, S. (2006):<br />
Impact <strong>of</strong> mass bathing during Ardhkumbh<br />
on water quality status<br />
<strong>of</strong> river Ganga. J. Environ. Biol.<br />
Vol. 27, No. 2, 437–440.<br />
Mclellan, S. L., danielS, A. D. & Sal-<br />
More, A. K. (2001): Clonal populations<br />
<strong>of</strong> thermotolerant enterobacteriaceaes<br />
in recreational<br />
water <strong>and</strong> their potential interference<br />
with foecal Escherichia coli<br />
counts. Appl. & Environ. Microbiol.<br />
Vol. 67, pp. 4934–4938.<br />
MTUi, G. V. S. & nakaMUrS, Y. (2006):<br />
Physiochemical <strong>and</strong> microbiological<br />
water quality <strong>of</strong> lake Sagara<br />
in Malagarasi wetl<strong>and</strong>s. J. Eng. &<br />
Appl. Sci. Vol. 1, No. 2, pp. 174–<br />
180.<br />
okPokwaSili, G. C. & akUjoBi, T. C.<br />
(1996): Bacteriological <strong>indicators</strong><br />
<strong>of</strong> tropical water quality. Environ.<br />
Toxicol. & Water Quality. Vol.11,<br />
pp 77–81.<br />
PaTHak, S. P. & GoPal, K. (2001): Rapid
142 SaTi, a., Sood, a., SHarMa, S., BiSHT, S., kUMar, v.<br />
detection <strong>of</strong> Escherichia coli as an<br />
indicator <strong>of</strong> <strong>faecal</strong> <strong>pollution</strong> in water.<br />
Indian J. Microbiol.Vol. 41, pp<br />
139–151.<br />
PiPeS,W. O. (1981): <strong>Bacterial</strong> <strong>indicators</strong> <strong>of</strong><br />
<strong>pollution</strong>. CRC Press Inc., Boca<br />
Raton, FL, p. 242.<br />
SaH, J. P., SaH, S. K., acHarya P., PanT D.<br />
& lance V. A. (2000): Assessment<br />
<strong>of</strong> water <strong>pollution</strong> in the Narayani<br />
River, Nepal. Int. J. <strong>of</strong> Ecol. & Environ.<br />
Sci. Vol. 26, pp 235–252.<br />
SHarMa, P., Sood, A., SHarMa, S., BiSHT,<br />
S., kUMar, V., P<strong>and</strong>ey, P., GUSain,<br />
M. P. & GUSain, O. P. (2010): <strong>Bacterial</strong><br />
<strong>indicators</strong> <strong>of</strong> <strong>faecal</strong> <strong>pollution</strong><br />
<strong>and</strong> <strong>physiochemical</strong> assessment<br />
<strong>of</strong> important North Indian lakes.<br />
<strong>RMZ</strong>-Mate. & Geoenviron. Vol.<br />
57, pp 25–40.<br />
SHarMa, S., BajracHarya, R. M., SiTaUla,<br />
B. K. & MerZ, J. (2005): Water<br />
quality in the central Himalaya.<br />
Curr. Sci. Vol. 81, pp 774–786.<br />
Sood, A., SinGH, K. D., P<strong>and</strong>ey, P. &<br />
SHarMa, S. (2008): Assessment <strong>of</strong><br />
bacterial <strong>indicators</strong> <strong>and</strong> physicochemical<br />
parameters to investigate<br />
<strong>pollution</strong> status <strong>of</strong> Gangetic river<br />
system <strong>of</strong> Uttarakh<strong>and</strong> (India).<br />
Ecol. Indicators. Vol. 8, 709–717.<br />
SRivaStava, R. K., SinHa, A. K., P<strong>and</strong>ey,<br />
D. P., SinGH, K. P. & cH<strong>and</strong>ra, H.<br />
(1996): Water quality <strong>of</strong> the river<br />
Ganga at Phaphamau (Allahabad):<br />
Effect <strong>of</strong> mass bathing during Mahakumbh.<br />
Environ. Toxic. Water<br />
Quality. Vol. 11, No. 1, pp 1–5.<br />
Tijani, M. N., BaloGUn, S. A. & adeleye,<br />
M. A. (2005): Chemical <strong>and</strong><br />
microbiological assessment <strong>of</strong><br />
water <strong>and</strong> bottom-sediments contaminations<br />
in Awba lake (U.I),<br />
Ibadan, SW-Nigeria. <strong>RMZ</strong>-Mate.<br />
& Geoenviron. Vol. 52, pp. 123–<br />
126.<br />
world HealTH orGaniZaTion (1983):<br />
Guidelines for Drinking Water<br />
Quality, Vol. 3. World Health Organization,<br />
Geneva.<br />
<strong>RMZ</strong>-M&G 2011, 58
<strong>RMZ</strong> – Materials <strong>and</strong> Geoenvironment, Vol. 58, No. 2, pp. 143–162, 2011<br />
Integrated geophysical <strong>and</strong> geotechnical investigation <strong>of</strong> the<br />
failed portion <strong>of</strong> a road in basement complex Terrain,<br />
Southwest Nigeria<br />
Povezane ge<strong>of</strong>izikalne in geotehnične preiskave poškodovanega<br />
dela ceste na ozemlju metamorfne podlage v Jugozahodni<br />
Nigeriji<br />
oSinowo, o. olawale 1, * , akanji, a. olUSoji 1 , akinMoSin adewale 2<br />
1 University <strong>of</strong> Ibadan, Department <strong>of</strong> Geology, Ibadan, Nigeria<br />
2 University <strong>of</strong> Lagos, Department <strong>of</strong> Earth Sciences, Lagos, Nigeria<br />
Original scientific paper<br />
*Corresponding author. E-mail: wale.osinowo@mail.ui.edu.ng<br />
Received: March 23, 2011 Accepted: May 3, 2011<br />
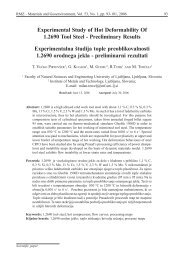
Abstract: Several efforts by the local authority to fix the bad portions<br />
<strong>of</strong> Ijebu-Ode–Erunwon road, southwest Nigeria have yielded<br />
no meaningful result, as the road <strong>of</strong>ten get deteriorated shortly<br />
after repairs. Geophysical investigation integrated with geotechnical<br />
studies were undertaken to determine causes <strong>of</strong> the<br />
consistent failure <strong>of</strong> the highway. Very Low Frequency Electromagnetic<br />
(VLF-EM) <strong>and</strong> Electrical Resistivity (ER) methods<br />
were employed to map sections <strong>of</strong> the road with anomalous<br />
electrical responses <strong>and</strong> interpreted in-terms <strong>of</strong> structures, lithology<br />
<strong>and</strong> water saturation.<br />
VLF-EM plots identified positive peaks <strong>of</strong> filtered real amplitudes<br />
greater than 30 % which correspond to major <strong>and</strong> minor<br />
linear fractures within the basement rocks. High current density<br />
>30 <strong>and</strong> low resistivity
144 oSinowo, o. o., akanji, o. a., akinMoSin a.<br />
This study implies that integrated geophysical <strong>and</strong> geotechnical<br />
investigation <strong>of</strong>fers very useful approach for characterizing<br />
near surface earth which could be helpful in site preparation<br />
prior to construction.<br />
Izvleček: Vrsta poizkusov krajevnih oblasti, da bi popravili slabe odseke<br />
ceste Ijebu-Ode–Erunwon v jugozahodni Nigeriji ni bila<br />
uspešna, ker se je navadno stanje ceste poslabšalo kmalu nato,<br />
ko so jo popravili. Da bi ugotovili vzroke za ponavljajoče se<br />
propadanje ceste, so opravili ge<strong>of</strong>izikalne raziskave v povezavi<br />
z geotehničnimi študijami. Z zelo nizk<strong>of</strong>rekvenčno elektromagnetno<br />
metodo (VLF-EM) in metodo specifične električne<br />
upornosti (ER) so preiskali odseke ceste z anomalnimi električnimi<br />
lastnostmi in jih interpretirali z ozirom na zgradbo, litologijo<br />
in nasičenost z vodo.<br />
Na diagramih VLF – EM so ugotovili pozitivne vrhove filtriranih<br />
realnih amplitud večjih od 30 %, ki ustrezajo večjim in<br />
manjšim linearnim razpokam v kamninah podlage. Visoka gostota<br />
toka >30 in nizka specifična upornost
Integrated geophysical <strong>and</strong> geotechnical investigation <strong>of</strong> the failed portion ...<br />
Introduction<br />
Flexible highway aids easy <strong>and</strong> smooth<br />
vehicular movement, <strong>and</strong> has been<br />
very useful for transportation <strong>of</strong> people,<br />
goods <strong>and</strong> services from one point<br />
to another, especially in developing<br />
countries where other means <strong>of</strong> transportation<br />
such as rail, underground<br />
tube, air <strong>and</strong> water transport system<br />
have remained largely undeveloped.<br />
However, bad portions <strong>of</strong> road, many<br />
<strong>of</strong> which result from poor construction<br />
or being founded on incompetent<br />
sub-grade <strong>and</strong> sub-base materials had<br />
been found to do more harm than good.<br />
They have been responsible for many<br />
fatal accidents, wearing down <strong>of</strong> vehicles<br />
<strong>and</strong> waste <strong>of</strong> valuable time during<br />
traffic jams. The various types <strong>of</strong><br />
road failure identified in the study area<br />
include failure <strong>of</strong> the black top surfacing,<br />
especially along wheel cracks, pitting<br />
or minor dent, shear or massive<br />
failure (pot-holes) extending through<br />
<strong>RMZ</strong>-M&G 2011, 58<br />
145<br />
the pavement occasionally to the subgrade.<br />
(Plate 1)<br />
The integrity <strong>of</strong> near surface geophysical<br />
investigation methods to complement<br />
geotechnical studies in some foundation<br />
engineering problems cannot be<br />
overemphasized. This research therefore<br />
integrates Electromagnetic, Electrical<br />
Resistivity <strong>and</strong> geotechnical techniques<br />
to study the causes <strong>of</strong> consistent failure<br />
<strong>of</strong> Luba–Erunwon axis <strong>of</strong> Ijebu-Ode–<br />
Erunwon road. It involves lateral <strong>and</strong><br />
vertical probe <strong>of</strong> the failed, fairly stable,<br />
fairly failed <strong>and</strong> stable portion <strong>of</strong> the road<br />
in order to characterize the near surface<br />
geologic materials that constitute the<br />
sub-grade, sub-base <strong>and</strong> the foundation<br />
upon which the pavement was founded.<br />
The study area is situated within the<br />
southwestern part <strong>of</strong> Nigeria, it lies between<br />
longitudes 6 0 49’ N <strong>and</strong> 6°52’ N,<br />
latitude 3 0 56’ E <strong>and</strong> 3 0 58’ E <strong>and</strong> the studied<br />
portion <strong>of</strong> the pavement is about 2<br />
Plate 1. Failed section <strong>of</strong> Luba–Erunwon axis <strong>of</strong> Ijebu-Ode–Erunwon road
146 oSinowo, o. o., akanji, o. a., akinMoSin a.<br />
km in length. The road was initially constructed<br />
in 1983 <strong>and</strong> have since suffered<br />
major failures, especially in the northeastern<br />
end, towards Erunwon axis <strong>of</strong><br />
the road. The road has been repaired<br />
severally, the repairs usually include minor<br />
repair <strong>of</strong> the road element <strong>and</strong> resurfacing.<br />
However the northeastern part<br />
<strong>of</strong> the road always starts to deteriorate<br />
barely six months after reconstruction.<br />
Geological setting<br />
Ijebu-Ode <strong>and</strong> environ lies within the<br />
transitional zone between the Precam-<br />
brian Basement Complex rocks <strong>of</strong> the<br />
southwestern Nigeria <strong>and</strong> the Cretaceous<br />
sediments <strong>of</strong> Abeokuta Group<br />
in eastern part <strong>of</strong> Dahomey Basin. The<br />
basement rocks occur predominantly<br />
in the north, northwest <strong>and</strong> northeastern<br />
parts <strong>of</strong> the field <strong>and</strong> it is predominantly<br />
a Migmatite Gneiss Complex<br />
<strong>of</strong> biotite granite gneiss, biotite-hornblende<br />
gneiss with varying degrees<br />
<strong>of</strong> fracturing (Olayinka <strong>and</strong> Osinowo,<br />
2009). The southern part <strong>of</strong> the field is<br />
overlain by Ise Member <strong>of</strong> Abeokuta<br />
group that unconformably overlies<br />
the basement rocks. Litho-stratigraphically,<br />
Abeokuta Group comprise <strong>of</strong><br />
Figure 1. Geological map <strong>of</strong> Ijebu-Ode <strong>and</strong> its environ with geological<br />
map <strong>of</strong> Nigeria inserted<br />
<strong>RMZ</strong>-M&G 2011, 58
Integrated geophysical <strong>and</strong> geotechnical investigation <strong>of</strong> the failed portion ...<br />
grits, arkosic s<strong>and</strong>stones, siltstones <strong>and</strong><br />
clay with occasional conglomerate <strong>of</strong><br />
predominantly arenaceous materials<br />
(Omatsola <strong>and</strong> Adegoke, 1981). Figure<br />
1 shows the geology <strong>of</strong> Ijebu-Ode <strong>and</strong><br />
its environ.<br />
Materials <strong>and</strong> Methods<br />
Electromagnetic method is one <strong>of</strong> the<br />
geophysical methods commonly used<br />
in foundation investigation <strong>and</strong> environmental<br />
studies (OlorUnFeMi &<br />
MeSida, 1987; SHarMa, 1997). The<br />
principle is based on induction <strong>of</strong> a<br />
secondary magnetic field H in the<br />
s<br />
subsurface conductor <strong>of</strong> conductivity<br />
σ due to effect <strong>of</strong> an artificially generated<br />
primary field H Electromagnetic<br />
P.<br />
measurements are usually presented<br />
as the mutual impedance ratio Z/Z or 0<br />
relative charge in the impedance over a<br />
conductor which has ability to provide<br />
clear information about the subsurface<br />
conductivity <strong>and</strong> structure.<br />
z Z/Z – 1 = H (ω, σ, h, s)<br />
0 s<br />
z H (s) p<br />
ABEM WADI was used for VLF-EM<br />
measurements, it uses military transmitters<br />
as the source <strong>of</strong> primary electromagnetic<br />
waves H which is lo-<br />
P<br />
cated several kilometers away at the<br />
high powered military communication<br />
transmission stations. The transmitter’s<br />
antenna transmits signals continuously<br />
at low radio frequency range <strong>of</strong> 15–30<br />
<strong>RMZ</strong>-M&G 2011, 58<br />
147<br />
kHz. The signals generated can travel<br />
long distance <strong>and</strong> able to penetrate<br />
the subsurface to induce eddy current<br />
in buried conductors. The technique<br />
measures the components <strong>of</strong> Very Low<br />
Frequency EM field which are related<br />
to the geoelectric structure <strong>of</strong> the subsurface.<br />
(CHoUTeaU et al, 1996). Five<br />
VLF-EM pr<strong>of</strong>ile stations were occupied<br />
with the pr<strong>of</strong>ile length ranging<br />
from 250 m to 850 m. Readings were<br />
taking at station interval <strong>of</strong> 3 m <strong>and</strong><br />
6 m. Measurements such as raw real,<br />
raw imaginary, station’s latitude <strong>and</strong><br />
longitude <strong>and</strong> the signal strength were<br />
recorded against station interval.<br />
Electrical resistivity investigation <strong>of</strong><br />
the subsurface involved determination<br />
<strong>of</strong> the distribution <strong>of</strong> ground resistivity<br />
based on its response to the flow <strong>of</strong><br />
electric current injected during surface<br />
measurement. True ground resistivity<br />
<strong>of</strong> the subsurface can be estimated <strong>and</strong><br />
can further be employed to interpret<br />
the subsurface qualitatively <strong>and</strong> quantitatively<br />
((lokE, 2001). Georesistivity<br />
survey involved measurement <strong>of</strong><br />
potential difference generated by the<br />
current electrodes adapted to Wenner<br />
<strong>and</strong> Schlumberger electrode configurations.<br />
r a = ∆V/I · K<br />
K is the geometric factor.<br />
Two measurement methods were<br />
adopted; 1-D Vertical Electrical Sound-
148 oSinowo, o. o., akanji, o. a., akinMoSin a.<br />
ing (VES) <strong>and</strong> 2-D resistivity measurement<br />
using Electrical Resistivity Traversing<br />
(ERT) technique. The 1D VES<br />
measurements aimed at determining the<br />
variation in the geoelectric parameters<br />
with depth at the probed stations while<br />
2D method mapped resistivity continuity<br />
useful to delineate structurally<br />
weak zones that could be responsible<br />
for continuous failure <strong>of</strong> the road. Geopulse<br />
Tigre resistivity meter was used<br />
to measure ground resistance. Current<br />
electrodes for 1D measurement were<br />
spread from AB/2 <strong>of</strong> 1 m to 133 m for<br />
VES measurement. Two dimensional<br />
measurements was made by increasing<br />
the electrode spacing along the levels.<br />
Ten levels along pr<strong>of</strong>iles were covered<br />
with electrode spacing range from 3 m<br />
to 30 m at incremental step <strong>of</strong> 3 across<br />
100 m long pr<strong>of</strong>ile.<br />
Geotechnical studies to determine<br />
some engineering index properties <strong>of</strong><br />
sub-grade <strong>and</strong> sub-base materials employed<br />
to corroborate the geophysical<br />
measurements involved collection <strong>of</strong><br />
twelve disturbed bulk samples from<br />
four pits each drilled to depth <strong>of</strong> 1 m <strong>and</strong><br />
at sampling depths <strong>of</strong> 0–0.3 m, 0.3–0.6<br />
m <strong>and</strong> 0.6–1.0 m from each pit. Sample<br />
recovering pits were constructed<br />
at the failed, fairly stable, fairly failed<br />
<strong>and</strong> stable parts <strong>of</strong> the road at 80 m,<br />
247 m, 300 m <strong>and</strong> 470 m on the road.<br />
Mechanical sieving helped determined<br />
particle size distribution <strong>of</strong> gravel <strong>and</strong><br />
s<strong>and</strong> proportions <strong>of</strong> dried coarse frac-<br />
tion. Consistency Limit Tests generally<br />
known as the Atterberg limits gave the<br />
plasticity characteristics <strong>of</strong> the cohesive<br />
fraction <strong>of</strong> the sieved samples. The<br />
consistency limit test includes; liquid<br />
limit, plastic limit <strong>and</strong> linear shrinkage<br />
test. The difference between the liquid<br />
<strong>and</strong> plastic limits gave the plasticity<br />
index, which is the range <strong>of</strong> moisture<br />
contents over which the soil remains<br />
plastic.<br />
California Bearing Ratio (CBR) test,<br />
widely used to characterize <strong>and</strong> select<br />
sub-grade materials for use in road<br />
construction was carried out. The test<br />
was devised by the California Highway<br />
Association <strong>and</strong> it is simply the ratio <strong>of</strong><br />
the load that cause a penetration <strong>of</strong> 2.5<br />
mm or 5.0 mm material to a st<strong>and</strong>ard<br />
load that causes similar penetration on<br />
a st<strong>and</strong>ard California sample, notably<br />
13.24 kN <strong>and</strong> 19.96 kN respectively.<br />
C B R = Load that caused a penetration<br />
<strong>of</strong> 2.5/5.0 mm × 100 %<br />
13.24/19.96 (kN)<br />
Both soaked <strong>and</strong> unsoaked CBR tests<br />
were carried out <strong>and</strong> swelling <strong>of</strong> samples<br />
was carefully monitored during<br />
the 96 h <strong>of</strong> soaking period to assess<br />
the likely effect <strong>of</strong> water ingress<br />
on the swelling <strong>of</strong> base material. The<br />
samples were compacted at the modified<br />
AASHTO level as described under<br />
procedure for compaction test in a<br />
st<strong>and</strong>ard CBR mold.<br />
<strong>RMZ</strong>-M&G 2011, 58
Integrated geophysical <strong>and</strong> geotechnical investigation <strong>of</strong> the failed portion ...<br />
Data processing<br />
The obtained raw real (in-phase) <strong>and</strong><br />
raw imaginary (quadrature) components<br />
contain valuable diagnostic information<br />
<strong>of</strong> the subsurface but in a<br />
complex pattern that cannot directly<br />
<strong>and</strong> easily be related to the causative<br />
body. They contain noise, the raw real/<br />
imaginary data are also <strong>of</strong>ten wrongly<br />
located on the source along the pr<strong>of</strong>ile.<br />
To correct the above effects <strong>and</strong> obtain<br />
pr<strong>of</strong>iles or pseudo-section/images that<br />
are easy to interpret, two different data<br />
processing techniques were applied.<br />
FraSer (1969) <strong>and</strong> karoUS & HjelT<br />
(1977, 1983) filtering operators. Fraser<br />
filter is a linear high-frequency b<strong>and</strong>pass<br />
filter that yields semi-quantitative<br />
interpretation <strong>of</strong> data. It transforms the<br />
in-phase components into contourable<br />
data with noise reduced to the best possible<br />
minimum. VLFPROS MATLAB<br />
code for processing VLF-EM data developed<br />
by SUndararajan et al. (2006)<br />
was employed to carry out both the<br />
Fraser <strong>and</strong> the Karous <strong>and</strong> Hjelt filtering<br />
operations.<br />
Electrical resistivity data processing<br />
involved cleaning the data to remove<br />
spurious readings. Resultant VES data<br />
were plotted on bi-log paper <strong>and</strong> partial<br />
curve matched using st<strong>and</strong>ard two layer<br />
curves <strong>and</strong> auxiliary curves; Cagniard<br />
graph (koeFoed, 1979), to obtain some<br />
geoelectrical parameters such as layer<br />
depth/thickness <strong>and</strong> layer resistivity<br />
<strong>RMZ</strong>-M&G 2011, 58<br />
149<br />
values (Orellana & Mooney, 1966).<br />
The obtained geoelectrical parameters<br />
from partial curve matching were used<br />
as initial model parameters to interpret<br />
the geoelectrical sounding curves using<br />
inversion model s<strong>of</strong>tware RESIST<br />
(v<strong>and</strong>er velPen, 1988) <strong>and</strong> WinG-<br />
Link. The inversion algorithm involves<br />
the calculation <strong>of</strong> curves for observed<br />
data by convolving the resistivity transform<br />
with appropriate filter coefficient,<br />
(GHoSH, 1971 <strong>and</strong> o’neill, 1975). The<br />
inversion algorithm filters spurious<br />
data, enhance signal as well as correct<br />
depth matched for obtained geoelectric<br />
layers.<br />
Data Quality Check (QC) was carried<br />
out on the obtained ERT data for<br />
spurious data. The resultant data were<br />
inverted using the DIPRO inversion<br />
s<strong>of</strong>tware based on the inversion prin-<br />
ciple presented by yi & kiM, (1988).<br />
1<br />
The s<strong>of</strong>tware is a 2 2<br />
dimensional inversion<br />
subroutine designed based on<br />
the Least Square inversion algorithm<br />
<strong>and</strong> uses two different modeling <strong>and</strong><br />
smoothening approaches. The FDM<br />
Inversion performs smoothness constrained<br />
least square inversions based<br />
on the finite difference modeling assuming<br />
flat topography, while the FEM<br />
performs smoothness constrained least<br />
square inversion based on finite element<br />
modeling. The s<strong>of</strong>tware automatically<br />
determines a two dimensional<br />
resistivity model <strong>of</strong> the subsurface for<br />
the obtained data. A forward modeling
150 oSinowo, o. o., akanji, o. a., akinMoSin a.<br />
subroutine is applied to calculate theoretical<br />
apparent resistivity values <strong>and</strong><br />
a non-linear least squares optimisation<br />
techniques was used for the inversion<br />
subroutine, (deGrooT-Hedlin & con-<br />
STaBle, 1990 <strong>and</strong> SaSaki, 1989).<br />
Results<br />
Palacky et al. (1981), de rooy et al.<br />
(1986), HaZell et al. (1988) <strong>and</strong> other<br />
authors have shown the relevance <strong>of</strong><br />
EM method to be in overburden thickness<br />
estimation <strong>and</strong> basement fracture<br />
delineation. Figures 2 (a–f) present the<br />
VLF-EM plot <strong>of</strong> raw real <strong>and</strong> filtered<br />
real components against the pr<strong>of</strong>ile<br />
distance in meters. Two basic anomaly<br />
types were identified using characteristic<br />
feature curves <strong>of</strong> coincident inflections<br />
on real component anomaly<br />
curves as well as the amplitude <strong>of</strong> the<br />
filtered real anomaly. The sign ‘F’ indicates<br />
point with positive peak filtered<br />
real anomaly with amplitude ranging<br />
between 30–60 %. It characterizes regions<br />
or points along the pr<strong>of</strong>ile with<br />
major linear displacement at depth
Integrated geophysical <strong>and</strong> geotechnical investigation <strong>of</strong> the failed portion ...<br />
6 (a <strong>and</strong> b) present the representative<br />
curves <strong>and</strong> interpreted log <strong>of</strong> VES data<br />
<strong>RMZ</strong>-M&G 2011, 58<br />
151<br />
around the stable <strong>and</strong> failed portion <strong>of</strong><br />
the road.<br />
Figure 2. VLF – EM Curve <strong>of</strong> Raw real <strong>and</strong> Filtered real Components.<br />
Figure 3. Current density plot along VLF – EM Pr<strong>of</strong>ile 1 (F = Failed, S =<br />
Stable, FS = Fairly Stable)
152 oSinowo, o. o., akanji, o. a., akinMoSin a.<br />
NE<br />
NE<br />
Figure 4. Field data pseudo section, theoretical pseudo section <strong>and</strong> ERT<br />
sections along Ijebu-Ode–Erunwon road.<br />
Figure 5. Inverted Electrical Resistivity section from VES data around the<br />
study area.<br />
SW<br />
SW<br />
<strong>RMZ</strong>-M&G 2011, 58
Integrated geophysical <strong>and</strong> geotechnical investigation <strong>of</strong> the failed portion ...<br />
VES 31<br />
Layers 1 2 3 4<br />
Resistivity (Ω m) 311 77.1 808 2813<br />
Depth (m) 0.45 1.1 18.9 -<br />
Interpretation Top soil S<strong>and</strong>y clay Unsaturated s<strong>and</strong> Fresh basement rock<br />
Figure 6a. Representative VES curve <strong>and</strong> interpreted log around stable<br />
part <strong>of</strong> the Ijebu-Ode–Erunwon road<br />
VES 25<br />
Layers 1 2 3 4 5<br />
Resistivity (Ω m) 516 283 4144<br />
Depth (m) 1.57 16.1 -<br />
Interpretation Top soil Fractured basement rock Fresh basement rock<br />
Figure 6b. Representative VES curve <strong>and</strong> interpreted log around failed<br />
part <strong>of</strong> the Ijebu-Ode–Erunwon road<br />
<strong>RMZ</strong>-M&G 2011, 58<br />
153
154 oSinowo, o. o., akanji, o. a., akinMoSin a.<br />
Results <strong>of</strong> Geotechnical analysis<br />
Geotechnical investigation <strong>of</strong> the<br />
highway is aimed at ascertaining geotechnical<br />
bases for the road failure.<br />
Table 1 presents a description <strong>of</strong> the<br />
recovered samples.<br />
Grain size distribution<br />
Table 2 presents the summary <strong>of</strong> the grain<br />
size distribution. Samples 2C, 3B, 3C, 4B<br />
Table 1. Soil pr<strong>of</strong>iles in the study area<br />
<strong>and</strong> 4C have higher fines constituent than<br />
other samples. The percentage <strong>of</strong> fines<br />
ranges from 22–26 %, 23–45 %, 21–37<br />
% <strong>and</strong> 24–46 % for samples from failed,<br />
fairly stable, fairly failed <strong>and</strong> stable parts<br />
<strong>of</strong> the road respectively. The result indicates<br />
that the soil units below the stable<br />
parts <strong>of</strong> the road exhibit better engineering<br />
properties than those <strong>of</strong> the failed,<br />
fairly failed <strong>and</strong> fairly stable portions.<br />
Depth Range (m) Road condition Pit No Sample code Colour Name<br />
0-03<br />
1 1A Brown Clayey s<strong>and</strong><br />
0.3-0.6 Failed<br />
1 1B Brown Clayey s<strong>and</strong><br />
0.6-1.0 1 1C Very brown Clayey s<strong>and</strong><br />
0.0-3<br />
2 2A Brown Clayey s<strong>and</strong><br />
0.3-0.6 Fairly stable 2 2B Brown S<strong>and</strong>y clay<br />
0.6-1 2 2C Reddish brown S<strong>and</strong>y clay<br />
0-0.3<br />
3 3A Brown S<strong>and</strong>y clay<br />
0.3-0.6 Fairly failed 3 3B Reddish brown Silty clay<br />
0.6-1 3 3C Reddish brown Silty clay<br />
0-0.3<br />
4 4B Reddish brown Silty clay<br />
0.3-0.6 Stable<br />
4 4B Reddish brown Silty clay<br />
0.6-1 4 4C Reddish brown Silty clay<br />
Table 2. Grain size distribution <strong>of</strong> the studied soil samples<br />
Sample<br />
Depth<br />
(m)<br />
Medium<br />
Gravel/%<br />
Fine<br />
Gravel %<br />
Coarse<br />
S<strong>and</strong>/%<br />
Medium<br />
S<strong>and</strong>/%<br />
Fine S<strong>and</strong><br />
%<br />
Fines (Clay<br />
<strong>and</strong> Silt)/%<br />
1A 0–0.3 7.0 7.0 19.0 27.0 14.0 26.0<br />
1B 0.3–0.6 2.0 4.0 20.0 37.0 14.0 23.0<br />
1C 0.6–1.0 1.0 1.5 17.5 38.0 20.0 22.0<br />
2A 0–0.3 0.1 0.1 16.9 42.0 17.0 23.9<br />
2B 0.3–0.6 0.1 0.1 20.8 45.0 13.0 21.0<br />
2C 0.6–1.0 0 0 12.5 40.0 10.5 37.0<br />
3A 0–0.3 3.0 2.0 19.5 39.5 13.0 23.0<br />
3B 0.3–0.6 0.1 1.9 16.0 33.5 10.5 37.0<br />
3C 0.6–1.0 0 0.1 15.9 30.5 8.5 45.0<br />
4A 0–0.3 2.0 1.5 17.5 41.5 13.5 24.0<br />
4B 0.3–0.6 0 0 21.0 27.0 14.5 37.5<br />
4C 0.6–1.0 0 0 15.0 29.5 9.5 46.0<br />
<strong>RMZ</strong>-M&G 2011, 58
Integrated geophysical <strong>and</strong> geotechnical investigation <strong>of</strong> the failed portion ...<br />
Table 3. Atterberg Limit result <strong>of</strong> the clay fraction <strong>of</strong> the recovered samples<br />
Sample Depth (m)<br />
According to the American Association<br />
<strong>of</strong> State Highway <strong>and</strong> Transportation<br />
Official (AASHTO) classification<br />
system, samples from failed<br />
portions, samples 1A,1B <strong>and</strong> 1C fell<br />
into A-2-6, A-2-6 <strong>and</strong> A-2-4 groups<br />
which are excellent to good materials<br />
for sub-grade soil in rating, while<br />
samples 3A, 3B <strong>and</strong> 3C <strong>of</strong> the fairly<br />
failed portions fell into A-2-4, A-7-6,<br />
<strong>and</strong> A-7-6 groups which corresponds<br />
to excellent to good <strong>and</strong> fair to poor<br />
soils respectively for sub-grade material.<br />
Also, samples 4A, 4B <strong>and</strong> 4C <strong>of</strong><br />
the stable portion <strong>of</strong> the road fell into<br />
A-2-6, A-6 <strong>and</strong> A-4 groups which<br />
corresponds to excellent to good <strong>and</strong><br />
fair to poor soils respectively. Samples<br />
2A, 2B <strong>and</strong> 2C fell into A-2-4,<br />
A-2-4 <strong>and</strong> A-7-6 groups <strong>and</strong> also correspond<br />
to excellent to good <strong>and</strong> fair<br />
to good soils respectively for subgrade<br />
materials.<br />
<strong>RMZ</strong>-M&G 2011, 58<br />
Road<br />
Condition<br />
Liquid<br />
Limit (%)<br />
Plastic limit<br />
(%)<br />
Plasticity<br />
Index<br />
Linear<br />
Shrinkage<br />
1A 0–0.3<br />
27.0 15.6 11.4 6.4<br />
1B 0.3–0.6 Failed 26.8 15.0 11.3 7.8<br />
1C 0.6–1.0 24.0 14.7 9.3 6.4<br />
2A<br />
2B<br />
2C<br />
0–0.3<br />
0.3–0.6<br />
0.6–1.0<br />
Fairly<br />
Stable<br />
24.0<br />
26.0<br />
50.0<br />
16.1<br />
18.5<br />
29.4<br />
7.9<br />
7.5<br />
20.6<br />
2.1<br />
5.7<br />
12.9<br />
3A<br />
3B<br />
3C<br />
0–0.3<br />
0.3–0.6<br />
0.6–1.0<br />
Fairly<br />
Failed<br />
24.0<br />
48.5<br />
56.0<br />
13.7<br />
21.1<br />
26.2<br />
10.3<br />
27.4<br />
29.8<br />
2.1<br />
9.3<br />
12.1<br />
4A 0–0.3<br />
26.0 13.1 12.9 2.1<br />
4B 0.3–0.6 Stable 36.0 17.7 18.3 8.6<br />
4C 0.6–1.0 51.0 25.3 25.7 10.4<br />
155<br />
Table 3 presents the plastic limit test results,<br />
the range <strong>and</strong> mean values range<br />
from 14.7–15.6 % <strong>and</strong> 15.1 %; 13.7–<br />
26.2 % <strong>and</strong> 20.3 %; 16.1–29.4 % <strong>and</strong><br />
21.3 % <strong>and</strong> 13.1–25.3 % <strong>and</strong> 18.7 %<br />
at the failed, fairly failed, fairly stable<br />
<strong>and</strong> stable portions respectively. The<br />
respective plasticity indexes which is<br />
the difference between the liquid limits<br />
<strong>and</strong> plastic limits range <strong>and</strong> mean<br />
<strong>of</strong> 9.3–11.4 % <strong>and</strong> 10.7 % respectively<br />
for failed portion, 10.3–29.8 % <strong>and</strong><br />
22.5 % respectively for fairly failed<br />
portion, 7.5–20.6 % <strong>and</strong> 12.0 % respectively<br />
for fairly stable portion <strong>and</strong><br />
12.9–25.7 % <strong>and</strong> 19.0 % respectively<br />
for stable portion.<br />
Linear Shrinkage<br />
The linear shrinkage at the failed,<br />
fairly failed, fairly stable <strong>and</strong> stable<br />
portions have range <strong>and</strong> mean <strong>of</strong><br />
6.4–7.8 % <strong>and</strong> 6.9 %; 2.1–12.1 % <strong>and</strong>
156 oSinowo, o. o., akanji, o. a., akinMoSin a.<br />
7.8 %; 2.1–12.9 % <strong>and</strong> 6.9 %, <strong>and</strong><br />
2.1–10.7 % <strong>and</strong> 7.1 % respectively.<br />
Madedor (1983) <strong>and</strong> adeyeMi (1992)<br />
gave the maximum value <strong>of</strong> 8 % as<br />
linear Shrinkage for highway subbase<br />
materials <strong>and</strong> maximum <strong>of</strong> 10 %<br />
was specified for sub-grade materials.<br />
It can therefore be concluded that at<br />
the failed portions the liquid limits,<br />
plasticity index <strong>and</strong> linear shrinkage<br />
for samples 1A, 1B <strong>and</strong> 1C satisfied<br />
all the required st<strong>and</strong>ards for highway<br />
sub-base <strong>and</strong> while at the fairly failed<br />
portion sample 3A satisfied all the require<br />
st<strong>and</strong>ards for sub-base materials,<br />
but samples 3B <strong>and</strong> BC failed the requirements<br />
for sub-grade material. At<br />
the stable portions, samples 4A <strong>and</strong><br />
4B satisfied the required st<strong>and</strong>ard by<br />
FMWH (2000) for sub-base <strong>and</strong> subgrade<br />
soils respectively while samples<br />
4C has slightly higher liquid <strong>and</strong> plasticity<br />
index. At the fairly stable portion,<br />
samples 2A <strong>and</strong> 2B also satisfied<br />
the requirements for sub-base <strong>and</strong> subgrade<br />
materials for highways but samples<br />
2C has slightly higher liquid <strong>and</strong><br />
linear shrinkage values.<br />
From the Casagr<strong>and</strong>e chart (Figure 7),<br />
the classification <strong>of</strong> the soil samples 1A,<br />
1B, 1C, 3A, 2A, 2B <strong>and</strong> 4A plotted within<br />
the region <strong>of</strong> low plasticity while samples<br />
2C, 3B, <strong>and</strong> 4B, 4C plotted within<br />
Figure 7. Casagr<strong>and</strong>e Chart Classification <strong>of</strong> studied samples<br />
<strong>RMZ</strong>-M&G 2011, 58
Integrated geophysical <strong>and</strong> geotechnical investigation <strong>of</strong> the failed portion ...<br />
region <strong>of</strong> medium plasticity. Sample 3C<br />
plotted completely within region <strong>of</strong> high<br />
plasticity. The result indicates that samples<br />
1A, 1B <strong>and</strong>1C (<strong>of</strong> failed portion)<br />
2A, 2B (<strong>of</strong> fairly stable portion), 3A (<strong>of</strong><br />
fairly failed portion) 4A, 4B <strong>and</strong> 4C (<strong>of</strong><br />
the stable portion) are good sub-base<br />
<strong>and</strong> sub-grade materials while samples<br />
3C <strong>of</strong> fairly failed portion is unsuitable<br />
for sub-grade material.<br />
California Bearing Ratio Strength<br />
The dry density <strong>of</strong> the soils <strong>and</strong> optimum<br />
moisture content <strong>of</strong> the soils<br />
<strong>RMZ</strong>-M&G 2011, 58<br />
157<br />
compacted at the modified AASHTO<br />
is shown in the Table 4. It shows percentage<br />
reduction in strength as a result<br />
<strong>of</strong> soaking <strong>of</strong> the compacted samples<br />
<strong>and</strong> it ranges between 55–83 %.<br />
Figures 8 (a–e) present the unsoaked<br />
<strong>and</strong> soaked CBR curves <strong>of</strong> the studied<br />
samples. Most <strong>of</strong> the analyzed samples<br />
have the required 80 % unsoaked<br />
CBR value recommended for highway<br />
sub-base <strong>and</strong> sub-grade soils by the<br />
FMWH (2000) but only sample 1B<br />
satisfied the required unsoaked CBR<br />
value <strong>of</strong> 30 %.<br />
Table 4. Maximum dry density <strong>and</strong> optimum moisture content <strong>of</strong> the samples compacted<br />
at the modified AASHTO level.<br />
Sample Depth (m) Road condition<br />
Maximum dry<br />
density (kg/m )<br />
1B 0.3–0.6<br />
1970 10.95<br />
Failed<br />
1C 0.6–1.0 1910 10.6<br />
3B 0.3–0.6 Fairly failed 1730 12.4<br />
4B 0.3–0.6<br />
1830 12.0<br />
Stable<br />
4C 0.6–1.0 1780 14.0<br />
Table 5. CBR result<br />
Optimum moisture content (%)<br />
Sample unsoaked CBR (%) Soaked CBR (%) Percentage Reduction in strength (%)<br />
1B 71.3 31.6 55.68022<br />
1C 83.9 15.3 81.764<br />
3B 76.7 12.9 83.18123<br />
4B 70.3 19 72.97297<br />
4C 77.6 17 78.09278
158 oSinowo, o. o., akanji, o. a., akinMoSin a.<br />
Discussion<br />
Figure 8. California bearing ratio <strong>of</strong> the studied soils compacted at the<br />
optimum moisture content <strong>of</strong> the modified AASHTO<br />
The geophysical investigation results<br />
gave horizontal variation in<br />
conductivity <strong>of</strong> the subsurface materials<br />
underlying the flexible highway<br />
pavement at different portions<br />
in view <strong>of</strong> ascertaining geophysical<br />
bases if any for the causes <strong>of</strong> the<br />
highway failure. The interpretation<br />
<strong>of</strong> the plots <strong>of</strong> real <strong>and</strong> filtered real<br />
curves <strong>of</strong> the geophysical survey<br />
showed that majority <strong>of</strong> the identified<br />
major <strong>and</strong> minor linear features<br />
which represent zones <strong>of</strong> anoma-<br />
lously high conductivity were detected<br />
at the intensely failed portions<br />
<strong>of</strong> the road. These features are<br />
suspected to be numerous fractures<br />
in the underlying basement rocks<br />
<strong>and</strong> hence, conductive discontinuity<br />
in the shallow overburden.<br />
The geotechnical analysis <strong>of</strong> the<br />
twelve bulk soil samples collected<br />
at different portions <strong>of</strong> the highway<br />
helped determined the variation in engineering<br />
index properties <strong>of</strong> the subbase<br />
<strong>and</strong> sub-grade soils. Geotechnical<br />
results revealed that the sub-base<br />
<strong>RMZ</strong>-M&G 2011, 58
Integrated geophysical <strong>and</strong> geotechnical investigation <strong>of</strong> the failed portion ...<br />
<strong>and</strong> sub-grade soils in the depth range<br />
<strong>of</strong> 0-1.0m <strong>of</strong> the failed portions satisfied<br />
all the requirements <strong>of</strong> liquid limits,<br />
plasticity index, linear shrinkage,<br />
grain size distribution characteristics<br />
specified by the Federal Ministry <strong>of</strong><br />
Works <strong>and</strong> Housing. These soils also<br />
plot within the region <strong>of</strong> low plasticity<br />
on Casagr<strong>and</strong>e chart classification<br />
<strong>and</strong> under AASHTO classification<br />
into groups A-2-6, A-2-6 <strong>and</strong> A-2-4<br />
which indicate that the soils are excellent<br />
to good materials for subgrade<br />
soils.<br />
In terms <strong>of</strong> shear strength most <strong>of</strong><br />
the analyzed samples have adequate<br />
values <strong>of</strong> unsoaked CBR. However,<br />
they suffered very high reduction in<br />
shear strength <strong>of</strong> up to 80 % in soaked<br />
condition. The numerous major <strong>and</strong><br />
minor linear fractures mapped in the<br />
shallow basement as delineated by<br />
VLF – EM methods have tendency to<br />
increased the permeability <strong>of</strong> the portion<br />
<strong>and</strong> thus cause the it to be highly<br />
saturated. This is evident in high current<br />
density <strong>and</strong> low resistivity values<br />
associated with the failed region. This<br />
has particularly made the excellent to<br />
good sub-base <strong>and</strong> sub-grade materials<br />
to perpetually remain in soaked<br />
condition. The geotechnical implication<br />
<strong>of</strong> this is that the highway pavement<br />
is resting on sub-grade, sub-base<br />
<strong>and</strong> foundation materials that lost as<br />
high as 80 % <strong>of</strong> shear strength as a<br />
result <strong>of</strong> ingress <strong>of</strong> water.<br />
<strong>RMZ</strong>-M&G 2011, 58<br />
Conclusion<br />
159<br />
Both geophysical <strong>and</strong> geotechnical investigation<br />
methods have been used<br />
to characterize different portions <strong>of</strong><br />
the flexible highway in the study area.<br />
The highway was reported to always<br />
fail barely six months after reconstruction.<br />
Geophysical investigation delineated<br />
numerous anomalously high current<br />
density <strong>and</strong> low resistivity zones<br />
as well as identified some major <strong>and</strong><br />
minor linear fractures in the shallow<br />
underlying basement rocks. Also, the<br />
geotechnical investigations although<br />
showed that the samples collected generally<br />
displayed excellent to good engineering<br />
index properties as sub-base<br />
<strong>and</strong> sub-grade materials, but suffers up<br />
to 80 % reduction in strength with wetness.<br />
The interaction <strong>of</strong> the sub-grade<br />
<strong>and</strong> sub-base soils with water from numerous<br />
fractures in the basement rocks<br />
has greatly reduced shear strengths <strong>and</strong><br />
therefore incessant failure <strong>of</strong> the overlying<br />
pavement.<br />
Removal <strong>and</strong> replacement <strong>of</strong> the subgrade<br />
<strong>and</strong> sub-base materials upon<br />
which the flexible pavement rests (up to<br />
1 m) or soil stabilization / treatment that<br />
would improve materials shear strength<br />
under wet condition is suggested as<br />
well as construction <strong>of</strong> proper drainage<br />
system to drain the whole length <strong>of</strong> the<br />
road. This will address consistent highway<br />
pavement failure associated with<br />
Erunwon – Ijebu-Ode road.
160 oSinowo, o. o., akanji, o. a., akinMoSin a.<br />
References<br />
adeyeMi, G. O. (1992): Highway geotechnical<br />
properties <strong>of</strong> lateritized<br />
residual soils in the Ajebo-Ishara<br />
geological transition zone <strong>of</strong><br />
southwestern Nigeria. Ph. D thesis.<br />
Obafemi Awolowo University,<br />
Ile-Ife, Nigeria. 357 pp.<br />
American Association <strong>of</strong> State Highways<br />
<strong>and</strong> Transport Officials, Mi145.<br />
Classification <strong>of</strong> Soil <strong>and</strong> aggregate<br />
mixtures <strong>of</strong> highway for construction<br />
purpose, highway materials,<br />
Vol. 1.1.<br />
cHoUTeaU, M., ZHanG, P., cHaPellier, d.<br />
(1996): Computation <strong>of</strong> apparent<br />
resistivity pr<strong>of</strong>iles from VLF-EM<br />
data using linear filter. Geophysical<br />
Prospecting, Vol. 44, pp. 215–<br />
212.<br />
deGrooT-Hedlin, c. & conSTaBle, S. c.<br />
(1990): Occam’s inversion to generate<br />
smooth, two-dimensional<br />
models from magnetotelluric data.<br />
Geophysics, Vol. 55, pp. 1613–<br />
1624.<br />
de rooy, c., kaMFUl, M., kolawole, l.<br />
l. & olokUn, a. (1986): Use <strong>of</strong><br />
the Eletromagnetic method for<br />
Groundwater Prospecting in Nigeria.<br />
Paper presented at ate First<br />
Annual Symposium <strong>of</strong> Training<br />
Workshop on Groundwater Resources<br />
in Nigeria. 23 rd –25 th July<br />
1986, Lagos, Nigeria.<br />
DIPROTM Version 4.01 (2001): Processing<br />
<strong>and</strong> interpretation s<strong>of</strong>tware for<br />
electrical resistivity data. Korea<br />
Institute <strong>of</strong> Geoscience <strong>and</strong> Mineral<br />
Resources (KIGAM), Dae-<br />
jeon, South Korea.<br />
Federal Ministry <strong>of</strong> Works <strong>and</strong> Housing<br />
(2000): Specification for roads<br />
<strong>and</strong> bridges, Vol. 2, pp. 137–275.<br />
FraSer, d. C. (1969): Contouring <strong>of</strong> VLF-<br />
EM data. Geophysics, Vol. 34, pp.<br />
958–967.<br />
GHoSH, d. P. (1971): Inverse filter coefficients<br />
for the computation <strong>of</strong><br />
the apparent resistivity st<strong>and</strong>ard<br />
curves for horizontally stratified<br />
earth. Geophysical Prospecting,<br />
Vol. 19, pp. 769–775.<br />
HaZell, j. r. T., GraTcHley, c. r. & Pre-<br />
Sion, a. M. (1988): The location<br />
<strong>of</strong> aquifers in crystalline rocks<br />
<strong>and</strong> Alluvium in Northern Nigeria<br />
using combined Electromagnetic<br />
<strong>and</strong> Resistivity Techniques. Quarterly<br />
Journal <strong>of</strong> Engineering Geology,<br />
Vol. 21, pp. 159–175.<br />
karoUS, M. r., & HjelT, S. e. (1983):<br />
Linear filtering <strong>of</strong> VLF dip-angle<br />
measurements. Geophysical Prospecting,<br />
Vol. 31, pp. 782–794.<br />
karoUS, M. r. & HjelT, S. e. (1977): Determination<br />
<strong>of</strong> apparent current<br />
density from VLF measurements:<br />
Report. Department <strong>of</strong> Geophysics,<br />
University <strong>of</strong> Oulu, Finl<strong>and</strong>,<br />
Contribution, Vol. 89, 19 pp.<br />
koeFoed, O. (1979): Geosounding Principles<br />
1 Resistivity Sounding Measurements,<br />
Elsevier, Amsterdam.<br />
lokE, M. H. (2001): Topographic modelling<br />
in resistivity imaging inversion.<br />
62nd EAGE, Conference &<br />
Technical Exhibition Extended<br />
Abstracts, D-2.<br />
Madedor, A. A. (1983): Pavement design<br />
guidelines <strong>and</strong> practise for differ-<br />
<strong>RMZ</strong>-M&G 2011, 58
Integrated geophysical <strong>and</strong> geotechnical investigation <strong>of</strong> the failed portion ...<br />
ent geological areas in Nigeria. In<br />
Ola, S. A. (Eds): Tropical soils <strong>of</strong><br />
Nigeria in engineering practise, A.<br />
A. Balkema (publishers) Rotterdam,<br />
Netherl<strong>and</strong>, pp. 291–298.<br />
olorUnFeMi, M. o. & MeSida, e. A.<br />
(1987): Engineering geophysics<br />
<strong>and</strong> its application in engineering<br />
site investigation – case study<br />
from Ile-Ife area. The Nigerian<br />
Engineer, Vol. 22, pp. 57–66.<br />
oMaTSola, M. e. & adeGoke, o. S. (1981):<br />
Tectonic evolution <strong>and</strong> stratigraphy<br />
<strong>of</strong> Dahomey basin. Jour. Min.<br />
Geol., Vol. 18, pp. 130–137.<br />
O’NEILL, D. J. & MERRICK, N. P.<br />
(1984): A digital linear filter for<br />
resistivity sounding with generalized<br />
electrode array. Geophys.<br />
Prospect., Vol. 32, pp. 105–123.<br />
orellana, e. & Mooney, H. M. (1966):<br />
Master Tables <strong>and</strong> Curves for<br />
Vertical Electrical Sounding over<br />
Layered Structures. Interientia,<br />
Madrid, Spain.<br />
olayinka, a. i. & oSinowo, o. o.<br />
(2009): Integrated geophysical<br />
<strong>and</strong> satellite imagery mapping<br />
for groundwater assessment<br />
<strong>RMZ</strong>-M&G 2011, 58<br />
161<br />
in a geological transition zone<br />
in south-western Nigeria. SA-<br />
GEEP, Vol. 22, pp. 977–987.<br />
Palacky, G. j., riTSeMa, i. l. & de jonG.<br />
S. J. (1981): Electromagnetic<br />
prospecting for Groundwater in<br />
Precambrian terrains in the Republic<br />
<strong>of</strong> Upper Volta. Geophysical<br />
Prospecting, Vol. 29, 932–<br />
955.<br />
SaSaki, y. (1989): Two-dimensional joint<br />
inversion <strong>of</strong> magnetotelluric <strong>and</strong><br />
dipole-dipole resistivity data.<br />
Geophysics, Vol. 54, pp. 254–262.<br />
SHarMa, P. v. (1997): Environmental <strong>and</strong><br />
Engineering Geophysics, Cambridge<br />
University press, 173 pp.<br />
SUndararajan, n., raMeSHBaBU, v., PraSad,<br />
n. S. & SrinivaS, y. (2006):<br />
VLFPROS- A MATLAB code<br />
for processing <strong>of</strong> VLF-EM data.<br />
Computers & Geosciences, Vol.<br />
32, pp. 1806–1813.<br />
yi, M. j. & kiM, j. H. (1998): Enhancing<br />
the resolving power <strong>of</strong> the least<br />
squres inversion with Active Constraint<br />
Balancing, SEG Exp<strong>and</strong>ed<br />
Abstracts, 68 Annual Meeting,<br />
New Orleans, pp. 485–488.