

Geology of the Shenandoah National Park Region - Csmres Jmu ...
Geology of the Shenandoah National Park Region - Csmres Jmu ...
Geology of the Shenandoah National Park Region - Csmres Jmu ...

You also want an ePaper? Increase the reach of your titles
YUMPU automatically turns print PDFs into web optimized ePapers that Google loves.
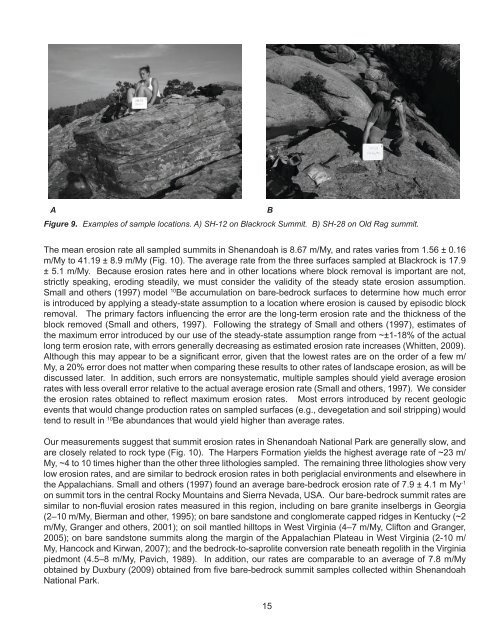
A B<br />
Figure 9. Examples <strong>of</strong> sample locations. A) SH-12 on Blackrock Summit. B) SH-28 on Old Rag summit.<br />
The mean erosion rate all sampled summits in <strong>Shenandoah</strong> is 8.67 m/My, and rates varies from 1.56 ± 0.16<br />
m/My to 41.19 ± 8.9 m/My (Fig. 10). The average rate from <strong>the</strong> three surfaces sampled at Blackrock is 17.9<br />
± 5.1 m/My. Because erosion rates here and in o<strong>the</strong>r locations where block removal is important are not,<br />
strictly speaking, eroding steadily, we must consider <strong>the</strong> validity <strong>of</strong> <strong>the</strong> steady state erosion assumption.<br />
Small and o<strong>the</strong>rs (1997) model 10 Be accumulation on bare-bedrock surfaces to determine how much error<br />
is introduced by applying a steady-state assumption to a location where erosion is caused by episodic block<br />
removal. The primary factors influencing <strong>the</strong> error are <strong>the</strong> long-term erosion rate and <strong>the</strong> thickness <strong>of</strong> <strong>the</strong><br />
block removed (Small and o<strong>the</strong>rs, 1997). Following <strong>the</strong> strategy <strong>of</strong> Small and o<strong>the</strong>rs (1997), estimates <strong>of</strong><br />
<strong>the</strong> maximum error introduced by our use <strong>of</strong> <strong>the</strong> steady-state assumption range from ~±1-18% <strong>of</strong> <strong>the</strong> actual<br />
long term erosion rate, with errors generally decreasing as estimated erosion rate increases (Whitten, 2009).<br />
Although this may appear to be a significant error, given that <strong>the</strong> lowest rates are on <strong>the</strong> order <strong>of</strong> a few m/<br />
My, a 20% error does not matter when comparing <strong>the</strong>se results to o<strong>the</strong>r rates <strong>of</strong> landscape erosion, as will be<br />
discussed later. In addition, such errors are nonsystematic, multiple samples should yield average erosion<br />
rates with less overall error relative to <strong>the</strong> actual average erosion rate (Small and o<strong>the</strong>rs, 1997). We consider<br />
<strong>the</strong> erosion rates obtained to reflect maximum erosion rates. Most errors introduced by recent geologic<br />
events that would change production rates on sampled surfaces (e.g., devegetation and soil stripping) would<br />
tend to result in 10 Be abundances that would yield higher than average rates.<br />
Our measurements suggest that summit erosion rates in <strong>Shenandoah</strong> <strong>National</strong> <strong>Park</strong> are generally slow, and<br />
are closely related to rock type (Fig. 10). The Harpers Formation yields <strong>the</strong> highest average rate <strong>of</strong> ~23 m/<br />
My, ~4 to 10 times higher than <strong>the</strong> o<strong>the</strong>r three lithologies sampled. The remaining three lithologies show very<br />
low erosion rates, and are similar to bedrock erosion rates in both periglacial environments and elsewhere in<br />
<strong>the</strong> Appalachians. Small and o<strong>the</strong>rs (1997) found an average bare-bedrock erosion rate <strong>of</strong> 7.9 ± 4.1 m My -1<br />
on summit tors in <strong>the</strong> central Rocky Mountains and Sierra Nevada, USA. Our bare-bedrock summit rates are<br />
similar to non-fluvial erosion rates measured in this region, including on bare granite inselbergs in Georgia<br />
(2–10 m/My, Bierman and o<strong>the</strong>r, 1995); on bare sandstone and conglomerate capped ridges in Kentucky (~2<br />
m/My, Granger and o<strong>the</strong>rs, 2001); on soil mantled hilltops in West Virginia (4–7 m/My, Clifton and Granger,<br />
2005); on bare sandstone summits along <strong>the</strong> margin <strong>of</strong> <strong>the</strong> Appalachian Plateau in West Virginia (2-10 m/<br />
My, Hancock and Kirwan, 2007); and <strong>the</strong> bedrock-to-saprolite conversion rate beneath regolith in <strong>the</strong> Virginia<br />
piedmont (4.5–8 m/My, Pavich, 1989). In addition, our rates are comparable to an average <strong>of</strong> 7.8 m/My<br />
obtained by Duxbury (2009) obtained from five bare-bedrock summit samples collected within <strong>Shenandoah</strong><br />
<strong>National</strong> <strong>Park</strong>.<br />
15