Performance Drag and the Certainty Measure - State Street Global ...
Performance Drag and the Certainty Measure - State Street Global ...
Performance Drag and the Certainty Measure - State Street Global ...

You also want an ePaper? Increase the reach of your titles
YUMPU automatically turns print PDFs into web optimized ePapers that Google loves.
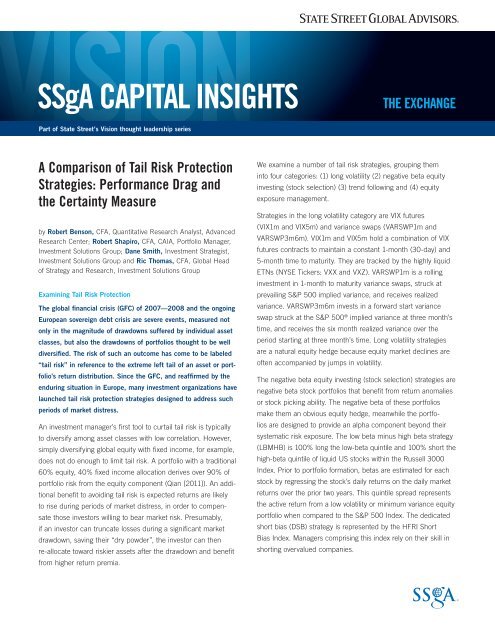
SSgA CAPITAL INSIGHTS THE EXCHANGE<br />
Part of <strong>State</strong> <strong>Street</strong>’s Vision thought leadership series<br />
A Comparison of Tail Risk Protection<br />
Strategies: <strong>Performance</strong> <strong>Drag</strong> <strong>and</strong><br />
<strong>the</strong> <strong>Certainty</strong> <strong>Measure</strong><br />
by Robert Benson, CFA, Quantitative Research Analyst, Advanced<br />
Research Center; Robert Shapiro, CFA, CAIA, Portfolio Manager,<br />
Investment Solutions Group; Dane Smith, Investment Strategist,<br />
Investment Solutions Group <strong>and</strong> Ric Thomas, CFA, <strong>Global</strong> Head<br />
of Strategy <strong>and</strong> Research, Investment Solutions Group<br />
Examining Tail Risk Protection<br />
The global financial crisis (GFC) of 2007—2008 <strong>and</strong> <strong>the</strong> ongoing<br />
European sovereign debt crisis are severe events, measured not<br />
only in <strong>the</strong> magnitude of drawdowns suffered by individual asset<br />
classes, but also <strong>the</strong> drawdowns of portfolios thought to be well<br />
diversified. The risk of such an outcome has come to be labeled<br />
“tail risk” in reference to <strong>the</strong> extreme left tail of an asset or port-<br />
folio’s return distribution. Since <strong>the</strong> GFC, <strong>and</strong> reaffirmed by <strong>the</strong><br />
enduring situation in Europe, many investment organizations have<br />
launched tail risk protection strategies designed to address such<br />
periods of market distress.<br />
An investment manager’s first tool to curtail tail risk is typically<br />
to diversify among asset classes with low correlation. However,<br />
simply diversifying global equity with fixed income, for example,<br />
does not do enough to limit tail risk. A portfolio with a traditional<br />
60% equity, 40% fixed income allocation derives over 90% of<br />
portfolio risk from <strong>the</strong> equity component (Qian [2011]). An addi-<br />
tional benefit to avoiding tail risk is expected returns are likely<br />
to rise during periods of market distress, in order to compen-<br />
sate those investors willing to bear market risk. Presumably,<br />
if an investor can truncate losses during a significant market<br />
drawdown, saving <strong>the</strong>ir “dry powder”, <strong>the</strong> investor can <strong>the</strong>n<br />
re-allocate toward riskier assets after <strong>the</strong> drawdown <strong>and</strong> benefit<br />
from higher return premia.<br />
We examine a number of tail risk strategies, grouping <strong>the</strong>m<br />
into four categories: (1) long volatility (2) negative beta equity<br />
investing (stock selection) (3) trend following <strong>and</strong> (4) equity<br />
exposure management.<br />
Strategies in <strong>the</strong> long volatility category are VIX futures<br />
(VIX1m <strong>and</strong> VIX5m) <strong>and</strong> variance swaps (VARSWP1m <strong>and</strong><br />
VARSWP3m6m). VIX1m <strong>and</strong> VIX5m hold a combination of VIX<br />
futures contracts to maintain a constant 1-month (30-day) <strong>and</strong><br />
5-month time to maturity. They are tracked by <strong>the</strong> highly liquid<br />
ETNs (NYSE Tickers: VXX <strong>and</strong> VXZ). VARSWP1m is a rolling<br />
investment in 1-month to maturity variance swaps, struck at<br />
prevailing S&P 500 implied variance, <strong>and</strong> receives realized<br />
variance. VARSWP3m6m invests in a forward start variance<br />
swap struck at <strong>the</strong> S&P 500 ® implied variance at three month’s<br />
time, <strong>and</strong> receives <strong>the</strong> six month realized variance over <strong>the</strong><br />
period starting at three month’s time. Long volatility strategies<br />
are a natural equity hedge because equity market declines are<br />
often accompanied by jumps in volatility.<br />
The negative beta equity investing (stock selection) strategies are<br />
negative beta stock portfolios that benefit from return anomalies<br />
or stock picking ability. The negative beta of <strong>the</strong>se portfolios<br />
make <strong>the</strong>m an obvious equity hedge, meanwhile <strong>the</strong> portfo-<br />
lios are designed to provide an alpha component beyond <strong>the</strong>ir<br />
systematic risk exposure. The low beta minus high beta strategy<br />
(LBMHB) is 100% long <strong>the</strong> low-beta quintile <strong>and</strong> 100% short <strong>the</strong><br />
high-beta quintile of liquid US stocks within <strong>the</strong> Russell 3000<br />
Index. Prior to portfolio formation, betas are estimated for each<br />
stock by regressing <strong>the</strong> stock’s daily returns on <strong>the</strong> daily market<br />
returns over <strong>the</strong> prior two years. This quintile spread represents<br />
<strong>the</strong> active return from a low volatility or minimum variance equity<br />
portfolio when compared to <strong>the</strong> S&P 500 Index. The dedicated<br />
short bias (DSB) strategy is represented by <strong>the</strong> HFRI Short<br />
Bias Index. Managers comprising this index rely on <strong>the</strong>ir skill in<br />
shorting overvalued companies.
SSgA CAPITAL INSIGHTS | TAIL RISK STRATEGIES<br />
Chart 1: Tail Risk Strategies St<strong>and</strong> Alone <strong>Performance</strong> March 1990—March 2011<br />
Strategy Type Strategy Annual Return Annual Std Dev IR Correlation S&P 500 Beta S&P 500 Correlation VIX<br />
The trend following strategy (MGDFUT) is represented by <strong>the</strong><br />
Barclay’s CTA Index, a composite of managed futures funds.<br />
Commodity trading advisors primarily rely on a trend-following<br />
approach to add value. Fung <strong>and</strong> Hsieh [2001] showed that<br />
trend-following strategies have <strong>the</strong> payoff profile of an option<br />
straddle with higher performance in pronounced market<br />
uptrends <strong>and</strong> downtrends.<br />
The fourth <strong>and</strong> final category, equity exposure management,<br />
comprises strategies that limit equity exposure. The put option<br />
(PUT) strategy purchases one-month to maturity 8.5% out-of-<br />
<strong>the</strong>-money puts on <strong>the</strong> S&P 500 index <strong>and</strong> liquidates one day<br />
prior to expiration. The tactical equity strategy (TACT) invests<br />
in <strong>the</strong> S&P 500 index when it lies above its ten-month moving<br />
average <strong>and</strong> shorts <strong>the</strong> index when it falls below its moving<br />
average. Put options, by design, <strong>and</strong> a tactical equity strategy<br />
with skill at timing when to short, will both pay off during<br />
equity downturns.<br />
S&P 500 9.08 15.11 0.60 1.00 1.00 -0.63<br />
Cash TBILL 3.59 0.59 6.04 0.06 0.00 0.07<br />
Volatility Based VIX1m -45.55 52.86 -0.86 -0.59 -2.07 0.75<br />
Volatility Based VIX5m -5.57 29.93 -0.19 -0.54 -1.07 0.68<br />
Volatility Based VARSWP1m -4.03 7.24 -0.56 -0.34 -0.16 0.41<br />
Volatility Based VARSWP3m6m -0.54 15.96 -0.03 -0.61 -0.64 0.58<br />
Negative Beta LBMHB -0.82 24.26 -0.03 -0.69 -1.10 0.42<br />
Negative Beta DSB -0.53 19.23 -0.03 -0.71 -0.90 0.47<br />
Trend Following MGDFUT 6.34 8.32 0.76 -0.10 -0.06 0.08<br />
Exposure Mgmnt PUT -2.75 4.27 -0.64 -0.55 -0.16 0.44<br />
Exposure Mgmnt TACT 8.62 15.13 0.57 -0.05 -0.05 -0.01<br />
Source: FactSet, St<strong>and</strong>ard & Poors, Bloomberg, Ibbotson Associates, Commodity Systems Inc., Barclays, Hedge Fund Research, Inc.<br />
Past performance is not a guarantee of future results.<br />
Index returns are unmanaged <strong>and</strong> do not reflect <strong>the</strong> deduction of any fees or expenses. Index returns reflect all items of income, gain <strong>and</strong> loss <strong>and</strong> <strong>the</strong> reinvestment of dividends <strong>and</strong> o<strong>the</strong>r income.<br />
Chart 1 summarizes <strong>the</strong> st<strong>and</strong>-alone performance of our<br />
collection of tail risk strategies along with <strong>the</strong> S&P 500 <strong>and</strong> cash<br />
(one-month Treasury Bill) over our sample from March 1990—<br />
March 2011. S&P 500 returns averaged 9.08 percent per year<br />
with 15.11 percent annual risk during this time period. Since <strong>the</strong><br />
equity annual return performance is close to, or even above, its<br />
long term average, <strong>the</strong> period of analysis will not bias our study<br />
toward making tail risk solutions look effective. From Chart 1,<br />
we see that monthly returns to <strong>the</strong> S&P 500 are very negatively<br />
correlated (-0.63) to monthly percent changes in <strong>the</strong> CBOE VIX<br />
index. Most tail risk strategies exhibit negative correlation with<br />
equity returns <strong>and</strong> positive correlations to changes in VIX.<br />
At first glance, <strong>the</strong> collection of tail risk strategies may not<br />
elicit any optimism because of <strong>the</strong>ir low or negative st<strong>and</strong>-<br />
alone annualized returns. However, it is precisely <strong>the</strong>ir ability<br />
to generate a positive payoff in bad times that drives down <strong>the</strong><br />
expected risk premia for tail risk solutions. 1<br />
Before combining each tail risk hedging strategy with an equity<br />
portfolio, we examine historically how each strategy performs<br />
during a tail risk event, defined as a month where <strong>the</strong> S&P 500<br />
declines by 5% or more. Chart 2 reports <strong>the</strong> average return<br />
of <strong>the</strong> tail risk strategies as well as <strong>the</strong> S&P 500 during such<br />
crisis months between March 1990 <strong>and</strong> March 2011. In <strong>the</strong>se<br />
months, <strong>the</strong> average return for <strong>the</strong> S&P 500 is -8.10 percent<br />
while average return to all of <strong>the</strong> tail risk strategies is positive.<br />
Chart 2 also shows excess return to <strong>the</strong> S&P 500 during crisis<br />
months for each strategy <strong>and</strong> represents hedging power.<br />
Chart 2: Tail Risk Hedging Power March 1990—March 2011<br />
TACT<br />
PUT<br />
MGDFUT<br />
DSB<br />
LBMHB<br />
VARSWP3m6m<br />
VARSWP1m<br />
VIX5m<br />
VIX1m<br />
TBILL<br />
n Excess Return<br />
n Average Return<br />
0 5 10 15 20 25<br />
Average Return (S & P < -5%)<br />
Source: FactSet, St<strong>and</strong>ard & Poors, Bloomberg, Ibbotson Associates, Commodity<br />
Systems Inc., Barclays, Hedge Fund Research, Inc.<br />
Past performance is not a guarantee of future results.<br />
2
SSgA CAPITAL INSIGHTS | TAIL RISK STRATEGIES<br />
The two VIX futures strategies have <strong>the</strong> greatest hedging power,<br />
outperforming <strong>the</strong> S&P 500 by 24.7 <strong>and</strong> 19.2 percent. All<br />
strategies have stronger tail risk hedging power than a Cash<br />
allocation (TBILL) which outperforms by 8.3 percent.<br />
We define portfolio tail risk, PTR, as portfolio return during<br />
tail risk event months when <strong>the</strong> S&P 500 loses 5% or greater.<br />
For <strong>the</strong> remainder of our analysis we solve for <strong>the</strong> allocation to<br />
each tail risk strategy that achieves a 20% reduction in portfolio<br />
tail risk. Each combined portfolio has <strong>the</strong> same portfolio tail<br />
risk (PTRj = -6.48%, which is 80% of -8.10%); in this way we<br />
compare tail risk strategies on an equal risk adjusted basis.<br />
The allocation 2 that reduces portfolio tail risk by 20% when<br />
combined with <strong>the</strong> S&P 500 is given in <strong>the</strong> first column of<br />
Chart 3. A fairly modest allocation of 6% to 16% from equities<br />
is needed to achieve 20% tail risk reduction; strategies with <strong>the</strong><br />
greatest hedging power need <strong>the</strong> least allocation.<br />
<strong>Performance</strong> <strong>Drag</strong> <strong>and</strong> <strong>the</strong> <strong>Certainty</strong> <strong>Measure</strong><br />
We introduce our first measure of tail risk efficiency which we<br />
term “performance drag”. <strong>Performance</strong> drag is <strong>the</strong> reduction in<br />
annual return when adopting a tail risk strategy, or <strong>the</strong> cost of<br />
tail risk protection, <strong>and</strong> is shown in Chart 3. As one example,<br />
allocating <strong>the</strong> required 19.4% to Cash <strong>and</strong> <strong>the</strong> remaining 81.6%<br />
to <strong>the</strong> S&P 500 reduces annualized return from 9.08 to 8.19<br />
percent, resulting in a performance drag of 89 basis points.<br />
Several strategies have a lower performance drag than a simple<br />
allocation to cash, <strong>the</strong>se are VIX 5 month futures (65 bps),<br />
forward start variance swaps (68 bps), low beta minus high beta<br />
equity portfolio (32 bps), short bias equity (55 bps) <strong>and</strong> tactical<br />
equity exposure (-25 bps which represents outperformance).<br />
A second way to evaluate <strong>the</strong> effectiveness of a tail risk strategy<br />
is to look at <strong>the</strong> consistency with which it outperforms during<br />
a crisis. We introduce a measure we call certainty of tail risk<br />
protection, abbreviated Ck which we define as <strong>the</strong> conditional<br />
information ratio of tail risk strategy k’s excess return to S&P<br />
500 during a tail risk event (months where <strong>the</strong> S&P 500 falls<br />
more than 5%):<br />
C k = IR[R k – R SP500 | R SP500 < -5%] or (2)<br />
C k = E [R k – R SP500 | R SP500 < -5%] / SD [R k – R SP500 | R SP500 < -5%]<br />
<strong>Certainty</strong> of tail risk protection is summarized in Chart 4 where<br />
we also show <strong>the</strong> mean <strong>and</strong> st<strong>and</strong>ard deviation of excess return<br />
used to calculate <strong>the</strong> conditional IR. The final column in Chart<br />
4 shows <strong>the</strong> frequency with which each strategy had a posi-<br />
tive return in a tail risk event. The high frequency of positive<br />
performance, often approaching 100% of <strong>the</strong> time, validates<br />
<strong>the</strong> inclusion of <strong>the</strong>se strategies in our study. Because tail risk<br />
events are by definition infrequent, we want some degree of<br />
confidence that a tail risk strategy will pay off when needed <strong>and</strong><br />
in a predictable fashion.<br />
Chart 3: <strong>Performance</strong> <strong>Drag</strong> when Adopting Tail Risk Strategy March 1990—March 2011<br />
Strategy Type Strategy Allocation (%)<br />
<strong>Performance</strong><br />
<strong>Drag</strong><br />
Annual<br />
Return<br />
We consider a certainty measure of 1.0 as a reasonable<br />
minimum threshold from a tail risk strategy. All strategies in our<br />
study have a certainty measure above 1.0 with <strong>the</strong> exception<br />
of VIX1m (0.87). Cash (TBILL) is <strong>the</strong> most consistent tail risk<br />
hedge with a 2.94 certainty measure, due to low variation in<br />
T-Bill returns. The VIX based strategies have <strong>the</strong> largest vari-<br />
ability in excess return <strong>and</strong> <strong>the</strong> long volatility strategies fare<br />
<strong>the</strong> worst as a group on our certainty measure. Strategies that<br />
provide highly consistent protection are <strong>the</strong> two negative beta<br />
equity (stock selection) strategies <strong>and</strong> managed futures, all of<br />
which feature certainty measures above 2.0.<br />
Portfolio <strong>Performance</strong> Reduction in Risk <strong>Measure</strong>s<br />
Annual<br />
Std Dev IR<br />
Annual<br />
Std Dev (%)<br />
Maximum<br />
Drawdown (%)<br />
PTR: Avg Rtn<br />
(S&P
SSgA CAPITAL INSIGHTS | TAIL RISK STRATEGIES<br />
Chart 4: <strong>Certainty</strong> of Tail Risk Strategy Protection March 1990—March 2011<br />
Strategy Type Strategy <strong>Certainty</strong> <strong>Measure</strong> Average Excess Return Std Dev Excess Return Positive Returns (%)<br />
Cash TBILL 2.94 8.34 2.84 100<br />
Volatility Based VIX1m 0.87 24.67 28.39 83<br />
Volatility Based VIX5m 1.50 19.19 12.75 100<br />
Volatility Based VARSWP1m 1.34 9.69 7.25 54<br />
Volatility Based VARSWP3m6m 1.50 14.97 9.95 100<br />
Negative Beta LBMHB 2.25 18.88 8.38 88<br />
Negative Beta DSB 2.42 15.11 6.24 96<br />
Trend Following MGDFUT 2.19 9.83 4.49 67<br />
Exposure Mgmnt PUT 1.96 9.67 4.94 79<br />
Exposure Mgmnt TACT 1.32 11.75 8.92 71<br />
Source: FactSet, St<strong>and</strong>ard & Poors, Bloomberg, Ibbotson Associates, Commodity Systems Inc., Barclays, Hedge Fund Research, Inc.<br />
Past performance is not a guarantee of future results.<br />
Index returns are unmanaged <strong>and</strong> do not reflect <strong>the</strong> deduction of any fees or expenses. Index returns reflect all items of income, gain <strong>and</strong> loss <strong>and</strong> <strong>the</strong> reinvestment of dividends <strong>and</strong> o<strong>the</strong>r income.<br />
Conclusion<br />
The ideal tail risk strategy has low performance drag <strong>and</strong> high<br />
certainty of protection. Chart 5 displays each tail risk strategy<br />
along <strong>the</strong>se two dimensions where strategies to <strong>the</strong> upper left<br />
are preferred.<br />
It is clear from Chart 5 that three tail risk strategies are<br />
dominated by <strong>the</strong> o<strong>the</strong>rs. These inferior strategies are put<br />
options, VIX one month futures, <strong>and</strong> one month variance<br />
swaps; <strong>the</strong>y have proved too costly <strong>and</strong> variable in <strong>the</strong>ir hedging<br />
ability. Several strategies remain that meet our two criteria of<br />
a certainty measure above 1.0 <strong>and</strong> a performance drag lower<br />
than Cash. The strategies contained in <strong>the</strong> shaded region appear<br />
to be historically viable choices for managing tail risk. Of <strong>the</strong>se,<br />
three strategies st<strong>and</strong> out as providing highly consistent <strong>and</strong><br />
low cost tail risk protection; <strong>the</strong>se are dedicated short bias,<br />
managed futures <strong>and</strong> <strong>the</strong> low beta minus high beta portfolio.<br />
Modest allocations to a h<strong>and</strong>ful of tail risk protection strategies<br />
may significantly improve portfolio performance in times of<br />
tail risk events. Protecting against tail events can help improve<br />
long-term performance for even well diversified investors<br />
seeking to capture premia from risky assets. Protection during<br />
periods of market distress allows managers to reallocate to<br />
riskier assets in <strong>the</strong> aftermath of <strong>the</strong> event, just when expected<br />
returns are <strong>the</strong> highest.<br />
We would like to thank <strong>and</strong> acknowledge Christian Blanke of<br />
SSARIS, LLC for providing numerical analysis of options data <strong>and</strong><br />
Mark Hooker <strong>and</strong> Angelo Lobosco of <strong>State</strong> <strong>Street</strong> <strong>Global</strong> Advisors<br />
for comments <strong>and</strong> suggestions for revisions of this paper.<br />
Chart 5: Tradeoff of Annual <strong>Performance</strong> <strong>Drag</strong> versus <strong>Certainty</strong><br />
of Protection March 1990—March 2011<br />
<strong>Certainty</strong> Ratio<br />
3.5<br />
3.0<br />
2.5<br />
2.0<br />
1.5<br />
1.0<br />
0.5<br />
TACT<br />
TBILL<br />
DSB<br />
LBMGB<br />
MGDFUT<br />
VIX5m<br />
VARSWP3m6m<br />
VARSWP1m<br />
PUT<br />
VIX1m<br />
-100 0 100 200 300 400<br />
<strong>Performance</strong> <strong>Drag</strong> in bps<br />
Source: FactSet, St<strong>and</strong>ard & Poors, Bloomberg, Ibbotson Associates, Commodity<br />
Systems Inc., Barclays, Hedge Fund Research, Inc.<br />
Past performance is not a guarantee of future results.<br />
4
SSgA CAPITAL INSIGHTS | TAIL RISK STRATEGIES<br />
References<br />
Asness, Clifford, Robert Krail, John Liew. “Do hedge funds hedge?” The Journal of<br />
Portfolio Management, Fall 2001, pp. 6–19.<br />
Davis, Josh, <strong>and</strong> Vineer Bhansali. “Offensive Risk Management: Can Tail Risk Hedging<br />
Be Profitable?” Working Paper. February 2010.<br />
Faber, Mebane T. “ A Quantitative Approach to Tactical Asset Allocation.” The Journal<br />
of Wealth Management. Spring 2007, pp. 69–79.<br />
Fama, Eugene. “The Behavior of Stock Market Prices,” Journal of Business, 38, 1965,<br />
pp 34–105.<br />
Fama, E., <strong>and</strong> K. French. “Business Conditions <strong>and</strong> Expected Returns on Stocks <strong>and</strong><br />
Bonds.” Journal of Financial Economics, 25, 1989, pp. 23-49.<br />
Fung, W.K.H., <strong>and</strong> D.A. Hsieh. “The Risk in Hedge Funds Strategies: Theory <strong>and</strong><br />
Evidence from Trend Followers.” Review of Financial Studies, 14 (2001), pp. 313–341.<br />
SSgA <strong>Global</strong> Entities<br />
Australia: <strong>State</strong> <strong>Street</strong> <strong>Global</strong> Advisors, Australia, Limited (ABN 42 003 914 225) is <strong>the</strong> holder of an Australian Financial Services Licence (AFSL Number 238276). Registered office: Level 17, 420 George<br />
<strong>Street</strong>, Sydney, NSW 2000, Australia Telephone: +612 9240-7600 • Facsimile: +612 9240-7611. Belgium: <strong>State</strong> <strong>Street</strong> <strong>Global</strong> Advisors Belgium, Office Park Nysdam, 92 Avenue Reine Astrid, B-1310<br />
La Hulpe, Belgium. Telephone: 32 2 663 2036 • Facsimile: 32 2 672 2077. Belgium is a branch of <strong>State</strong> <strong>Street</strong> <strong>Global</strong> Advisors Limited. Canada: <strong>State</strong> <strong>Street</strong> <strong>Global</strong> Advisors, Ltd., 770 Sherbrooke<br />
<strong>Street</strong> West Suite 1200, Montreal, Quebec H3A 1G1 Canada <strong>and</strong> 30 Adelaide <strong>Street</strong> East, Suite 500, Toronto, Ontario, M5C 3G6 Canada. Dubai: <strong>State</strong> <strong>Street</strong> Bank <strong>and</strong> Trust Company (Representative<br />
Office), Suite 404 4th Floor, Building 4, Emaar Square, Dubai, United Arab Emirates. Telephone: +971 (0)4-4372800 • Facsimile: +971 (0)4-4372818. France: <strong>State</strong> <strong>Street</strong> <strong>Global</strong> Advisors France.<br />
Authorised <strong>and</strong> regulated by <strong>the</strong> Autorité des Marchés Financiers. Registered with <strong>the</strong> Register of Commerce <strong>and</strong> Companies of Nanterre under <strong>the</strong> number 412 052 680. Registered office: Immeuble<br />
Défense Plaza, 23-25 rue Delarivière-Lefoullon, 92064 Paris La Défense Cedex, France. Telephone: (+33) 1 44 45 40 00 • Facsimile: (+33) 1 44 45 41 92. Germany: <strong>State</strong> <strong>Street</strong> <strong>Global</strong> Advisors GmbH,<br />
Brienner Strasse 59, D-80333 Munich. Telephone +49 (0)89-55878-400 • Facsimile +49 (0)89-55878-440. Hong Kong: <strong>State</strong> <strong>Street</strong> <strong>Global</strong> Advisors Asia Limited, 68/F, Two International Finance<br />
Centre, 8 Finance <strong>Street</strong>, Central, Hong Kong • Telephone: +852 2103-0288 • Facsimile: +852 2103-0200. Japan: <strong>State</strong> <strong>Street</strong> <strong>Global</strong> Advisors, Japan, 9-7-1 Akasaka, Minato-ku, Tokyo Telephone +813<br />
4530 7380. Financial Instruments Business Operator, Kanto Local Financial Bureau (Kinsho #345). Japan Securities Investment Advisers Association, Investment Trust Association, Japan Securities<br />
Dealers’ Association. Irel<strong>and</strong>: <strong>State</strong> <strong>Street</strong> <strong>Global</strong> Advisors Irel<strong>and</strong> Limited is regulated by <strong>the</strong> Central Bank of Irel<strong>and</strong>. Incorporated <strong>and</strong> registered in Irel<strong>and</strong> at Two Park Place, Upper Hatch <strong>Street</strong>,<br />
Dublin 2. Registered number 145221. Member of <strong>the</strong> Irish Association of Investment Managers. Italy: <strong>State</strong> <strong>Street</strong> <strong>Global</strong> Advisors Ltd., Sede Secondaria di Milano - Via dei Bossi, 4 20121 Milan,<br />
Italy. Telephone: +39 02 32066 100 • Facsimile: +39 02 32066 155. Ne<strong>the</strong>rl<strong>and</strong>s: <strong>State</strong> <strong>Street</strong> <strong>Global</strong> Advisors Ne<strong>the</strong>rl<strong>and</strong>s, Adam Smith Building, Thomas Malthusstraat 1-3, 1066 JR Amsterdam,<br />
Ne<strong>the</strong>rl<strong>and</strong>s. Telephone: 31 20 7085600 • Facsimile 31 20 7085601, SSgA Ne<strong>the</strong>rl<strong>and</strong>s is a branch of <strong>State</strong> <strong>Street</strong> <strong>Global</strong> Advisors Limited. Singapore: <strong>State</strong> <strong>Street</strong> <strong>Global</strong> Advisors Singapore Limited,<br />
168, Robinson Road, #33-01 Capital Tower, Singapore 068912 (Company Reg. No: 200002719D), Telephone: +65 6826-7500 • Facsimile: +65 6826-7501. Switzerl<strong>and</strong>: <strong>State</strong> <strong>Street</strong> <strong>Global</strong> Advisors<br />
AG, Beethovenstr. 19, CH-8027 Zurich. Telephone +41 (0)44 245 70 00 • Facsimile +41 (0)44 245 70 16. United Kingdom: <strong>State</strong> <strong>Street</strong> <strong>Global</strong> Advisors Limited. Authorised <strong>and</strong> regulated by <strong>the</strong><br />
Financial Services Authority. Registered in Engl<strong>and</strong>. Registered No. 2509928. VAT No. 5776591 81. Registered office: 20 Churchill Place, Canary Wharf, London, E14 5HJ. Telephone: 020 3395 6000<br />
• Facsimile: 020 3395 6350. United <strong>State</strong>s: <strong>State</strong> <strong>Street</strong> <strong>Global</strong> Advisors, One Lincoln <strong>Street</strong>, Boston, MA 02111-2900.<br />
Web: www.ssga.com<br />
The views expressed in this material are <strong>the</strong> views of <strong>the</strong> SSgA Alternative Investments team through <strong>the</strong> period ended June 05, 2012 <strong>and</strong> are subject to change based on market <strong>and</strong> o<strong>the</strong>r conditions.<br />
The information provided does not constitute investment advice <strong>and</strong> it should not be relied on as such. All material has been obtained from sources believed to be reliable, but its accuracy is<br />
not guaranteed. This document contains certain statements that may be deemed forward-looking statements. Please note that any such statements are not guarantees of any future performance<br />
<strong>and</strong> actual results or developments may differ materially from those projected. Past performance is not a guarantee of future results.<br />
Investing involves risk including <strong>the</strong> risk of loss of principal.<br />
Diversification does not ensure a profit or guarantee against loss.<br />
Options investing entail a high degree of risk <strong>and</strong> may not be appropriate for all investors.<br />
There are a number of risks associated with futures investing including but not limited to counterparty credit risk, currency risk, derivatives risk, foreign issuer exposure risk, sector concentration<br />
risk, leveraging <strong>and</strong> liquidity risks.<br />
Risk associated with equity investing include stock values which may fluctuate in response to <strong>the</strong> activities of individual companies <strong>and</strong> general market <strong>and</strong> economic conditions.<br />
St<strong>and</strong>ard & Poor’s (S&P) S&P Indices are a registered trademark of St<strong>and</strong>ard & Poor’s Financial Services LLC.<br />
Source: Barclays Capital POINT/<strong>Global</strong> Family of Indices. ©2012 Barclays Capital Inc. Used with permission.<br />
Russell Investment Group is <strong>the</strong> source <strong>and</strong> owner of <strong>the</strong> trademarks, service marks <strong>and</strong> copyrights related to <strong>the</strong> Russell Indexes. Russell 3000 Index ® is a trademark of Russell Investment Group.<br />
© 2012 STATE STREET CORPORATION ID1424-INST-3432 0812 Exp. Date: 8/31/2013<br />
Ilmanen, Antti. “Expected Returns: An Investor’s Guide to Harvesting Market<br />
Rewards.” John Wiley & Sons Ltd. 2011.<br />
Kelly, B. “Tail Risk <strong>and</strong> Asset Prices.” Chicago Booth Working paper No. 11–17.<br />
Fama-Miller Paper Series. 2011.<br />
Qian, Edward. “Risk Parity <strong>and</strong> Diversification.” The Journal of Investing. Spring 2011,<br />
pp. 119–127.<br />
1 The required risk premium for any asset reflects its covariation with bad times.<br />
(Ilmanen 2011 p. 69)<br />
2 For <strong>the</strong> put option strategy, we chose <strong>the</strong> 8.5 percent out of <strong>the</strong> money options as<br />
<strong>the</strong> strike that exactly achieves 20% portfolio tail risk reduction. Its allocation is given<br />
as 100% <strong>and</strong> can be considered an overlay to an S&P 500 index investment.<br />
5