Adding Value in Emerging Markets Equities - State Street Global ...
Adding Value in Emerging Markets Equities - State Street Global ...
Adding Value in Emerging Markets Equities - State Street Global ...

Create successful ePaper yourself
Turn your PDF publications into a flip-book with our unique Google optimized e-Paper software.
SSgA CAPITAL INSIGHTS THE EXCHANGE<br />
Part of <strong>State</strong> <strong>Street</strong>’s Vision thought leadership series<br />
<strong>Add<strong>in</strong>g</strong> <strong>Value</strong> <strong>in</strong><br />
Emerg<strong>in</strong>g <strong>Markets</strong> <strong>Equities</strong><br />
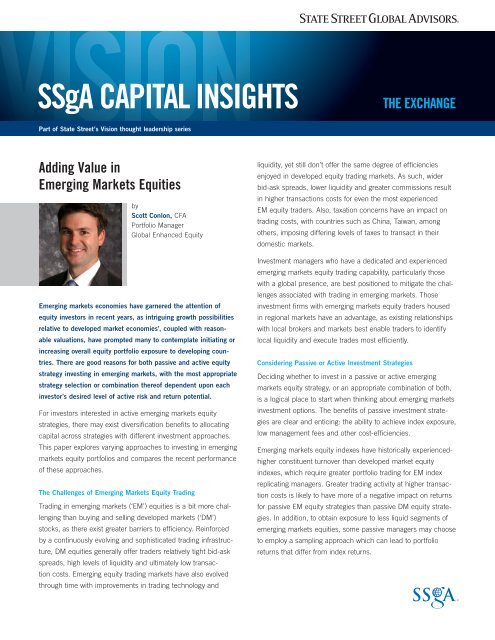
Emerg<strong>in</strong>g markets economies have garnered the attention of<br />
equity <strong>in</strong>vestors <strong>in</strong> recent years, as <strong>in</strong>trigu<strong>in</strong>g growth possibilities<br />
relative to developed market economies’, coupled with reason-<br />
able valuations, have prompted many to contemplate <strong>in</strong>itiat<strong>in</strong>g or<br />
<strong>in</strong>creas<strong>in</strong>g overall equity portfolio exposure to develop<strong>in</strong>g coun-<br />
tries. There are good reasons for both passive and active equity<br />
strategy <strong>in</strong>vest<strong>in</strong>g <strong>in</strong> emerg<strong>in</strong>g markets, with the most appropriate<br />
strategy selection or comb<strong>in</strong>ation thereof dependent upon each<br />
<strong>in</strong>vestor’s desired level of active risk and return potential.<br />
For <strong>in</strong>vestors <strong>in</strong>terested <strong>in</strong> active emerg<strong>in</strong>g markets equity<br />
strategies, there may exist diversification benefits to allocat<strong>in</strong>g<br />
capital across strategies with different <strong>in</strong>vestment approaches.<br />
This paper explores vary<strong>in</strong>g approaches to <strong>in</strong>vest<strong>in</strong>g <strong>in</strong> emerg<strong>in</strong>g<br />
markets equity portfolios and compares the recent performance<br />
of these approaches.<br />
by<br />
Scott Conlon, CFA<br />
Portfolio Manager<br />
<strong>Global</strong> Enhanced Equity<br />
The Challenges of Emerg<strong>in</strong>g <strong>Markets</strong> Equity Trad<strong>in</strong>g<br />
Trad<strong>in</strong>g <strong>in</strong> emerg<strong>in</strong>g markets (‘EM’) equities is a bit more chal-<br />
leng<strong>in</strong>g than buy<strong>in</strong>g and sell<strong>in</strong>g developed markets (‘DM’)<br />
stocks, as there exist greater barriers to efficiency. Re<strong>in</strong>forced<br />
by a cont<strong>in</strong>uously evolv<strong>in</strong>g and sophisticated trad<strong>in</strong>g <strong>in</strong>frastruc-<br />
ture, DM equities generally offer traders relatively tight bid-ask<br />
spreads, high levels of liquidity and ultimately low transac-<br />
tion costs. Emerg<strong>in</strong>g equity trad<strong>in</strong>g markets have also evolved<br />
through time with improvements <strong>in</strong> trad<strong>in</strong>g technology and<br />
liquidity, yet still don’t offer the same degree of efficiencies<br />
enjoyed <strong>in</strong> developed equity trad<strong>in</strong>g markets. As such, wider<br />
bid-ask spreads, lower liquidity and greater commissions result<br />
<strong>in</strong> higher transactions costs for even the most experienced<br />
EM equity traders. Also, taxation concerns have an impact on<br />
trad<strong>in</strong>g costs, with countries such as Ch<strong>in</strong>a, Taiwan, among<br />
others, impos<strong>in</strong>g differ<strong>in</strong>g levels of taxes to transact <strong>in</strong> their<br />
domestic markets.<br />
Investment managers who have a dedicated and experienced<br />
emerg<strong>in</strong>g markets equity trad<strong>in</strong>g capability, particularly those<br />
with a global presence, are best positioned to mitigate the chal-<br />
lenges associated with trad<strong>in</strong>g <strong>in</strong> emerg<strong>in</strong>g markets. Those<br />
<strong>in</strong>vestment firms with emerg<strong>in</strong>g markets equity traders housed<br />
<strong>in</strong> regional markets have an advantage, as exist<strong>in</strong>g relationships<br />
with local brokers and markets best enable traders to identify<br />
local liquidity and execute trades most efficiently.<br />
Consider<strong>in</strong>g Passive or Active Investment Strategies<br />
Decid<strong>in</strong>g whether to <strong>in</strong>vest <strong>in</strong> a passive or active emerg<strong>in</strong>g<br />
markets equity strategy, or an appropriate comb<strong>in</strong>ation of both,<br />
is a logical place to start when th<strong>in</strong>k<strong>in</strong>g about emerg<strong>in</strong>g markets<br />
<strong>in</strong>vestment options. The benefits of passive <strong>in</strong>vestment strate-<br />
gies are clear and entic<strong>in</strong>g: the ability to achieve <strong>in</strong>dex exposure,<br />
low management fees and other cost-efficiencies.<br />
Emerg<strong>in</strong>g markets equity <strong>in</strong>dexes have historically experienced-<br />
higher constituent turnover than developed market equity<br />
<strong>in</strong>dexes, which require greater portfolio trad<strong>in</strong>g for EM <strong>in</strong>dex<br />
replicat<strong>in</strong>g managers. Greater trad<strong>in</strong>g activity at higher transac-<br />
tion costs is likely to have more of a negative impact on returns<br />
for passive EM equity strategies than passive DM equity strate-<br />
gies. In addition, to obta<strong>in</strong> exposure to less liquid segments of<br />
emerg<strong>in</strong>g markets equities, some passive managers may choose<br />
to employ a sampl<strong>in</strong>g approach which can lead to portfolio<br />
returns that differ from <strong>in</strong>dex returns.
SSgA CAPITAL INSIGHTS | EMERGING MARKETS EQUITIES<br />
Chart 1: Historical Strategy Performance: Active vs. Passive<br />
Passive Strategies,<br />
Excess Return (%) 1-year 3-year 5-year 10-year<br />
Median -0.12 -0.31 -0.17 -0.18<br />
# Strategies 4 3 3 1<br />
Active Strategies,<br />
Excess Return (%)<br />
5th Percentile 12.04 7.18 7.62 4.99<br />
25th Percentile 2.44 4.09 2.44 3.21<br />
Median 0.45 1.10 0.73 1.08<br />
75th Percentile -3.19 -0.97 -1.17 0.07<br />
95th Percentile -6.51 -3.92 -3.36 -1.21<br />
Active Strategies,<br />
Track<strong>in</strong>g Error (%)<br />
5th Percentile 9.68 9.54 10.19 8.26<br />
25th Percentile 6.21 6.09 5.85 5.22<br />
Median 4.50 4.44 4.56 4.13<br />
75th Percentile 3.47 3.56 3.82 3.61<br />
95th Percentile 2.30 2.55 2.73 2.71<br />
# Strategies 156 139 108 74<br />
As of December 31, 2011<br />
Source: eVestment Alliance, SSgA<br />
Returns are gross of management fees.<br />
Past performance is not a guarantee of future results.<br />
For all of these reasons, replicat<strong>in</strong>g emerg<strong>in</strong>g markets equity<br />
<strong>in</strong>dex returns is difficult, even for passive <strong>in</strong>vestment managers<br />
with deep experience trad<strong>in</strong>g <strong>in</strong> emerg<strong>in</strong>g markets. As high-<br />
lighted <strong>in</strong> Chart 1, the median <strong>in</strong>stitutional passive EM equity<br />
strategy has lagged the benchmark gross of management fees<br />
historically. 1 While not <strong>in</strong>cluded <strong>in</strong> this universe of <strong>in</strong>stitutional<br />
passive strategies, emerg<strong>in</strong>g markets equity exchange traded<br />
funds (ETFs), with an emphasis on liquidity, often employ<br />
greater degrees of sampl<strong>in</strong>g which has contributed to even<br />
deeper levels of underperformance historically.<br />
These challenges exist not only for passive <strong>in</strong>vestment<br />
managers, but also for active <strong>in</strong>vestment managers. Greater <strong>in</strong>ef-<br />
ficiencies <strong>in</strong> EM equities relative to DM equities result <strong>in</strong> more<br />
challenges for traders, but the less efficient nature of emerg<strong>in</strong>g<br />
markets economies and associated markets offer an opportu-<br />
nistic landscape for skilled active managers to generate alpha.<br />
In fact, the ability to persistently generate relatively higher levels<br />
of alpha is a must for active EM managers, if only to overcome<br />
the hurdle of the higher cost of trad<strong>in</strong>g. As shown <strong>in</strong> Chart 1,<br />
the median <strong>in</strong>stitutional active EM equity strategy has outper-<br />
formed the benchmark gross of management fees historically. 2<br />
In fact, over the past 10 years, approximately 80% of the active<br />
emerg<strong>in</strong>g markets equity universe has outperformed the bench-<br />
mark (subject to survivorship bias).<br />
An <strong>in</strong>terest<strong>in</strong>g observation from the past few years is the<br />
evolv<strong>in</strong>g degree of dispersion <strong>in</strong> active manager success and<br />
track<strong>in</strong>g error. The difference <strong>in</strong> relative returns between the<br />
5th (best) and 95th (worst) percentile active EM strategies<br />
over the past three years is over 11.1%, just below the 11.4%<br />
average roll<strong>in</strong>g three year difference <strong>in</strong> best and worst active<br />
EM strategies over the full period. This three year difference has<br />
decl<strong>in</strong>ed considerably <strong>in</strong> recent months, as it reached a relative<br />
high of over 14% <strong>in</strong> June 2011.<br />
The realized track<strong>in</strong>g error for the median active EM strategy<br />
over the past three years is near the 4.2% average roll<strong>in</strong>g three-<br />
year track<strong>in</strong>g error over the full period, though this risk metric<br />
has come down considerably s<strong>in</strong>ce its peak <strong>in</strong> mid-2009. These<br />
observations are likely a function of the historically high levels of<br />
equity market volatility experienced <strong>in</strong> 2008 and 2009, though<br />
the grow<strong>in</strong>g number of active EM strategies with potentially differ-<br />
entiated <strong>in</strong>vestment processes may also be a contribut<strong>in</strong>g factor.<br />
Active Invest<strong>in</strong>g: Quant or Fundamental… or Both?<br />
Investors seek<strong>in</strong>g an active emerg<strong>in</strong>g markets equity strategy<br />
would appear to have a broad universe of managers to choose<br />
from. Like any asset allocation decision, select<strong>in</strong>g multiple equity<br />
strategies with differ<strong>in</strong>g <strong>in</strong>vestment approaches is optimal from<br />
a diversification standpo<strong>in</strong>t, though this endeavor is not always<br />
atta<strong>in</strong>able if the <strong>in</strong>vestment size is small or an <strong>in</strong>vestor’s resources<br />
are constra<strong>in</strong>ed. However, consideration of the diversification<br />
benefits of different active <strong>in</strong>vestment approaches is important.<br />
Broadly speak<strong>in</strong>g, active <strong>in</strong>vestment strategies can be cate-<br />
gorized as quantitative or fundamental, or perhaps some<br />
comb<strong>in</strong>ation of the two, <strong>in</strong> regards to the <strong>in</strong>vestment approach.<br />
In general, a quantitative (‘quant’) <strong>in</strong>vestment approach seeks to<br />
generate alpha via a discipl<strong>in</strong>ed, objective <strong>in</strong>vestment process,<br />
which can quickly evaluate large amounts of <strong>in</strong>formation<br />
systematically to identify <strong>in</strong>vestment opportunities with<strong>in</strong> a broad<br />
universe. This type of <strong>in</strong>formation often <strong>in</strong>cludes bottom-up,<br />
fundamentally-oriented data to uncover mispriced stocks, and/<br />
or may also encompass top-down, macro-oriented data to help<br />
allocate across countries or sectors. Quantitative <strong>in</strong>vestment<br />
strategies are likely to employ risk constra<strong>in</strong>ts to seek to achieve<br />
a certa<strong>in</strong> level of track<strong>in</strong>g error.<br />
2
SSgA CAPITAL INSIGHTS | EMERGING MARKETS EQUITIES<br />
A fundamental <strong>in</strong>vestment approach, while sometimes apply<strong>in</strong>g<br />
quantitative tools to filter its opportunity set, relies on qualitative<br />
analysis and judgment when construct<strong>in</strong>g a portfolio. Similar<br />
to quant approaches, fundamental managers will employ some<br />
comb<strong>in</strong>ation of bottom-up or top-down analysis to reach action-<br />
able <strong>in</strong>vestment decisions.<br />
However, the fundamental manager tends to reach <strong>in</strong>vestment<br />
decisions based on deeper analysis of a smaller subset of<br />
<strong>in</strong>vestment opportunities, often lead<strong>in</strong>g to more concentrated<br />
positions at the stock level than the typical quant manager. As<br />
a result of this greater stock concentration that is driven by high<br />
conviction <strong>in</strong> fewer ideas, fundamental strategies often are less<br />
rigorous about benchmark-relative risk constra<strong>in</strong>ts, which tends<br />
to lead to higher track<strong>in</strong>g error than quant strategies.<br />
Chart 2 displays the performance of active emerg<strong>in</strong>g markets<br />
equity strategies, separated by quantitative and fundamentally-<br />
oriented <strong>in</strong>vestment approaches over the past decade. 3 The<br />
data were derived from the eVestment Alliance database, which<br />
assigns each strategy’s <strong>in</strong>vestment approach as fundamental,<br />
quantitative or a comb<strong>in</strong>ation of the two. S<strong>in</strong>ce it is not clear<br />
whether fundamental or quantitative techniques contribute more<br />
with<strong>in</strong> comb<strong>in</strong>ed <strong>in</strong>vestment approaches, this small category of<br />
strategies has been removed from this analysis.<br />
There are some <strong>in</strong>terest<strong>in</strong>g f<strong>in</strong>d<strong>in</strong>gs <strong>in</strong> this data set. First, funda-<br />
mental <strong>in</strong>vestment strategies have dom<strong>in</strong>ated the number of<br />
active EM offer<strong>in</strong>gs historically, as over the past 10 years there<br />
were over five times as many fundamental strategies as quant<br />
strategies offered. However, the number of quant strategies<br />
seems to have been grow<strong>in</strong>g at a more rapid rate <strong>in</strong> recent<br />
years, as the multiple of fundamental to quant strategies has<br />
shrunk to just over three times over the past few years.<br />
Chart 2: Historical Strategy Performance: Quant vs. Fundamental<br />
Second, both quant and fundamental strategies have had<br />
success <strong>in</strong> generat<strong>in</strong>g alpha. In fact, the median quant and<br />
fundamental EM strategies have outperformed the <strong>in</strong>dex <strong>in</strong> all<br />
historical time horizons, gross of management fees. Further, the<br />
median quant strategy has outperformed the median funda-<br />
mental strategy at each historical time horizon.<br />
Third, across all time horizons the dispersion of performance<br />
has been wider among fundamental strategies than it has been<br />
among quant strategies. The best perform<strong>in</strong>g fundamental<br />
strategy outperformed the best perform<strong>in</strong>g quant strategy<br />
over the past one and three years while the worst perform<strong>in</strong>g<br />
fundamental strategy delivered poorer returns than the weakest<br />
perform<strong>in</strong>g quant strategy across all time frames. This likely<br />
is expla<strong>in</strong>ed by the greater focus on benchmark-relative risk<br />
management by quant strategies, as noted above. The higher<br />
realized track<strong>in</strong>g error by fundamental strategies lends support<br />
to this hypothesis.<br />
F<strong>in</strong>ally, the median quant strategy has delivered an <strong>in</strong>formation<br />
ratio (IR) that is more than twice that of fundamental strategies<br />
over the past ten years, and over the past three years the median<br />
quant strategy’s IR was nearly six times that of the median<br />
fundamental strategy. Over the past decade, quant strategies<br />
look quite attractive from a risk-adjusted performance standpo<strong>in</strong>t.<br />
Diversification Us<strong>in</strong>g Both Quant and Fundamental Approaches<br />
While both <strong>in</strong>vestment approaches show evidence of deliver<strong>in</strong>g<br />
alpha, are there diversification benefits <strong>in</strong> allocat<strong>in</strong>g capital to<br />
both quant and fundamental EM equity strategies? An obvious<br />
way to answer this question would be to estimate the expected<br />
correlation <strong>in</strong> active returns for each type of strategy. Though<br />
this forecast correlation estimate is difficult to predict with<br />
1-Year 3-Year 5-Year 10-Year<br />
Returns (%) Quant Fundamental Quant Fundamental Quant Fundamental Quant Fundamental<br />
5th 10.77 12.77 6.92 7.25 7.79 7.69 5.86 4.84<br />
25th 3.42 2.84 4.74 2.87 3.18 2.14 3.85 2.90<br />
Median 1.41 0.04 2.76 0.80 1.70 0.54 3.00 1.07<br />
75th 0.35 -3.69 0.59 -0.96 -0.63 -1.31 0.65 0.13<br />
95th -3.02 -7.33 -1.08 -4.21 -1.55 -3.37 0.30 -1.11<br />
Median Track<strong>in</strong>g Error (%) 4.35 4.61 3.58 4.65 3.79 4.76 3.99 4.13<br />
Median Information Ratio 0.32 0.01 0.87 0.15 0.47 0.09 0.68 0.27<br />
# Strategies 28 97 26 86 14 72 9 50<br />
As of December 31, 2011<br />
Source: eVestment Alliance, SSgA<br />
Returns are gross of management fees. Past performance is not a guarantee of future results.<br />
3
SSgA CAPITAL INSIGHTS | EMERGING MARKETS EQUITIES<br />
accuracy, evaluat<strong>in</strong>g historical correlation patterns may help<br />
build forecasts.<br />
Chart 3 plots the roll<strong>in</strong>g 12-month excess return of the<br />
median quant and fundamental strategies over the past 10<br />
years. Also illustrated <strong>in</strong> this chart is the correlation of active<br />
returns between quant and fundamental strategies over roll<strong>in</strong>g<br />
12-month periods. Median quant and fundamental strategies<br />
both delivered positive roll<strong>in</strong>g 12-month relative performance<br />
over most of this period, with the one shared period of under-<br />
performance around the late 2008 to early 2009 time frame, a<br />
period associated with historical high levels of market volatility.<br />
The correlation of active returns between the quant and funda-<br />
mental strategies was lowest dur<strong>in</strong>g the 2004 through 2009<br />
period, where it was 24%. However, correlation of active returns<br />
dur<strong>in</strong>g the first couple years of this period, as well as dur<strong>in</strong>g the<br />
last two and a quarter years, was higher at just over 50% and<br />
60%, respectively.<br />
Chart 4 offers summary correlation data related to the active<br />
returns. The correlation of monthly active returns between the<br />
median quant and fundamental strategies over the past 10<br />
years is 40%, certa<strong>in</strong>ly a noticeably positive number. However,<br />
the correlation of roll<strong>in</strong>g 12-month active returns between the<br />
two approaches over the entire period was only 13%, a consid-<br />
erably lower number.<br />
Chart 3: Median Excess Returns, Roll<strong>in</strong>g 12-Month Periods<br />
January 2002–December 2011<br />
Median Excess Returns (%) Correlation of Excess Returns<br />
11<br />
9<br />
7<br />
5<br />
3<br />
1<br />
-1<br />
-3<br />
Dec<br />
2001<br />
2004 2006 2009 Dec<br />
2011<br />
-0.4<br />
— Quant<br />
— Fundamental<br />
— Correlation of Quant vs. Fund Median Excess Returns (RHS)<br />
Source: eVestment Alliance, SSgA<br />
Returns are gross of management fees.<br />
Past performance is not a guarantee of future results.<br />
1.0<br />
0.8<br />
0.6<br />
0.4<br />
0.2<br />
0.0<br />
-0.2<br />
Chart 4: Correlation of Median EM Returns: Quant vs. Fundamental<br />
January 2002–December 2011<br />
%<br />
Monthly Active Returns Over Full Period 40<br />
Roll<strong>in</strong>g 12-Month Active Returns 13<br />
Source: eVestment Alliance, SSgA<br />
Returns are gross of management fees.<br />
Past performance is not a guarantee of future results.<br />
This is an <strong>in</strong>dication that while the relative performance of the<br />
two strategy offer<strong>in</strong>gs may have been materially positively corre-<br />
lated over the past decade, the correlation between the two<br />
<strong>in</strong>vestment approaches appears to have been quite low over<br />
shorter time frames with<strong>in</strong> this ten-year period. This would imply<br />
that there is the potential for diversification benefits by <strong>in</strong>clud<strong>in</strong>g<br />
a quantitative and a fundamental strategy with<strong>in</strong> an active<br />
emerg<strong>in</strong>g markets equity portfolio.<br />
Summary<br />
Transaction costs <strong>in</strong> emerg<strong>in</strong>g markets equities are consider-<br />
ably higher than those for developed market equities, creat<strong>in</strong>g<br />
greater hurdles for passive and active emerg<strong>in</strong>g markets<br />
managers that are likely to cont<strong>in</strong>ue to have a negative impact<br />
on relative returns.<br />
Over the most recent decade, the majority of active EM<br />
managers appears to have had success <strong>in</strong> generat<strong>in</strong>g alpha<br />
before management fees. Both quantitative and fundamental<br />
active EM equity strategies, while utiliz<strong>in</strong>g differentiated<br />
approaches to uncover alpha and construct portfolios, have on<br />
average outperformed the benchmark over the recent history.<br />
If recent history is a guide for future expectations, <strong>in</strong>vestors<br />
seek<strong>in</strong>g active management <strong>in</strong> emerg<strong>in</strong>g markets equities may<br />
want to consider allocat<strong>in</strong>g across different types of <strong>in</strong>vestment<br />
approaches, as there may be attractive diversification benefits<br />
dur<strong>in</strong>g certa<strong>in</strong> periods of a market cycle.<br />
1 ‘Passive Strategies’ universe created from eVestment Alliance and is subject to survivorship<br />
bias. Started with eA All EM Equity universe, then filtered for <strong>in</strong>stitutional<br />
strategies with MSCI Emerg<strong>in</strong>g <strong>Markets</strong> Index as ‘Preferred Benchmark’, report<strong>in</strong>g<br />
gross of management fees and Passive for ‘Investment Strategy.’<br />
2 ‘Active Strategies’ universe created from eVestment Alliance and is subject to<br />
survivorship bias. Started with eA All EM Equity universe, then filtered for strategies<br />
with MSCI Emerg<strong>in</strong>g <strong>Markets</strong> Index as ‘Preferred Benchmark’, report<strong>in</strong>g gross of<br />
management fees and Active for ‘Investment Strategy.’<br />
3 ‘Quant’ and ‘Fundamental’ universes created from eVestment Alliance, and are subject<br />
to survivorship bias. Started with eA All EM Equity universe, then filtered for strategies<br />
with MSCI Emerg<strong>in</strong>g <strong>Markets</strong> Index as ‘Preferred Benchmark’, report<strong>in</strong>g gross of<br />
management fees and Active for ‘Investment Strategy.’ Next, filtered for strategies with<br />
either Quantitative or Fundamental as the ‘Primary Investment Approach’.<br />
4
SSgA CAPITAL INSIGHTS | EMERGING MARKETS EQUITIES<br />
SSgA <strong>Global</strong> Entities<br />
Australia: <strong>State</strong> <strong>Street</strong> <strong>Global</strong> Advisors, Australia, Limited (ABN 42 003 914 225) is the holder of an Australian F<strong>in</strong>ancial Services Licence (AFSL Number 238276). Registered office: Level 17, 420 George<br />
<strong>Street</strong>, Sydney, NSW 2000, Australia Telephone: +612 9240-7600 • Facsimile: +612 9240-7611. Belgium: <strong>State</strong> <strong>Street</strong> <strong>Global</strong> Advisors Belgium, Office Park Nysdam, 92 Avenue Re<strong>in</strong>e Astrid, B-1310<br />
La Hulpe, Belgium. Telephone: 32 2 663 2036 • Facsimile: 32 2 672 2077. Belgium is a branch of <strong>State</strong> <strong>Street</strong> <strong>Global</strong> Advisors Limited. Canada: <strong>State</strong> <strong>Street</strong> <strong>Global</strong> Advisors, Ltd., 770 Sherbrooke<br />
<strong>Street</strong> West Suite 1200, Montreal, Quebec H3A 1G1 Canada and 30 Adelaide <strong>Street</strong> East, Suite 500, Toronto, Ontario, M5C 3G6 Canada. Dubai: <strong>State</strong> <strong>Street</strong> Bank and Trust Company (Representative<br />
Office), Suite 404 4th Floor, Build<strong>in</strong>g 4, Emaar Square, Dubai, United Arab Emirates. Telephone: +971 (0)4-4372800 • Facsimile: +971 (0)4-4372818. France: <strong>State</strong> <strong>Street</strong> <strong>Global</strong> Advisors France.<br />
Authorised and regulated by the Autorité des Marchés F<strong>in</strong>anciers. Registered with the Register of Commerce and Companies of Nanterre under the number 412 052 680. Registered office: Immeuble<br />
Défense Plaza, 23-25 rue Delarivière-Lefoullon, 92064 Paris La Défense Cedex, France. Telephone: (+33) 1 44 45 40 00 • Facsimile: (+33) 1 44 45 41 92. Germany: <strong>State</strong> <strong>Street</strong> <strong>Global</strong> Advisors GmbH,<br />
Brienner Strasse 59, D-80333 Munich. Telephone +49 (0)89-55878-400 • Facsimile +49 (0)89-55878-440. Hong Kong: <strong>State</strong> <strong>Street</strong> <strong>Global</strong> Advisors Asia Limited, 68/F, Two International F<strong>in</strong>ance<br />
Centre, 8 F<strong>in</strong>ance <strong>Street</strong>, Central, Hong Kong • Telephone: +852 2103-0288 • Facsimile: +852 2103-0200. Japan: <strong>State</strong> <strong>Street</strong> <strong>Global</strong> Advisors, Japan, 9-7-1 Akasaka, M<strong>in</strong>ato-ku, Tokyo Telephone +813<br />
4530 7380. F<strong>in</strong>ancial Instruments Bus<strong>in</strong>ess Operator, Kanto Local F<strong>in</strong>ancial Bureau (K<strong>in</strong>sho #345). Japan Securities Investment Advisers Association, Investment Trust Association, Japan Securities<br />
Dealers’ Association. Ireland: <strong>State</strong> <strong>Street</strong> <strong>Global</strong> Advisors Ireland Limited is regulated by the Central Bank of Ireland. Incorporated and registered <strong>in</strong> Ireland at Two Park Place, Upper Hatch <strong>Street</strong>,<br />
Dubl<strong>in</strong> 2. Registered number 145221. Member of the Irish Association of Investment Managers. Italy: <strong>State</strong> <strong>Street</strong> <strong>Global</strong> Advisors Ltd., Sede Secondaria di Milano - Via dei Bossi, 4 20121 Milan,<br />
Italy. Telephone: +39 02 32066 100 • Facsimile: +39 02 32066 155. Netherlands: <strong>State</strong> <strong>Street</strong> <strong>Global</strong> Advisors Netherlands, Adam Smith Build<strong>in</strong>g, Thomas Malthusstraat 1-3, 1066 JR Amsterdam,<br />
Netherlands. Telephone: 31 20 7085600 • Facsimile 31 20 7085601, SSgA Netherlands is a branch of <strong>State</strong> <strong>Street</strong> <strong>Global</strong> Advisors Limited. S<strong>in</strong>gapore: <strong>State</strong> <strong>Street</strong> <strong>Global</strong> Advisors S<strong>in</strong>gapore Limited,<br />
168, Rob<strong>in</strong>son Road, #33-01 Capital Tower, S<strong>in</strong>gapore 068912 (Company Reg. No: 200002719D), Telephone: +65 6826-7500 • Facsimile: +65 6826-7501. Switzerland: <strong>State</strong> <strong>Street</strong> <strong>Global</strong> Advisors<br />
AG, Beethovenstr. 19, CH-8027 Zurich. Telephone +41 (0)44 245 70 00 • Facsimile +41 (0)44 245 70 16. United K<strong>in</strong>gdom: <strong>State</strong> <strong>Street</strong> <strong>Global</strong> Advisors Limited. Authorised and regulated by the<br />
F<strong>in</strong>ancial Services Authority. Registered <strong>in</strong> England. Registered No. 2509928. VAT No. 5776591 81. Registered office: 20 Churchill Place, Canary Wharf, London, E14 5HJ. Telephone: 020 3395 6000<br />
• Facsimile: 020 3395 6350. United <strong>State</strong>s: <strong>State</strong> <strong>Street</strong> <strong>Global</strong> Advisors, One L<strong>in</strong>coln <strong>Street</strong>, Boston, MA 02111-2900.<br />
Web: www.ssga.com<br />
The views expressed <strong>in</strong> this material are the views of Scott Conlon through the period ended April 30, 2012 and are subject to change based on market and other conditions. The <strong>in</strong>formation<br />
provided does not constitute <strong>in</strong>vestment advice and it should not be relied on as such. All material has been obta<strong>in</strong>ed from sources believed to be reliable, but its accuracy is not guaranteed. This<br />
document conta<strong>in</strong>s certa<strong>in</strong> statements that may be deemed forward-look<strong>in</strong>g statements. Please note that any such statements are not guarantees of any future performance and actual results or<br />
developments may differ materially from those projected. Past performance is not a guarantee of future results.<br />
Invest<strong>in</strong>g <strong>in</strong> foreign domiciled securities may <strong>in</strong>volve risk of capital loss from unfavorable fluctuation <strong>in</strong> currency values, withhold<strong>in</strong>g taxes, from differences <strong>in</strong> generally accepted account<strong>in</strong>g pr<strong>in</strong>ciples<br />
or from economic or political <strong>in</strong>stability <strong>in</strong> other nations.<br />
Investments <strong>in</strong> emerg<strong>in</strong>g or develop<strong>in</strong>g markets may be more volatile and less liquid than <strong>in</strong>vest<strong>in</strong>g <strong>in</strong> developed markets and may <strong>in</strong>volve exposur e to economic structures that are generally less<br />
diverse and mature and to political systems which have less stability than those of more developed countries.<br />
Invest<strong>in</strong>g <strong>in</strong>volves risk <strong>in</strong>clud<strong>in</strong>g the risk of loss of pr<strong>in</strong>cipal.<br />
Risk associated with equity <strong>in</strong>vest<strong>in</strong>g <strong>in</strong>clude stock values which may fluctuate <strong>in</strong> response to the activities of <strong>in</strong>dividual companies and general market and economic conditions.<br />
Diversification does not ensure a profit or guarantee aga<strong>in</strong>st loss.<br />
©2012 STATE STREET CORPORATION ID1111-INST-3130 0512 Exp. Date: 5/31/2013<br />
5