Statistical and Low Temperature Physics - University of Liverpool
Statistical and Low Temperature Physics - University of Liverpool
Statistical and Low Temperature Physics - University of Liverpool

You also want an ePaper? Increase the reach of your titles
YUMPU automatically turns print PDFs into web optimized ePapers that Google loves.
Insulators<br />
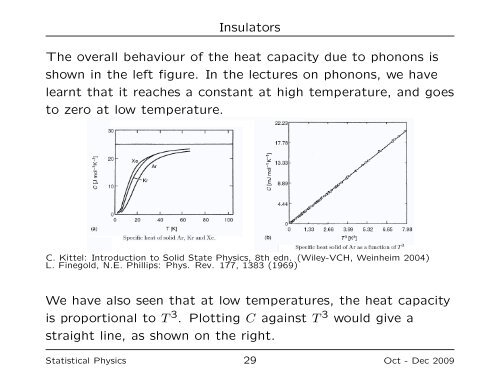
The overall behaviour <strong>of</strong> the heat capacity due to phonons is<br />
shown in the left figure. In the lectures on phonons, we have<br />
learnt that it reaches a constant at high temperature, <strong>and</strong> goes<br />
to zero at low temperature.<br />
C. Kittel: Introduction to Solid State <strong>Physics</strong>, 8th edn. (Wiley-VCH, Weinheim 2004)<br />
L. Finegold, N.E. Phillips: Phys. Rev. 177, 1383 (1969)<br />
We have also seen that at low temperatures, the heat capacity<br />
is proportional to T 3 . Plotting C against T 3 would give a<br />
straight line, as shown on the right.<br />
<strong>Statistical</strong> <strong>Physics</strong> 29 Oct - Dec 2009