Intrinsic Wavelength Standard Absorption Bands in Holmium Oxide ...
Intrinsic Wavelength Standard Absorption Bands in Holmium Oxide ...
Intrinsic Wavelength Standard Absorption Bands in Holmium Oxide ...

Create successful ePaper yourself
Turn your PDF publications into a flip-book with our unique Google optimized e-Paper software.
50 TRAVIS ET AL.<br />
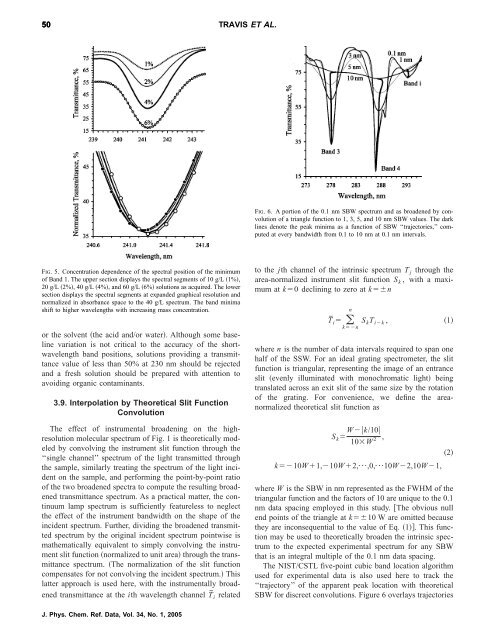
FIG. 5. Concentration dependence of the spectral position of the m<strong>in</strong>imum<br />
of Band 1. The upper section displays the spectral segments of 10 g/L 1%,<br />
20 g/L 2%, 40g/L4%, and 60 g/L 6% solutions as acquired. The lower<br />
section displays the spectral segments at expanded graphical resolution and<br />
normalized <strong>in</strong> absorbance space to the 40 g/L spectrum. The band m<strong>in</strong>ima<br />
shift to higher wavelengths with <strong>in</strong>creas<strong>in</strong>g mass concentration.<br />
or the solvent the acid and/or water. Although some basel<strong>in</strong>e<br />
variation is not critical to the accuracy of the shortwavelength<br />
band positions, solutions provid<strong>in</strong>g a transmittance<br />
value of less than 50% at 230 nm should be rejected<br />
and a fresh solution should be prepared with attention to<br />
avoid<strong>in</strong>g organic contam<strong>in</strong>ants.<br />
3.9. Interpolation by Theoretical Slit Function<br />
Convolution<br />
The effect of <strong>in</strong>strumental broaden<strong>in</strong>g on the highresolution<br />
molecular spectrum of Fig. 1 is theoretically modeled<br />
by convolv<strong>in</strong>g the <strong>in</strong>strument slit function through the<br />
‘‘s<strong>in</strong>gle channel’’ spectrum of the light transmitted through<br />
the sample, similarly treat<strong>in</strong>g the spectrum of the light <strong>in</strong>cident<br />
on the sample, and perform<strong>in</strong>g the po<strong>in</strong>t-by-po<strong>in</strong>t ratio<br />
of the two broadened spectra to compute the result<strong>in</strong>g broadened<br />
transmittance spectrum. As a practical matter, the cont<strong>in</strong>uum<br />
lamp spectrum is sufficiently featureless to neglect<br />
the effect of the <strong>in</strong>strument bandwidth on the shape of the<br />
<strong>in</strong>cident spectrum. Further, divid<strong>in</strong>g the broadened transmitted<br />
spectrum by the orig<strong>in</strong>al <strong>in</strong>cident spectrum po<strong>in</strong>twise is<br />
mathematically equivalent to simply convolv<strong>in</strong>g the <strong>in</strong>strument<br />
slit function normalized to unit area through the transmittance<br />
spectrum. The normalization of the slit function<br />
compensates for not convolv<strong>in</strong>g the <strong>in</strong>cident spectrum. This<br />
latter approach is used here, with the <strong>in</strong>strumentally broadened<br />
transmittance at the ith wavelength channel T¯ i related<br />
J. Phys. Chem. Ref. Data, Vol. 34, No. 1, 2005<br />
FIG. 6. A portion of the 0.1 nm SBW spectrum and as broadened by convolution<br />
of a triangle function to 1, 3, 5, and 10 nm SBW values. The dark<br />
l<strong>in</strong>es denote the peak m<strong>in</strong>ima as a function of SBW ‘‘trajectories,’’ computed<br />
at every bandwidth from 0.1 to 10 nm at 0.1 nm <strong>in</strong>tervals.<br />
to the jth channel of the <strong>in</strong>tr<strong>in</strong>sic spectrum T j through the<br />
area-normalized <strong>in</strong>strument slit function S k , with a maximum<br />
at k0 decl<strong>in</strong><strong>in</strong>g to zero at kn<br />
n<br />
T¯<br />
i SkT ik , 1<br />
kn<br />
where n is the number of data <strong>in</strong>tervals required to span one<br />
half of the SSW. For an ideal grat<strong>in</strong>g spectrometer, the slit<br />
function is triangular, represent<strong>in</strong>g the image of an entrance<br />
slit evenly illum<strong>in</strong>ated with monochromatic light be<strong>in</strong>g<br />
translated across an exit slit of the same size by the rotation<br />
of the grat<strong>in</strong>g. For convenience, we def<strong>in</strong>e the areanormalized<br />
theoretical slit function as<br />
Sk Wk/10<br />
10W 2 ,<br />
2<br />
k10W1,10W2,¯,0,¯10W2,10W1,<br />
where W is the SBW <strong>in</strong> nm represented as the FWHM of the<br />
triangular function and the factors of 10 are unique to the 0.1<br />
nm data spac<strong>in</strong>g employed <strong>in</strong> this study. The obvious null<br />
end po<strong>in</strong>ts of the triangle at k10 W are omitted because<br />
they are <strong>in</strong>consequential to the value of Eq. 1. This function<br />
may be used to theoretically broaden the <strong>in</strong>tr<strong>in</strong>sic spectrum<br />
to the expected experimental spectrum for any SBW<br />
that is an <strong>in</strong>tegral multiple of the 0.1 nm data spac<strong>in</strong>g.<br />
The NIST/CSTL five-po<strong>in</strong>t cubic band location algorithm<br />
used for experimental data is also used here to track the<br />
‘‘trajectory’’ of the apparent peak location with theoretical<br />
SBW for discreet convolutions. Figure 6 overlays trajectories