Intrinsic Wavelength Standard Absorption Bands in Holmium Oxide ...
Intrinsic Wavelength Standard Absorption Bands in Holmium Oxide ...
Intrinsic Wavelength Standard Absorption Bands in Holmium Oxide ...

Create successful ePaper yourself
Turn your PDF publications into a flip-book with our unique Google optimized e-Paper software.
Band<br />
N a<br />
m<strong>in</strong> b<br />
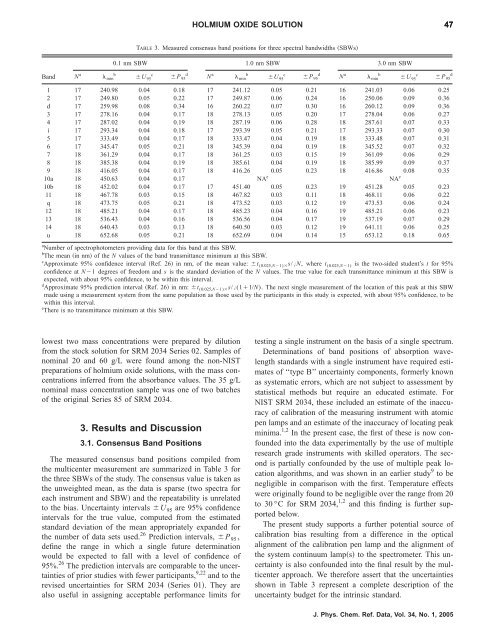
TABLE 3. Measured consensus band positions for three spectral bandwidths SBWs<br />
0.1 nm SBW 1.0 nm SBW 3.0 nm SBW<br />
U 95 c P 95 d<br />
lowest two mass concentrations were prepared by dilution<br />
from the stock solution for SRM 2034 Series 02. Samples of<br />
nom<strong>in</strong>al 20 and 60 g/L were found among the non-NIST<br />
preparations of holmium oxide solutions, with the mass concentrations<br />
<strong>in</strong>ferred from the absorbance values. The 35 g/L<br />
nom<strong>in</strong>al mass concentration sample was one of two batches<br />
of the orig<strong>in</strong>al Series 85 of SRM 2034.<br />
3. Results and Discussion<br />
3.1. Consensus Band Positions<br />
The measured consensus band positions compiled from<br />
the multicenter measurement are summarized <strong>in</strong> Table 3 for<br />
the three SBWs of the study. The consensus value is taken as<br />
the unweighted mean, as the data is sparse two spectra for<br />
each <strong>in</strong>strument and SBW and the repeatability is unrelated<br />
to the bias. Uncerta<strong>in</strong>ty <strong>in</strong>tervals U 95 are 95% confidence<br />
<strong>in</strong>tervals for the true value, computed from the estimated<br />
standard deviation of the mean appropriately expanded for<br />
the number of data sets used. 26 Prediction <strong>in</strong>tervals, P 95 ,<br />
def<strong>in</strong>e the range <strong>in</strong> which a s<strong>in</strong>gle future determ<strong>in</strong>ation<br />
would be expected to fall with a level of confidence of<br />
95%. 26 The prediction <strong>in</strong>tervals are comparable to the uncerta<strong>in</strong>ties<br />
of prior studies with fewer participants, 9,22 and to the<br />
revised uncerta<strong>in</strong>ties for SRM 2034 Series 01. They are<br />
also useful <strong>in</strong> assign<strong>in</strong>g acceptable performance limits for<br />
HOLMIUM OXIDE SOLUTION<br />
N a<br />
m<strong>in</strong> b<br />
U 95 c P 95 d<br />
N a<br />
m<strong>in</strong> b<br />
U 95 c P 95 d<br />
1 17 240.98 0.04 0.18 17 241.12 0.05 0.21 16 241.03 0.06 0.25<br />
2 17 249.80 0.05 0.22 17 249.87 0.06 0.24 16 250.06 0.09 0.36<br />
d 17 259.98 0.08 0.34 16 260.22 0.07 0.30 16 260.12 0.09 0.36<br />
3 17 278.16 0.04 0.17 18 278.13 0.05 0.20 17 278.04 0.06 0.27<br />
4 17 287.02 0.04 0.19 18 287.19 0.06 0.28 18 287.61 0.07 0.33<br />
i 17 293.34 0.04 0.18 17 293.39 0.05 0.21 17 293.33 0.07 0.30<br />
5 17 333.49 0.04 0.17 18 333.47 0.04 0.19 18 333.48 0.07 0.31<br />
6 17 345.47 0.05 0.21 18 345.39 0.04 0.19 18 345.52 0.07 0.32<br />
7 18 361.29 0.04 0.17 18 361.25 0.03 0.15 19 361.09 0.06 0.29<br />
8 18 385.38 0.04 0.19 18 385.61 0.04 0.19 18 385.99 0.09 0.37<br />
9 18 416.05 0.04 0.17 18 416.26 0.05 0.23 18 416.86 0.08 0.35<br />
10a 18 450.63 0.04 0.17 NA e<br />
NA e<br />
10b 18 452.02 0.04 0.17 17 451.40 0.05 0.23 19 451.28 0.05 0.23<br />
11 18 467.78 0.03 0.15 18 467.82 0.03 0.11 18 468.11 0.06 0.22<br />
q 18 473.75 0.05 0.21 18 473.52 0.03 0.12 19 473.53 0.06 0.24<br />
12 18 485.21 0.04 0.17 18 485.23 0.04 0.16 19 485.21 0.06 0.23<br />
13 18 536.43 0.04 0.16 18 536.56 0.04 0.17 19 537.19 0.07 0.29<br />
14 18 640.43 0.03 0.13 18 640.50 0.03 0.12 19 641.11 0.06 0.25<br />
u 18 652.68 0.05 0.21 18 652.69 0.04 0.14 15 653.12 0.18 0.65<br />
a Number of spectrophotometers provid<strong>in</strong>g data for this band at this SBW.<br />
b The mean <strong>in</strong> nm of the N values of the band transmittance m<strong>in</strong>imum at this SBW.<br />
c Approximate 95% confidence <strong>in</strong>terval Ref. 26 <strong>in</strong> nm, of the mean value: t(0.025,N1)s/N, where t (0.025,N1) is the two-sided student’s t for 95%<br />
confidence at N1 degrees of freedom and s is the standard deviation of the N values. The true value for each transmittance m<strong>in</strong>imum at this SBW is<br />
expected, with about 95% confidence, to be with<strong>in</strong> this <strong>in</strong>terval.<br />
d Approximate 95% prediction <strong>in</strong>terval Ref. 26 <strong>in</strong> nm: t(0.025,N1)s/(11/N). The next s<strong>in</strong>gle measurement of the location of this peak at this SBW<br />
made us<strong>in</strong>g a measurement system from the same population as those used by the participants <strong>in</strong> this study is expected, with about 95% confidence, to be<br />
with<strong>in</strong> this <strong>in</strong>terval.<br />
e There is no transmittance m<strong>in</strong>imum at this SBW.<br />
47<br />
test<strong>in</strong>g a s<strong>in</strong>gle <strong>in</strong>strument on the basis of a s<strong>in</strong>gle spectrum.<br />
Determ<strong>in</strong>ations of band positions of absorption wavelength<br />
standards with a s<strong>in</strong>gle <strong>in</strong>strument have required estimates<br />
of ‘‘type B’’ uncerta<strong>in</strong>ty components, formerly known<br />
as systematic errors, which are not subject to assessment by<br />
statistical methods but require an educated estimate. For<br />
NIST SRM 2034, these <strong>in</strong>cluded an estimate of the <strong>in</strong>accuracy<br />
of calibration of the measur<strong>in</strong>g <strong>in</strong>strument with atomic<br />
pen lamps and an estimate of the <strong>in</strong>accuracy of locat<strong>in</strong>g peak<br />
m<strong>in</strong>ima. 1,2 In the present case, the first of these is now confounded<br />
<strong>in</strong>to the data experimentally by the use of multiple<br />
research grade <strong>in</strong>struments with skilled operators. The second<br />
is partially confounded by the use of multiple peak location<br />
algorithms, and was shown <strong>in</strong> an earlier study 9 to be<br />
negligible <strong>in</strong> comparison with the first. Temperature effects<br />
were orig<strong>in</strong>ally found to be negligible over the range from 20<br />
to 30 °C for SRM 2034, 1,2 and this f<strong>in</strong>d<strong>in</strong>g is further supported<br />
below.<br />
The present study supports a further potential source of<br />
calibration bias result<strong>in</strong>g from a difference <strong>in</strong> the optical<br />
alignment of the calibration pen lamp and the alignment of<br />
the system cont<strong>in</strong>uum lamps to the spectrometer. This uncerta<strong>in</strong>ty<br />
is also confounded <strong>in</strong>to the f<strong>in</strong>al result by the multicenter<br />
approach. We therefore assert that the uncerta<strong>in</strong>ties<br />
shown <strong>in</strong> Table 3 represent a complete description of the<br />
uncerta<strong>in</strong>ty budget for the <strong>in</strong>tr<strong>in</strong>sic standard.<br />
J. Phys. Chem. Ref. Data, Vol. 34, No. 1, 2005