Intrinsic Wavelength Standard Absorption Bands in Holmium Oxide ...
Intrinsic Wavelength Standard Absorption Bands in Holmium Oxide ...
Intrinsic Wavelength Standard Absorption Bands in Holmium Oxide ...
Create successful ePaper yourself
Turn your PDF publications into a flip-book with our unique Google optimized e-Paper software.
54 TRAVIS ET AL.<br />
SBW a<br />
max b<br />
TABLE 4. Locations of band m<strong>in</strong>ima as a function of SBW—Cont<strong>in</strong>ued<br />
Band 13 Band 14 Band u<br />
U 95 c P 95 d<br />
max b<br />
U 95 c P 95 d<br />
max b<br />
U 95 c P 95 d<br />
2.5 537.03 0.04 0.27 640.98 0.04 0.22 652.74 0.04 0.23<br />
2.6 537.06 0.04 0.28 641.01 0.04 0.23 652.79 0.04 0.23<br />
2.7 537.10 0.04 0.28 641.05 0.04 0.23 652.86 0.04 0.25<br />
2.8 537.14 0.04 0.29 641.08 0.04 0.24 652.96 0.04 0.26<br />
2.9 537.18 0.04 0.30 641.11 0.04 0.25 653.16 0.05 0.34<br />
3.0 537.21 0.04 0.31 641.15 0.04 0.25 653.46 0.11 0.56<br />
4.0 537.58 0.04<br />
f<br />
641.42 0.04<br />
f<br />
653.54 0.05<br />
f<br />
5.0 537.91 0.04<br />
f<br />
641.66 0.04<br />
f<br />
NA e<br />
6.0 538.28 0.04<br />
f<br />
641.88 0.04<br />
f<br />
NA e<br />
7.0 538.50 0.04<br />
f<br />
642.09 0.04<br />
f<br />
NA e<br />
8.0 538.64 0.04<br />
f<br />
642.32 0.04<br />
f<br />
NA e<br />
9.0 538.75 0.04<br />
f<br />
642.57 0.04<br />
f<br />
NA e<br />
10.0 538.83 0.04<br />
f<br />
642.86 0.04<br />
f<br />
NA e<br />
a Spectral band width <strong>in</strong> nm.<br />
b The expected location of the transmittance m<strong>in</strong>imum <strong>in</strong> nm calculated as the mean of 0.1 nm SBW spectra from 13 <strong>in</strong>struments convolved with an idealized<br />
triangular slit function of width SBW.<br />
c Approximate 95% confidence <strong>in</strong>terval Ref. 26 <strong>in</strong> nm of the expected transmittance m<strong>in</strong>imum: t(0.025,N1)s/13, where t (0.025,13-1) is the two-sided<br />
student’s t for 95% confidence at 12 degrees of freedom and s is the standard deviation of the 13 convolved spectra at the given SBW. The true value for each<br />
transmittance m<strong>in</strong>imum at each given SBW is expected, with about 95% confidence, to be with<strong>in</strong> this <strong>in</strong>terval.<br />
d Approximate 95% prediction <strong>in</strong>terval Ref. 26 <strong>in</strong> nm: t(0.025,13-1)sMEF/11/13, where MEF is the empirically determ<strong>in</strong>ed multiplicative expansion<br />
factor 10.025SBW0.080SBW 2 that accounts for the uncerta<strong>in</strong>ty of calibrat<strong>in</strong>g real <strong>in</strong>struments at large SBW. The next s<strong>in</strong>gle measurement of the<br />
location of this peak at this SBW made us<strong>in</strong>g a measurement system from the same population as those used by the participants <strong>in</strong> this study is expected, with<br />
about 95% confidence, to be with<strong>in</strong> this <strong>in</strong>terval.<br />
e There is no transmittance m<strong>in</strong>imum at this SBW.<br />
f Due to the empirical derivation of MEF, P95 cannot be reliably calculated for SBW greater than 3.0 nm.<br />
.for three bands with a portion of the broadened spectrum at<br />
several bandwidths for illustration. The trajectories are computed<br />
us<strong>in</strong>g every bandwidth from 0.1 to 10 nm at 0.1 nm<br />
<strong>in</strong>tervals, and not just the few shown <strong>in</strong> the figure.<br />
Table 4 reports the positions of all bands studied here at<br />
SBWs from 0.1 to 3.0 nm <strong>in</strong> 0.1 nm <strong>in</strong>tervals, with a few<br />
J. Phys. Chem. Ref. Data, Vol. 34, No. 1, 2005<br />
representative values given for larger SBW values. The calculation<br />
represented <strong>in</strong> the table utilized all calibrated full<br />
spectra furnished by participants at an SBW of 0.1 nm (N<br />
13). Each spectrum was convolved to the SBWs shown<br />
and the band locations were extracted for each SBW. The<br />
central value, uncerta<strong>in</strong>ty, and prediction <strong>in</strong>terval were com-<br />
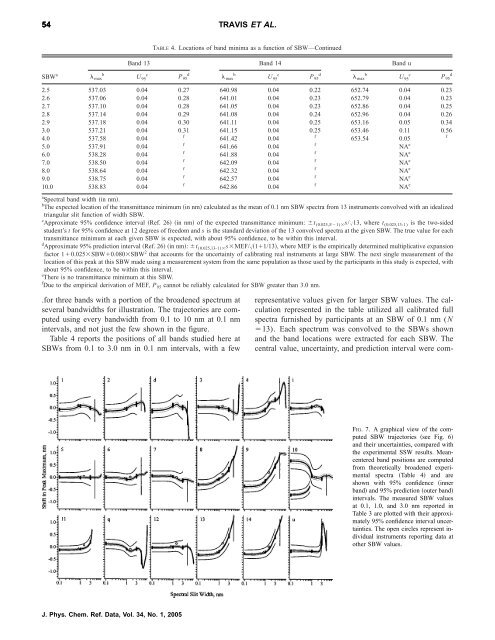
FIG. 7. A graphical view of the computed<br />
SBW trajectories see Fig. 6<br />
and their uncerta<strong>in</strong>ties, compared with<br />
the experimental SSW results. Meancentered<br />
band positions are computed<br />
from theoretically broadened experimental<br />
spectra Table 4 and are<br />
shown with 95% confidence <strong>in</strong>ner<br />
band and 95% prediction outer band<br />
<strong>in</strong>tervals. The measured SBW values<br />
at 0.1, 1.0, and 3.0 nm reported <strong>in</strong><br />
Table 3 are plotted with their approximately<br />
95% confidence <strong>in</strong>terval uncerta<strong>in</strong>ties.<br />
The open circles represent <strong>in</strong>dividual<br />
<strong>in</strong>struments report<strong>in</strong>g data at<br />
other SBW values.


