Intrinsic Wavelength Standard Absorption Bands in Holmium Oxide ...
Intrinsic Wavelength Standard Absorption Bands in Holmium Oxide ...
Intrinsic Wavelength Standard Absorption Bands in Holmium Oxide ...

Create successful ePaper yourself
Turn your PDF publications into a flip-book with our unique Google optimized e-Paper software.
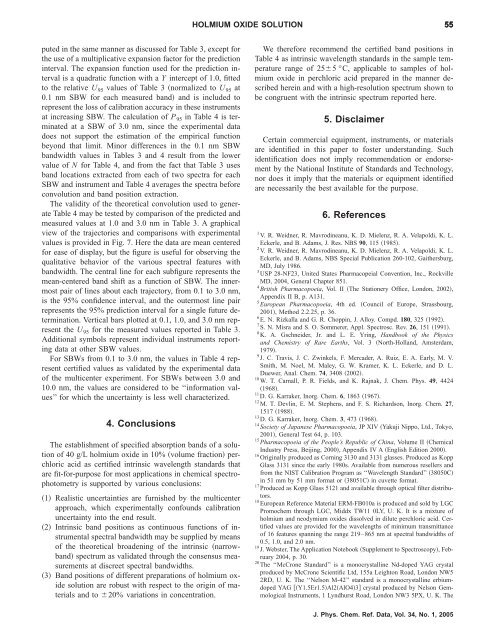
puted <strong>in</strong> the same manner as discussed for Table 3, except for<br />
the use of a multiplicative expansion factor for the prediction<br />
<strong>in</strong>terval. The expansion function used for the prediction <strong>in</strong>terval<br />
is a quadratic function with a Y <strong>in</strong>tercept of 1.0, fitted<br />
to the relative U 95 values of Table 3 normalized to U 95 at<br />
0.1 nm SBW for each measured band and is <strong>in</strong>cluded to<br />
represent the loss of calibration accuracy <strong>in</strong> these <strong>in</strong>struments<br />
at <strong>in</strong>creas<strong>in</strong>g SBW. The calculation of P 95 <strong>in</strong> Table 4 is term<strong>in</strong>ated<br />
at a SBW of 3.0 nm, s<strong>in</strong>ce the experimental data<br />
does not support the estimation of the empirical function<br />
beyond that limit. M<strong>in</strong>or differences <strong>in</strong> the 0.1 nm SBW<br />
bandwidth values <strong>in</strong> Tables 3 and 4 result from the lower<br />
value of N for Table 4, and from the fact that Table 3 uses<br />
band locations extracted from each of two spectra for each<br />
SBW and <strong>in</strong>strument and Table 4 averages the spectra before<br />
convolution and band position extraction.<br />
The validity of the theoretical convolution used to generate<br />
Table 4 may be tested by comparison of the predicted and<br />
measured values at 1.0 and 3.0 nm <strong>in</strong> Table 3. A graphical<br />
view of the trajectories and comparisons with experimental<br />
values is provided <strong>in</strong> Fig. 7. Here the data are mean centered<br />
for ease of display, but the figure is useful for observ<strong>in</strong>g the<br />
qualitative behavior of the various spectral features with<br />
bandwidth. The central l<strong>in</strong>e for each subfigure represents the<br />
mean-centered band shift as a function of SBW. The <strong>in</strong>nermost<br />
pair of l<strong>in</strong>es about each trajectory, from 0.1 to 3.0 nm,<br />
is the 95% confidence <strong>in</strong>terval, and the outermost l<strong>in</strong>e pair<br />
represents the 95% prediction <strong>in</strong>terval for a s<strong>in</strong>gle future determ<strong>in</strong>ation.<br />
Vertical bars plotted at 0.1, 1.0, and 3.0 nm represent<br />
the U 95 for the measured values reported <strong>in</strong> Table 3.<br />
Additional symbols represent <strong>in</strong>dividual <strong>in</strong>struments report<strong>in</strong>g<br />
data at other SBW values.<br />
For SBWs from 0.1 to 3.0 nm, the values <strong>in</strong> Table 4 represent<br />
certified values as validated by the experimental data<br />
of the multicenter experiment. For SBWs between 3.0 and<br />
10.0 nm, the values are considered to be ‘‘<strong>in</strong>formation values’’<br />
for which the uncerta<strong>in</strong>ty is less well characterized.<br />
4. Conclusions<br />
The establishment of specified absorption bands of a solution<br />
of 40 g/L holmium oxide <strong>in</strong> 10% volume fraction perchloric<br />
acid as certified <strong>in</strong>tr<strong>in</strong>sic wavelength standards that<br />
are fit-for-purpose for most applications <strong>in</strong> chemical spectrophotometry<br />
is supported by various conclusions:<br />
1 Realistic uncerta<strong>in</strong>ties are furnished by the multicenter<br />
approach, which experimentally confounds calibration<br />
uncerta<strong>in</strong>ty <strong>in</strong>to the end result.<br />
2 <strong>Intr<strong>in</strong>sic</strong> band positions as cont<strong>in</strong>uous functions of <strong>in</strong>strumental<br />
spectral bandwidth may be supplied by means<br />
of the theoretical broaden<strong>in</strong>g of the <strong>in</strong>tr<strong>in</strong>sic narrowband<br />
spectrum as validated through the consensus measurements<br />
at discreet spectral bandwidths.<br />
3 Band positions of different preparations of holmium oxide<br />
solution are robust with respect to the orig<strong>in</strong> of materials<br />
and to 20% variations <strong>in</strong> concentration.<br />
HOLMIUM OXIDE SOLUTION<br />
We therefore recommend the certified band positions <strong>in</strong><br />
Table 4 as <strong>in</strong>tr<strong>in</strong>sic wavelength standards <strong>in</strong> the sample temperature<br />
range of 255 °C, applicable to samples of holmium<br />
oxide <strong>in</strong> perchloric acid prepared <strong>in</strong> the manner described<br />
here<strong>in</strong> and with a high-resolution spectrum shown to<br />
be congruent with the <strong>in</strong>tr<strong>in</strong>sic spectrum reported here.<br />
5. Disclaimer<br />
Certa<strong>in</strong> commercial equipment, <strong>in</strong>struments, or materials<br />
are identified <strong>in</strong> this paper to foster understand<strong>in</strong>g. Such<br />
identification does not imply recommendation or endorsement<br />
by the National Institute of <strong>Standard</strong>s and Technology,<br />
nor does it imply that the materials or equipment identified<br />
are necessarily the best available for the purpose.<br />
6. References<br />
55<br />
1 V. R. Weidner, R. Mavrod<strong>in</strong>eanu, K. D. Mielenz, R. A. Velapoldi, K. L.<br />
Eckerle, and B. Adams, J. Res. NBS 90, 1151985.<br />
2 V. R. Weidner, R. Mavrod<strong>in</strong>eanu, K. D. Mielenz, R. A. Velapoldi, K. L.<br />
Eckerle, and B. Adams, NBS Special Publication 260-102, Gaithersburg,<br />
MD, July 1986.<br />
3 USP 28-NF23, United States Pharmacopeial Convention, Inc., Rockville<br />
MD, 2004, General Chapter 851.<br />
4 British Pharmacopoeia, Vol. II The Stationery Office, London, 2002,<br />
Appendix II B, p. A131.<br />
5 European Pharmacopoeia, 4th ed. Council of Europe, Strassbourg,<br />
2001, Method 2.2.25, p. 36.<br />
6 E. N. Rizkalla and G. R. Chopp<strong>in</strong>, J. Alloy. Compd. 180, 3251992.<br />
7 S. N. Misra and S. O. Sommerer, Appl. Spectrosc. Rev. 26, 1511991.<br />
8 K. A. Gschneider, Jr. and L. E. Yr<strong>in</strong>g, Handbook of the Physics<br />
and Chemistry of Rare Earths, Vol. 3 North-Holland, Amsterdam,<br />
1979.<br />
9 J. C. Travis, J. C. Zw<strong>in</strong>kels, F. Mercader, A. Ruiz, E. A. Early, M. V.<br />
Smith, M. Noel, M. Maley, G. W. Kramer, K. L. Eckerle, and D. L.<br />
Duewer, Anal. Chem. 74, 3408 2002.<br />
10 W. T. Carnall, P. R. Fields, and K. Rajnak, J. Chem. Phys. 49, 4424<br />
1968.<br />
11 D. G. Karraker, Inorg. Chem. 6, 18631967.<br />
12 M. T. Devl<strong>in</strong>, E. M. Stephens, and F. S. Richardson, Inorg. Chem. 27,<br />
1517 1988.<br />
13 D. G. Karraker, Inorg. Chem. 3, 473 1968.<br />
14 Society of Japanese Pharmacopoeia, JPXIVYakuji Nippo, Ltd., Tokyo,<br />
2001, General Test 64, p. 103.<br />
15 Pharmacopoeia of the People’s Republic of Ch<strong>in</strong>a, Volume II Chemical<br />
Industry Press, Beij<strong>in</strong>g, 2000, Appendix IV A English Edition 2000.<br />
16 Orig<strong>in</strong>ally produced as Corn<strong>in</strong>g 3130 and 3131 glasses. Produced as Kopp<br />
Glass 3131 s<strong>in</strong>ce the early 1980s. Available from numerous resellers and<br />
from the NIST Calibration Program as ‘‘<strong>Wavelength</strong> <strong>Standard</strong>’’ 38050C<br />
<strong>in</strong> 51 mm by 51 mm format or 38051C <strong>in</strong> cuvette format.<br />
17 Produced as Kopp Glass 5121 and available through optical filter distribu-<br />
tors.<br />
18 European Reference Material ERM-FB010a is produced and sold by LGC<br />
Promochem through LGC, Middx TW11 0LY, U. K. It is a mixture of<br />
holmium and neodymium oxides dissolved <strong>in</strong> dilute perchloric acid. Certified<br />
values are provided for the wavelengths of m<strong>in</strong>imum transmittance<br />
of 16 features spann<strong>in</strong>g the range 219–865 nm at spectral bandwidths of<br />
0.5, 1.0, and 2.0 nm.<br />
19 J. Webster, The Application Notebook Supplement to Spectroscopy, Feb-<br />
ruary 2004, p. 30.<br />
20 The ‘‘McCrone <strong>Standard</strong>’’ is a monocrystall<strong>in</strong>e Nd-doped YAG crystal<br />
produced by McCrone Scientific Ltd, 155a Leighton Road, London NW5<br />
2RD, U. K. The ‘‘Nelson M-42’’ standard is a monocrystall<strong>in</strong>e erbiumdoped<br />
YAG Y1.5Er1.5Al2AlO43 crystal produced by Nelson Gemmological<br />
Instruments, 1 Lyndhurst Road, London NW3 5PX, U. K. The<br />
J. Phys. Chem. Ref. Data, Vol. 34, No. 1, 2005