Performance report primergy rx300 s7 - fujitsu global
Performance report primergy rx300 s7 - fujitsu global
Performance report primergy rx300 s7 - fujitsu global

You also want an ePaper? Increase the reach of your titles
YUMPU automatically turns print PDFs into web optimized ePapers that Google loves.
WHITE PAPER PERFORMANCE REPORT PRIMERGY RX300 S7 VERSION: 1.3 2012-10-09<br />
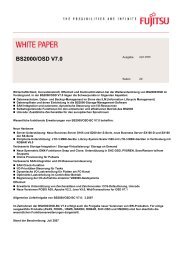
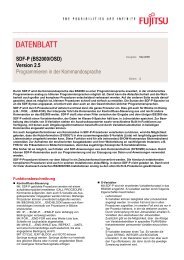
The virtualization-relevant progress in processor technology since 2008 has an effect on the one hand on an<br />
individual VM and, on the other hand, on the possible maximum number of VMs up to CPU full utilization.<br />
The following comparison shows the proportions for both types of improvements. Four systems are<br />
compared with approximately the same processor frequency: a system from 2008 with 2 × Xeon E5420, a<br />
system from 2009 with 2 × Xeon E5540, a system from 2011 with 2 × Xeon E5649 and a current system with<br />
2 × Xeon E5-2670.<br />
vServCon Score<br />
16<br />
14<br />
12<br />
10<br />
8<br />
6<br />
4<br />
2<br />
0<br />
× 1.30<br />
2008<br />
E5420<br />
2.50 GHz<br />
4C<br />
2009<br />
E5540<br />
2.53 GHz<br />
4C<br />
2011<br />
E5649<br />
2.53 GHz<br />
6C<br />
2012<br />
E5-2670<br />
2.60 GHz<br />
8C<br />
2008<br />
E5420<br />
2.50 GHz<br />
4C<br />
2009<br />
E5540<br />
2.53 GHz<br />
4C<br />
2011<br />
E5649<br />
2.53 GHz<br />
6C<br />
2012<br />
E5-2670<br />
2.60 GHz<br />
8C<br />
Year<br />
CPU<br />
Freq.<br />
#Cores<br />
Page 48 (59) © Fujitsu Technology Solutions 2012<br />
× 2.02<br />
× 1.47<br />
× 1.64<br />
2012 TX300 S7 RX200 S7 RX300 S7 RX350 S7 - - BX924 S3 CX250 S1 CX270 S1<br />
2011 TX300 S6 RX200 S6 RX300 S6 TX300 S6 BX620 S6 BX922 S2 BX924 S2 - -<br />
2009 TX300 S5 RX200 S5 RX300 S5 - BX620 S5 - - - -<br />
2008 TX300 S4 RX200 S4 RX300 S4 - BX620 S4 - - - -<br />
The clearest performance improvements arose from 2008 to 2009 with the introduction of the Xeon 5500<br />
processor generation (e. g. via the feature ―Extended Page Tables‖ (EPT) 1 ). One sees an increase of the<br />
vServCon score by a factor of 1.30 with a few VMs (one tile).<br />
With full utilization of the systems with VMs there was an increase by a factor of 2.02. The one reason was<br />
the performance increase that could be achieved for an individual VM (see score for a few VMs). The other<br />
reason was that more VMs were possible with total optimum (via Hyper-Threading). However, it can be seen<br />
that the optimum was ―bought‖ with a triple number of VMs with a reduced performance of the individual VM.<br />
Where exactly is the technology progress between 2009 and 2012? The performance for an individual VM in<br />
low-load situations has basically remained the same for the processors compared here with approximately<br />
the same clock frequency but with different cache size and speed of memory connection. The decisive<br />
progress is in the higher number of physical cores and – associated with it – in the increased values of pure<br />
performance (factor 1.47 and 1.64 in the diagram).<br />
We must explicitly point out that the increased virtualization performance as seen in the score cannot be<br />
completely deemed as an improvement for one individual VM. More than approximately 30% to 50%<br />
increased throughput compared to an identically clocked processor of the Xeon 5400 generation from 2008<br />
is not possible here. <strong>Performance</strong> increases in the virtualization environment since 2009 are mainly achieved<br />
by increased VM numbers due to the increased number of available logical or physical cores.<br />
1 EPT accelerates memory virtualization via hardware support for the mapping between host and guest memory<br />
addresses.<br />
Few VMs (1 Tile)<br />
Virtualization relevant improvements<br />
Score at optimum Tile count