shock dynamometer: where the graphs come from - Roehrig ...
shock dynamometer: where the graphs come from - Roehrig ...
shock dynamometer: where the graphs come from - Roehrig ...

Create successful ePaper yourself
Turn your PDF publications into a flip-book with our unique Google optimized e-Paper software.
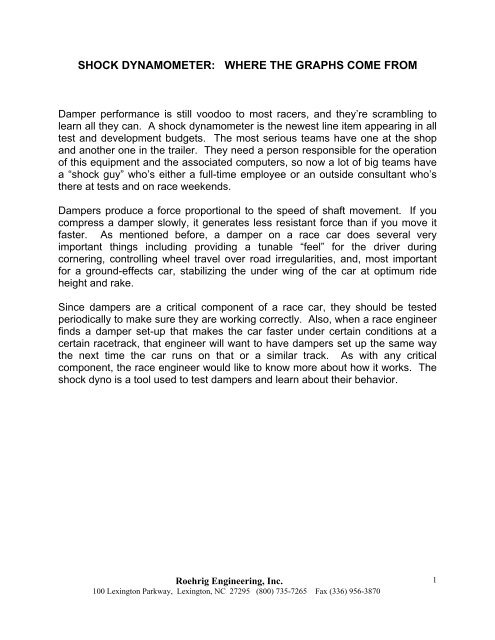
SHOCK DYNAMOMETER: WHERE THE GRAPHS COME FROM<br />
Damper performance is still voodoo to most racers, and <strong>the</strong>y’re scrambling to<br />
learn all <strong>the</strong>y can. A <strong>shock</strong> <strong>dynamometer</strong> is <strong>the</strong> newest line item appearing in all<br />
test and development budgets. The most serious teams have one at <strong>the</strong> shop<br />
and ano<strong>the</strong>r one in <strong>the</strong> trailer. They need a person responsible for <strong>the</strong> operation<br />
of this equipment and <strong>the</strong> associated computers, so now a lot of big teams have<br />
a “<strong>shock</strong> guy” who’s ei<strong>the</strong>r a full-time employee or an outside consultant who’s<br />
<strong>the</strong>re at tests and on race weekends.<br />
Dampers produce a force proportional to <strong>the</strong> speed of shaft movement. If you<br />
compress a damper slowly, it generates less resistant force than if you move it<br />
faster. As mentioned before, a damper on a race car does several very<br />
important things including providing a tunable “feel” for <strong>the</strong> driver during<br />
cornering, controlling wheel travel over road irregularities, and, most important<br />
for a ground-effects car, stabilizing <strong>the</strong> under wing of <strong>the</strong> car at optimum ride<br />
height and rake.<br />
Since dampers are a critical component of a race car, <strong>the</strong>y should be tested<br />
periodically to make sure <strong>the</strong>y are working correctly. Also, when a race engineer<br />
finds a damper set-up that makes <strong>the</strong> car faster under certain conditions at a<br />
certain racetrack, that engineer will want to have dampers set up <strong>the</strong> same way<br />
<strong>the</strong> next time <strong>the</strong> car runs on that or a similar track. As with any critical<br />
component, <strong>the</strong> race engineer would like to know more about how it works. The<br />
<strong>shock</strong> dyno is a tool used to test dampers and learn about <strong>the</strong>ir behavior.<br />
<strong>Roehrig</strong> Engineering, Inc.<br />
100 Lexington Parkway, Lexington, NC 27295 (800) 735-7265 Fax (336) 956-3870<br />
1
What Is a Shock Dyno<br />
The force vs. shaft speed <strong>graphs</strong> you see in this article <strong>come</strong> <strong>from</strong> data<br />
generated by testing a damper in what is generally known as a <strong>shock</strong> dyno or<br />
damper <strong>dynamometer</strong>. This is a machine that compresses and extends a<br />
damper at known speeds and measure <strong>the</strong> forces produced by <strong>the</strong> damper. I’ll<br />
start out by describing <strong>the</strong> simplest form of a <strong>shock</strong> dyno. Figure 1 shows a<br />
frame holding an electric motor with a drive belt and pulleys that spins a crank<br />
attached to <strong>the</strong> damper shaft through a linear bearing. As <strong>the</strong> motor spins <strong>the</strong><br />
crank, <strong>the</strong> damper piston moves up and down just like <strong>the</strong> piston in a cylinder of<br />
an engine. Bolt holes in <strong>the</strong> crank allow several different stroke lengths.<br />
Different pulley diameters or a variable speed motor give different crank rotation<br />
speeds. The load cell measures <strong>the</strong> damper force.<br />
Figure 1<br />
Frame<br />
Load Cell<br />
Linear Bearing<br />
Crank<br />
Motor<br />
BDC<br />
0 Degrees<br />
Velocity = 0<br />
Mid Stroke<br />
Compression<br />
90 Degrees<br />
Velocity = Max<br />
TDC<br />
180 Degrees<br />
Velocity = 0<br />
<strong>Roehrig</strong> Engineering, Inc.<br />
100 Lexington Parkway, Lexington, NC 27295 (800) 735-7265 Fax (336) 956-3870<br />
Mid Stroke<br />
Rebound<br />
270 Degrees<br />
Velocity = Max<br />
2
Shock Dynamometer<br />
We all know that <strong>the</strong> speed of a piston connected to a crank varies continuously<br />
as <strong>the</strong> crank rotates. You might remember <strong>from</strong> high school math or physics that<br />
this type of motion is called sinusoidal because it varies with <strong>the</strong> sine of <strong>the</strong> crank<br />
angle. The piston <strong>come</strong>s to a stop at bottom dead center (BDC), accelerates to<br />
a maximum speed halfway up <strong>the</strong> cylinder, and slows down to a stop again at<br />
<strong>the</strong> top (TDC). If you have a damper attached to a crank, its piston does <strong>the</strong><br />
same, and <strong>the</strong> force generated also varies continuously. We know, however,<br />
that <strong>the</strong> maximum speed of <strong>the</strong> piston happens only once per stroke, when <strong>the</strong><br />
piston is halfway between top and bottom, and that’s also when <strong>the</strong> damper<br />
generates maximum force. With our simple <strong>shock</strong> dyno we could change <strong>the</strong><br />
crank stroke to vary <strong>the</strong> maximum shaft speed and/or we could use drive pulleys<br />
of different sizes. However both of <strong>the</strong>se methods are cumbersome and time<br />
consuming during testing. Variable speed AC motors allow easy manipulation of<br />
<strong>the</strong> crank RPM.<br />
Here’s How It Works<br />
You put a damper in <strong>the</strong> dyno, choose a stroke and RPM, and turn on <strong>the</strong> motor.<br />
The crank turns and <strong>the</strong> damper shaft moves up and down until you turn off <strong>the</strong><br />
motor. If you know <strong>the</strong> crank RPM, and <strong>the</strong> stroke, you can calculate <strong>the</strong><br />
maximum damper shaft speed. For example, let’s say <strong>the</strong> crank turns 100 RPM,<br />
and <strong>the</strong> stroke is I inch. 100 rpm is 1.67 revolutions per second and <strong>the</strong> length of<br />
I revolution is <strong>the</strong> circumference of <strong>the</strong> circle traveled by <strong>the</strong> crank bolt or Pi<br />
times <strong>the</strong> stroke. 1.67 x 3.14 x I inches is about 5 inches per second. This is <strong>the</strong><br />
maximum speed of <strong>the</strong> damper piston, and it happens twice each revolution of<br />
<strong>the</strong> crank, once with <strong>the</strong> piston going up in compression and once again with <strong>the</strong><br />
piston going down in rebound.<br />
If we keep this example really simple and connect <strong>the</strong> damper directly to a<br />
weighing scale with a circular dial, we can stand <strong>the</strong>re and read <strong>the</strong> scale pointer<br />
directly. What we’ll see is <strong>the</strong> pointer cycling <strong>from</strong> 0 to some maximum bump<br />
force as <strong>the</strong> <strong>shock</strong> compresses, returns to 0, and <strong>the</strong>n peaks out again at <strong>the</strong><br />
max. rebound force as <strong>the</strong> piston <strong>come</strong>s back down. The needle on our scale<br />
goes <strong>from</strong> plus some number to minus some number as <strong>the</strong> damper cycles <strong>from</strong><br />
compression to rebound and back. We can just write down <strong>the</strong> numbers at<br />
which <strong>the</strong> needle peaks as it goes back and forth. A commercially available<br />
<strong>shock</strong> dyno uses a computer to read <strong>the</strong> load cell and store <strong>the</strong> data.<br />
<strong>Roehrig</strong> Engineering, Inc.<br />
100 Lexington Parkway, Lexington, NC 27295 (800) 735-7265 Fax (336) 956-3870<br />
3
Some dampers are set up to give more force in rebound than compression so,<br />
as our simple machine cranks away; we might see <strong>the</strong> scale peak at 190 pounds<br />
in compression and 250 pounds in rebound. So we know that, at a shaft speed<br />
of 5 inches per second, <strong>the</strong> damper produces 190 pounds in compression (or<br />
bump) and 250 pounds in rebound. We’d like several data points so we can<br />
draw a curve. If we reduce <strong>the</strong> crank speed to 50 RPM, and 25 RPM, and also<br />
speed it up to 150, and 200 RPM, this gives us five data points. After we make<br />
<strong>the</strong>se runs and read <strong>the</strong> scale we can make a table like this:<br />
Chart 1<br />
CRANK MAX SPEED BUMP FORCE REBOUND FORCE<br />
RPM IN/SEC LBS LBS<br />
25 1.3 75 50<br />
50 2.6 170 150<br />
100 5.2 190 250<br />
150 7.8 220 350<br />
200 10.4 250 470<br />
Presented as a force vs. shaft speed graph, it looks like Figure 2. We generated<br />
this data by running <strong>the</strong> crank at a 1.0” stroke and changing <strong>the</strong> crank RPM to<br />
give us 5 maximum piston speeds, and we read <strong>the</strong> bump and rebound forces at<br />
those maximum speeds. Then we made a graph by connecting <strong>the</strong> dots. If we<br />
want data at higher shaft speeds we need to speed up <strong>the</strong> crank or leng<strong>the</strong>n <strong>the</strong><br />
stroke. Figure 2 shows us that <strong>the</strong> <strong>shock</strong> we tested has a pretty steep rebound<br />
curve while <strong>the</strong> compression curve starts low, rises quickly, and <strong>the</strong>n levels off.<br />
The real benefit of a machine like this <strong>come</strong>s when you test all four dampers off<br />
your race car and find out that <strong>the</strong>y all give different readings even though <strong>the</strong>y<br />
are supposed to have <strong>the</strong> same valving, and you’ve, hopefully, set <strong>the</strong>m all to <strong>the</strong><br />
same external adjustments before you started <strong>the</strong> test. Some small difference in<br />
readings is OK, but <strong>the</strong> closer toge<strong>the</strong>r <strong>the</strong> better. If you’ve got <strong>the</strong> tools and<br />
experience, you can overhaul your <strong>shock</strong>s and test <strong>the</strong>m again. Maybe you’ll find<br />
contaminated oil, bad seals, or worn parts. Shocks wear out like any o<strong>the</strong>r<br />
mechanism and need to be rebuilt periodically.<br />
<strong>Roehrig</strong> Engineering, Inc.<br />
100 Lexington Parkway, Lexington, NC 27295 (800) 735-7265 Fax (336) 956-3870<br />
4
Force (pounds)<br />
Figure 2<br />
500<br />
400<br />
300<br />
200<br />
100<br />
0<br />
-100<br />
-200<br />
-300<br />
-400<br />
-500<br />
0 2 4 6 8<br />
Velocity (ips)<br />
A <strong>shock</strong> dyno also allows you to see <strong>the</strong> effects of external adjustments. If <strong>the</strong><br />
data above represents settings in <strong>the</strong> middle of <strong>the</strong> range of adjustments, varying<br />
<strong>the</strong>m in increments <strong>from</strong> full-hard to full-soft will give you curves that show <strong>the</strong><br />
effect of those changes. That will happen if your dampers produce changes big<br />
enough to be seen by your machine. If you really are just reading a scale by eye<br />
you might miss some fine points. That’s why people buy dynos instead of<br />
building <strong>the</strong>m<br />
Figure 2 above came <strong>from</strong> data generated by looking at maximum or peak<br />
velocities. This is called Peak Velocity Pickoff, and that’s <strong>the</strong> way a simple dyno<br />
works. We varied crank speed and <strong>the</strong> damper stroke to give us peak velocities<br />
in our range of interest.<br />
<strong>Roehrig</strong> Engineering, Inc.<br />
100 Lexington Parkway, Lexington, NC 27295 (800) 735-7265 Fax (336) 956-3870<br />
10<br />
5
Data <strong>from</strong> an Entire Cycle<br />
You can get more data <strong>from</strong> a damper by taking data over a complete cycle of<br />
compression and rebound and graphing that. This is called a Continuous<br />
Velocity Plot, and <strong>the</strong>re are commercially available damper <strong>dynamometer</strong>s that<br />
do this. Figure 1 has notations around <strong>the</strong> crank for Bottom Dead Center (BDC,0<br />
deg.), Top Dead Center (TDC,180 deg.), and 90/270 degrees. When <strong>the</strong> crank<br />
pin is at BDC <strong>the</strong> damper is fully extended. As <strong>the</strong> crank rotates clockwise it’s<br />
compressing <strong>the</strong> <strong>shock</strong> in <strong>the</strong> bump direction so that <strong>the</strong> damper piston<br />
accelerates <strong>from</strong> a stop to maximum speed at 90 degrees and <strong>the</strong>n slows to a<br />
stop again at TDC. Rotation continues and <strong>the</strong> piston accelerates in rebound<br />
direction to maximum speed at 270 degrees and slows to a stop again at BDC.<br />
Figure 3 shows force data taken continuously during one revolution of <strong>the</strong> crank.<br />
Shaft speed in <strong>the</strong> down direction is positive and compression force is positive.<br />
The bottom part of <strong>the</strong> curve shows shaft speed and negative force increasing as<br />
<strong>the</strong> crank goes <strong>from</strong> TDC (180 deg.) to 270 degrees and <strong>the</strong>n decreasing as <strong>the</strong><br />
curve goes back toward zero speed and force at BDC (0 deg.). As rotation<br />
continues, speed goes negative (compression) and force increases to a<br />
maximum at 90 degrees and back to 0 at TDC (180 deg.). The speed and force<br />
data taken to produce a graph like this <strong>come</strong>s <strong>from</strong> a velocity sensor and a<br />
strain-gauge load cell. A data acquisition system in a personal computer reads<br />
<strong>the</strong>se sensors 1,000 times a cycle or more. Software processes <strong>the</strong> data and<br />
displays it in this form.<br />
This can be confusing and you might have to look at this sketch and <strong>the</strong> graph a<br />
while before it be<strong>come</strong>s clear. The important point is <strong>the</strong> force increases with<br />
piston speed. On <strong>the</strong> lower section of <strong>the</strong> curve <strong>the</strong> piston is accelerating <strong>where</strong><br />
<strong>the</strong> curve is headed down and slowing down as <strong>the</strong> curve swings back up. It’s<br />
<strong>the</strong> same on <strong>the</strong> top part. The piston speed and damping force increase to a<br />
maximum and <strong>the</strong>n slow again. This is a lot more data than we had when we<br />
just changed crank RPM and looked at <strong>the</strong> damper force at maximum piston<br />
speed. So why doesn’t <strong>the</strong> damper develop <strong>the</strong> same force when it’s slowing<br />
down as it did when it speeded up? I’m not certain, myself, but remember you’ve<br />
got a bunch of oil moving through <strong>the</strong> washer stacks and bypass paths, and it<br />
has some mass and momentum. Those washer valves do not necessarily close<br />
<strong>the</strong> same way <strong>the</strong>y open. Also, <strong>the</strong> fact that <strong>the</strong> damper piston is always<br />
accelerating, slowing down or speeding up, may have something to do with <strong>the</strong><br />
shape of this curve.<br />
<strong>Roehrig</strong> Engineering, Inc.<br />
100 Lexington Parkway, Lexington, NC 27295 (800) 735-7265 Fax (336) 956-3870<br />
6
Figure 3<br />
Mid Stroke<br />
90 Degrees<br />
Peak Compression Velocity<br />
500<br />
375<br />
250<br />
125<br />
0<br />
-375<br />
-500<br />
TDC 180 Degrees<br />
Zero Velocity<br />
-10 -5<br />
BDC 0<br />
-125<br />
0 5<br />
Mid Stroke<br />
10<br />
Degrees<br />
-250<br />
270 Degrees<br />
Peak Rebound Velocity<br />
<strong>Roehrig</strong> Engineering, Inc.<br />
100 Lexington Parkway, Lexington, NC 27295 (800) 735-7265 Fax (336) 956-3870<br />
7