Journal of Indian Academy of Forensic Medicine (JIAFM)
Journal of Indian Academy of Forensic Medicine (JIAFM)
Journal of Indian Academy of Forensic Medicine (JIAFM)

You also want an ePaper? Increase the reach of your titles
YUMPU automatically turns print PDFs into web optimized ePapers that Google loves.
<strong>JIAFM</strong>, 2007 29 (2) ISSN: 0971-0973<br />
yrs. Thus maximum 103(51.5%) victims belonged to culpable homicides <strong>of</strong> which sharp cutting weapon<br />
the age group <strong>of</strong> 21-40 yrs. 285 different weapons 31(10.88%) used.<br />
used to inflict the injuries on 200 dead bodies <strong>of</strong><br />
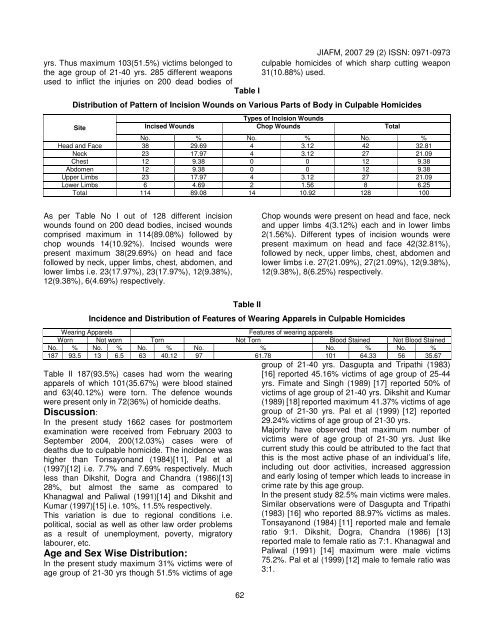
Table I<br />
Distribution <strong>of</strong> Pattern <strong>of</strong> Incision Wounds on Various Parts <strong>of</strong> Body in Culpable Homicides<br />
Site<br />
Types <strong>of</strong> Incision Wounds<br />
Incised Wounds Chop Wounds Total<br />
No. % No. % No. %<br />
Head and Face 38 29.69 4 3.12 42 32.81<br />
Neck 23 17.97 4 3.12 27 21.09<br />
Chest 12 9.38 0 0 12 9.38<br />
Abdomen 12 9.38 0 0 12 9.38<br />
Upper Limbs 23 17.97 4 3.12 27 21.09<br />
Lower Limbs 6 4.69 2 1.56 8 6.25<br />
Total 114 89.08 14 10.92 128 100<br />
As per Table No I out <strong>of</strong> 128 different incision<br />
wounds found on 200 dead bodies, incised wounds<br />
comprised maximum in 114(89.08%) followed by<br />
chop wounds 14(10.92%). Incised wounds were<br />
present maximum 38(29.69%) on head and face<br />
followed by neck, upper limbs, chest, abdomen, and<br />
lower limbs i.e. 23(17.97%), 23(17.97%), 12(9.38%),<br />
12(9.38%), 6(4.69%) respectively.<br />
Table II<br />
62<br />
Chop wounds were present on head and face, neck<br />
and upper limbs 4(3.12%) each and in lower limbs<br />
2(1.56%). Different types <strong>of</strong> incision wounds were<br />
present maximum on head and face 42(32.81%),<br />
followed by neck, upper limbs, chest, abdomen and<br />
lower limbs i.e. 27(21.09%), 27(21.09%), 12(9.38%),<br />
12(9.38%), 8(6.25%) respectively.<br />
Incidence and Distribution <strong>of</strong> Features <strong>of</strong> Wearing Apparels in Culpable Homicides<br />
Wearing Apparels Features <strong>of</strong> wearing apparels<br />
Worn Not worn Torn Not Torn Blood Stained Not Blood Stained<br />
No. % No. % No. % No. % No. % No. %<br />
187 93.5 13 6.5 63 40.12 97 61.78 101 64.33 56 35.67<br />
Table II 187(93.5%) cases had worn the wearing<br />
apparels <strong>of</strong> which 101(35.67%) were blood stained<br />
and 63(40.12%) were torn. The defence wounds<br />
were present only in 72(36%) <strong>of</strong> homicide deaths.<br />
Discussion:<br />
In the present study 1662 cases for postmortem<br />
examination were received from February 2003 to<br />
September 2004, 200(12.03%) cases were <strong>of</strong><br />
deaths due to culpable homicide. The incidence was<br />
higher than Tonsayonand (1984)[11], Pal et al<br />
(1997)[12] i.e. 7.7% and 7.69% respectively. Much<br />
less than Dikshit, Dogra and Chandra (1986)[13]<br />
28%, but almost the same as compared to<br />
Khanagwal and Paliwal (1991)[14] and Dikshit and<br />
Kumar (1997)[15] i.e. 10%, 11.5% respectively.<br />
This variation is due to regional conditions i.e.<br />
political, social as well as other law order problems<br />
as a result <strong>of</strong> unemployment, poverty, migratory<br />
labourer, etc.<br />
Age and Sex Wise Distribution:<br />
In the present study maximum 31% victims were <strong>of</strong><br />
age group <strong>of</strong> 21-30 yrs though 51.5% victims <strong>of</strong> age<br />
group <strong>of</strong> 21-40 yrs. Dasgupta and Tripathi (1983)<br />
[16] reported 45.16% victims <strong>of</strong> age group <strong>of</strong> 25-44<br />
yrs. Fimate and Singh (1989) [17] reported 50% <strong>of</strong><br />
victims <strong>of</strong> age group <strong>of</strong> 21-40 yrs. Dikshit and Kumar<br />
(1989) [18] reported maximum 41.37% victims <strong>of</strong> age<br />
group <strong>of</strong> 21-30 yrs. Pal et al (1999) [12] reported<br />
29.24% victims <strong>of</strong> age group <strong>of</strong> 21-30 yrs.<br />
Majority have observed that maximum number <strong>of</strong><br />
victims were <strong>of</strong> age group <strong>of</strong> 21-30 yrs. Just like<br />
current study this could be attributed to the fact that<br />
this is the most active phase <strong>of</strong> an individual’s life,<br />
including out door activities, increased aggression<br />
and early losing <strong>of</strong> temper which leads to increase in<br />
crime rate by this age group.<br />
In the present study 82.5% main victims were males.<br />
Similar observations were <strong>of</strong> Dasgupta and Tripathi<br />
(1983) [16] who reported 88.97% victims as males.<br />
Tonsayanond (1984) [11] reported male and female<br />
ratio 9:1. Dikshit, Dogra, Chandra (1986) [13]<br />
reported male to female ratio as 7:1. Khanagwal and<br />
Paliwal (1991) [14] maximum were male victims<br />
75.2%. Pal et al (1999) [12] male to female ratio was<br />
3:1.