Forewarning Rice Blast in India
Forewarning Rice Blast in India
Forewarning Rice Blast in India

You also want an ePaper? Increase the reach of your titles
YUMPU automatically turns print PDFs into web optimized ePapers that Google loves.
<strong>Forewarn<strong>in</strong>g</strong> <strong>Rice</strong> <strong>Blast</strong> <strong>in</strong> <strong>India</strong><br />
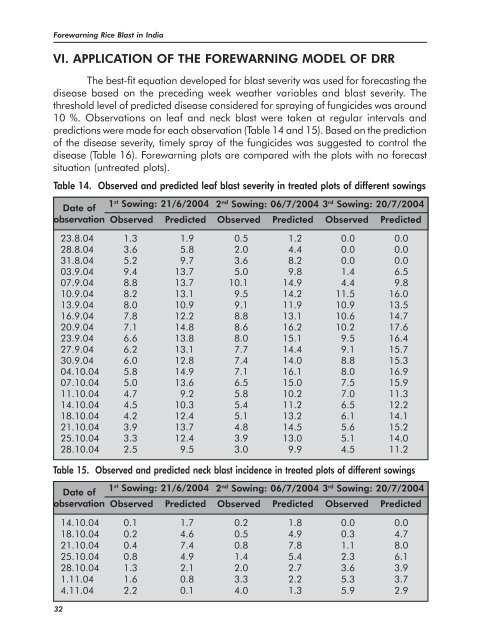
VI. APPLICATION OF THE FOREWARNING MODEL OF DRR<br />
The best-fit equation developed for blast severity was used for forecast<strong>in</strong>g the<br />
disease based on the preced<strong>in</strong>g week weather variables and blast severity. The<br />
threshold level of predicted disease considered for spray<strong>in</strong>g of fungicides was around<br />
10 %. Observations on leaf and neck blast were taken at regular <strong>in</strong>tervals and<br />
predictions were made for each observation (Table 14 and 15). Based on the prediction<br />
of the disease severity, timely spray of the fungicides was suggested to control the<br />
disease (Table 16). <strong>Forewarn<strong>in</strong>g</strong> plots are compared with the plots with no forecast<br />
situation (untreated plots).<br />
Table 14. Observed and predicted leaf blast severity <strong>in</strong> treated plots of different sow<strong>in</strong>gs<br />
Date of<br />
1<br />
observation<br />
st Sow<strong>in</strong>g: 21/6/2004 2nd Sow<strong>in</strong>g: 06/7/2004 3rd Sow<strong>in</strong>g: 20/7/2004<br />
Observed Predicted Observed Predicted Observed Predicted<br />
23.8.04 1.3 1.9 0.5 1.2 0.0 0.0<br />
28.8.04 3.6 5.8 2.0 4.4 0.0 0.0<br />
31.8.04 5.2 9.7 3.6 8.2 0.0 0.0<br />
03.9.04 9.4 13.7 5.0 9.8 1.4 6.5<br />
07.9.04 8.8 13.7 10.1 14.9 4.4 9.8<br />
10.9.04 8.2 13.1 9.5 14.2 11.5 16.0<br />
13.9.04 8.0 10.9 9.1 11.9 10.9 13.5<br />
16.9.04 7.8 12.2 8.8 13.1 10.6 14.7<br />
20.9.04 7.1 14.8 8.6 16.2 10.2 17.6<br />
23.9.04 6.6 13.8 8.0 15.1 9.5 16.4<br />
27.9.04 6.2 13.1 7.7 14.4 9.1 15.7<br />
30.9.04 6.0 12.8 7.4 14.0 8.8 15.3<br />
04.10.04 5.8 14.9 7.1 16.1 8.0 16.9<br />
07.10.04 5.0 13.6 6.5 15.0 7.5 15.9<br />
11.10.04 4.7 9.2 5.8 10.2 7.0 11.3<br />
14.10.04 4.5 10.3 5.4 11.2 6.5 12.2<br />
18.10.04 4.2 12.4 5.1 13.2 6.1 14.1<br />
21.10.04 3.9 13.7 4.8 14.5 5.6 15.2<br />
25.10.04 3.3 12.4 3.9 13.0 5.1 14.0<br />
28.10.04 2.5 9.5 3.0 9.9 4.5 11.2<br />
Table 15. Observed and predicted neck blast <strong>in</strong>cidence <strong>in</strong> treated plots of different sow<strong>in</strong>gs<br />
Date of<br />
1<br />
observation<br />
st Sow<strong>in</strong>g: 21/6/2004 2nd Sow<strong>in</strong>g: 06/7/2004 3rd Sow<strong>in</strong>g: 20/7/2004<br />
Observed Predicted Observed Predicted Observed Predicted<br />
32<br />
14.10.04 0.1 1.7 0.2 1.8 0.0 0.0<br />
18.10.04 0.2 4.6 0.5 4.9 0.3 4.7<br />
21.10.04 0.4 7.4 0.8 7.8 1.1 8.0<br />
25.10.04 0.8 4.9 1.4 5.4 2.3 6.1<br />
28.10.04 1.3 2.1 2.0 2.7 3.6 3.9<br />
1.11.04 1.6 0.8 3.3 2.2 5.3 3.7<br />
4.11.04 2.2 0.1 4.0 1.3 5.9 2.9