Download - Universiteit Gent
Download - Universiteit Gent
Download - Universiteit Gent

Create successful ePaper yourself
Turn your PDF publications into a flip-book with our unique Google optimized e-Paper software.
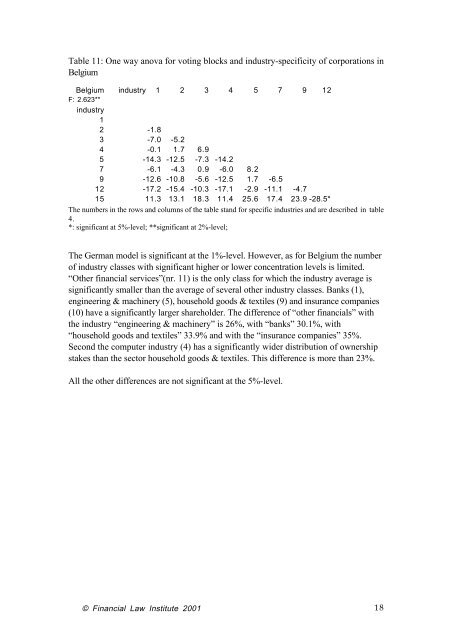
Table 11: One way anova for voting blocks and industry-specificity of corporations in<br />
Belgium<br />
Belgium industry 1 2 3 4 5 7 9 12<br />
F: 2.623**<br />
industry<br />
1<br />
2 -1.8<br />
3 -7.0 -5.2<br />
4 -0.1 1.7 6.9<br />
5 -14.3 -12.5 -7.3 -14.2<br />
7 -6.1 -4.3 0.9 -6.0 8.2<br />
9 -12.6 -10.8 -5.6 -12.5 1.7 -6.5<br />
12 -17.2 -15.4 -10.3 -17.1 -2.9 -11.1 -4.7<br />
15 11.3 13.1 18.3 11.4 25.6 17.4 23.9 -28.5*<br />
The numbers in the rows and columns of the table stand for specific industries and are described in table<br />
4.<br />
*: significant at 5%-level; **significant at 2%-level;<br />
The German model is significant at the 1%-level. However, as for Belgium the number<br />
of industry classes with significant higher or lower concentration levels is limited.<br />
ÒOther financial servicesÓ(nr. 11) is the only class for which the industry average is<br />
significantly smaller than the average of several other industry classes. Banks (1),<br />
engineering & machinery (5), household goods & textiles (9) and insurance companies<br />
(10) have a significantly larger shareholder. The difference of Òother financialsÓ with<br />
the industry Òengineering & machineryÓ is 26%, with ÒbanksÓ 30.1%, with<br />
Òhousehold goods and textilesÓ 33.9% and with the Òinsurance companiesÓ 35%.<br />
Second the computer industry (4) has a significantly wider distribution of ownership<br />
stakes than the sector household goods & textiles. This difference is more than 23%.<br />
All the other differences are not significant at the 5%-level.<br />
© Financial Law Institute 2001 18