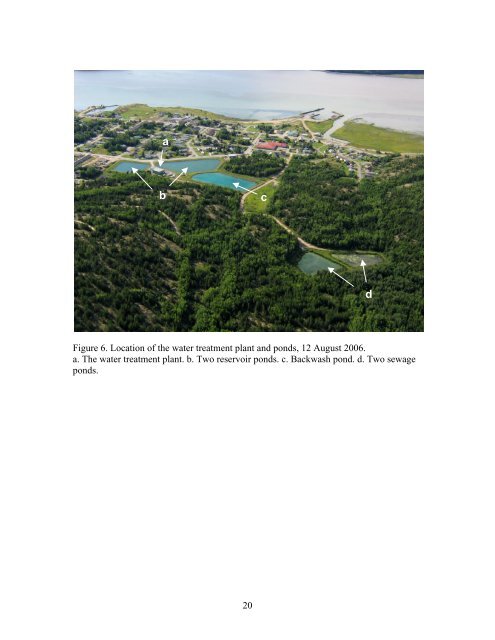
a b Figure 6. Lo<strong>ca</strong>tion of the water treatment plant and ponds, 12 August 2006. a. The water treatment plant. b. Two reservoir ponds. c. Backwash pond. d. Two sewage ponds. 20 c d
RESULTS and DISCUSSION 1. Regulatory Guidelines and Pre-existing Regional Data Guidelines are prepared by government agencies as a means of summarizing information about water, sediment, air, food, or other natural or manufactured products. A guideline may be developed by a government agency as a regulatory limit used in enforcement of laws. A guideline may be developed to provide information to consumers as to what is safe to eat or drink. Alternatively, guidelines may be developed to inform the public about the levels of contaminants that would be expected to produce a given effect on an organism or a system. In any <strong>ca</strong>se, a guideline is subject to change over time and to differ among jurisdictions. <strong>As</strong> a general rule, the guideline for a particular water or sediment quality parameter tends to decrease over time as more information comes to light. For example, in 1978, the Canadian maximum acceptable concentration for arsenic in drinking water was 50 µg/L. By 2002, the Canadian environmental quality arsenic drinking guideline had fallen to 25 µg/L. Presently, Health Canada (2006b) proposes a maximum acceptable concentration of 5 µg/L arsenic. Similarly, if we compare a guideline across <strong>ca</strong>tegories or jurisdictions, a wide variation may be found. In the <strong>ca</strong>se of human consumption of fish containing mercury, the present Canadian mercury guideline is 0.5 mg/kg for general consumers, 0.2 mg/kg for subsistence fishers, while the US EPA mercury consumption guideline is 0.40 mg/kg for recreational fishers and 0.049 mg/kg for subsistence fishers. Guidelines then, are simply that—they are meant to guide discussion and to structure knowledge. Whether the value for a chemi<strong>ca</strong>l, biologi<strong>ca</strong>l, or physi<strong>ca</strong>l parameter is acceptable or not is subject to change over time and to vary between jurisdictions or between individual risk profiles. Nor should failure to exceed a guideline be interpreted as a ‘safe’ condition. Some people, e.g., babies and people with weakened immune systems, are b more susceptible to c contaminants than other people. The human body does not face a single contaminant or stressor in the course of a lifetime. Instead, we are immersed in a milieu of stressors that change over time and differ among people. One person might face a contaminant burden of stored, fat soluble organochlorine pesticides, PCBs, and dioxins. Another person might face a contaminant burden of arsenic, mercury, and lead. It could well be that neither person has concentrations of these toxins that exceed individual guidelines. Yet the combined contaminant burden in either person might result in an adverse health effect. Pre<strong>ca</strong>utionary common sense dictates, then, that responsible agencies should seek to minimize the overall contaminant burden faced by each person. Tables 3 and 4 list relevant current water and sediment quality guidelines. Table 5 provides a summary of some regional observations of relevant water and sediment quality data. These data, and others not included in Table 5, provide a context for discussion of the results. I apologize for the difficulty in reading Table 5 but I have tried to collate a large amount of data into one table. The primary challenge to making comparisons of regional water and sediment quality is the absence of standardized statisti<strong>ca</strong>l reporting. Many data are presented in reports in summary form without supporting raw data or information on the form of the statisti<strong>ca</strong>l distributions, means, medians, quartiles, percentiles, and other measures. 21
- Page 1 and 2: A STUDY OF WATER AND SEDIMENT QUALI
- Page 3 and 4: TABLE OF CONTENTS Section Page SUMM
- Page 5 and 6: (9) A peer-reviewed epidemiologic a
- Page 7 and 8: concerned citizen of Fort Chipewyan
- Page 9 and 10: and fecal coliform bacteria. These
- Page 11 and 12: options. Geologic deposits may diff
- Page 13 and 14: Coliform bacteria are useful indica
- Page 15 and 16: Table 1. Water quality parameters a
- Page 17 and 18: a b Canoe Pass 17 Sample Site Figur
- Page 19: a b Water Treatment Plant Water Int
- Page 23 and 24: Table 3. Canadian water and sedimen
- Page 25 and 26: Table 5. A summary of some water an
- Page 27 and 28: maximum 5 mg/L; median 1 mg/L AR be
- Page 29 and 30: Comparison of the various datasets
- Page 31 and 32: Polycyclic Aromatic Hydrocarbons (P
- Page 33 and 34: The largest exceedences were for al
- Page 35 and 36: Table 8. Concentrations of dioxins
- Page 37 and 38: Arsenic, Mercury, and Other Heavy M
- Page 39 and 40: Polycyclic Aromatic Hydrocarbons (P
- Page 41 and 42: Table 13. Exceedences of sediment q
- Page 43 and 44: Total PAHs (mg/kg) 1.6 1.5 1.4 1.3
- Page 45 and 46: Table 14. Concentrations of dioxins
- Page 47 and 48: Ducks in the spring, beavers, and m
- Page 49 and 50: Air pollution. The other day, at Bi
- Page 51 and 52: iver was opened approximately ½ mi
- Page 53 and 54: From the Edmonton Journal, 23 Octob
- Page 55 and 56: The Tar Island Dike is a hydraulic
- Page 57 and 58: 3. Mercury in Walleye (Pickerel) an
- Page 59 and 60: Mercury Concentration (mg/kg) 0.8 0
- Page 61 and 62: 4. Fish Deformities Scientific Data
- Page 63 and 64: Possible Causes for the Fish Abnorm
- Page 65 and 66: 4. The arsenic levels assumed by th
- Page 67 and 68: at the Fort Chipewyan water intake
- Page 69 and 70: In water, chemical constituents of
- Page 71 and 72:
moot is that levels of some environ
- Page 73 and 74:
The people of Fort Chipewyan deserv
- Page 75 and 76:
ATSDR. 1995. Public Health Statemen
- Page 77 and 78:
Health Canada. 2006b. Guidelines fo
- Page 79 and 80:
Page, D. S., P. D. Boehm, G. C. Dou
- Page 81 and 82:
Treasury Board of Canada. 2005. Sit