

A Study Of Water And Sediment Quality As - TO THE TAR SANDS .ca
A Study Of Water And Sediment Quality As - TO THE TAR SANDS .ca
A Study Of Water And Sediment Quality As - TO THE TAR SANDS .ca

Create successful ePaper yourself
Turn your PDF publications into a flip-book with our unique Google optimized e-Paper software.
Other Heavy Metals<br />
Lead, chromium, copper, vanadium, and zinc, assessed by Bourbonniere et al.<br />
(1996) exhibited a nearly constant concentration with depth. Zinc and copper<br />
concentrations were relatively high over western Lake Athabas<strong>ca</strong>. Those authors noted<br />
that their concentrations for copper, zinc, arsenic, and total mercury agreed well with the<br />
results of Allan and Jackson (1978) from Lake Athabas<strong>ca</strong>. They concluded “that many of<br />
these metals have sources in the western part of the lake and probably move offshore<br />
according to grain size. An increasing trend from river to delta to lake for many of the<br />
same metals studied was reported by Allan and Jackson (1978).”<br />
Cadmium levels in all of the surface sediments (sites G, F, B, D, and I) exceeded<br />
the interim sediment quality guideline of 0.6 mg/kg by a factor to 3 to 4 times the<br />
guideline.<br />
Imperial Oil (2006, their Table 5-29) noted an exceedence for a maximum<br />
concentration of chromium (ISQG 37.3 mg/kg) of 61.3 mg/kg (Athabas<strong>ca</strong> River, between<br />
Fort Creek and Embarras, fall 1997-2003, n=21; and two of three observations during<br />
summer 1976-95 were also in excess of guideline: 54 and 85 mg/kg).<br />
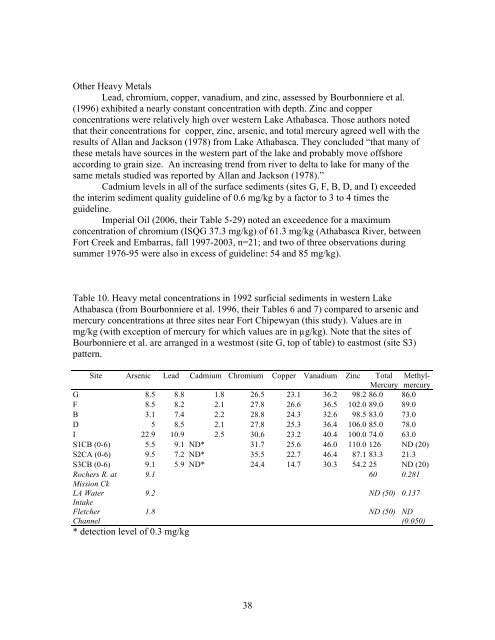
Table 10. Heavy metal concentrations in 1992 surficial sediments in western Lake<br />
Athabas<strong>ca</strong> (from Bourbonniere et al. 1996, their Tables 6 and 7) compared to arsenic and<br />
mercury concentrations at three sites near Fort Chipewyan (this study). Values are in<br />
mg/kg (with exception of mercury for which values are in µg/kg). Note that the sites of<br />
Bourbonniere et al. are arranged in a westmost (site G, top of table) to eastmost (site S3)<br />
pattern.<br />
Site Arsenic Lead Cadmium Chromium Copper Vanadium Zinc Total Methyl-<br />
Mercury mercury<br />
G 8.5 8.8 1.8 26.5 23.1 36.2 98.2 86.0 86.0<br />
F 8.5 8.2 2.1 27.8 26.6 36.5 102.0 89.0 89.0<br />
B 3.1 7.4 2.2 28.8 24.3 32.6 98.5 83.0 73.0<br />
D 5 8.5 2.1 27.8 25.3 36.4 106.0 85.0 78.0<br />
I 22.9 10.9 2.5 30.6 23.2 40.4 100.0 74.0 63.0<br />
S1CB (0-6) 5.5 9.1 ND* 31.7 25.6 46.0 110.0 126 ND (20)<br />
S2CA (0-6) 9.5 7.2 ND* 35.5 22.7 46.4 87.1 83.3 21.3<br />
S3CB (0-6) 9.1 5.9 ND* 24.4 14.7 30.3 54.2 25 ND (20)<br />
Rochers R. at<br />
Mission Ck<br />
9.1 60 0.281<br />
LA <strong>Water</strong><br />
9.2 ND (50) 0.137<br />
Intake<br />
Fletcher<br />
Channel<br />
* detection level of 0.3 mg/kg<br />
1.8 ND (50) ND<br />
(0.050)<br />
38