Hindoostan Mills Limited - BSE
Hindoostan Mills Limited - BSE
Hindoostan Mills Limited - BSE

You also want an ePaper? Increase the reach of your titles
YUMPU automatically turns print PDFs into web optimized ePapers that Google loves.
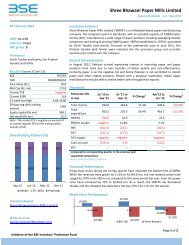
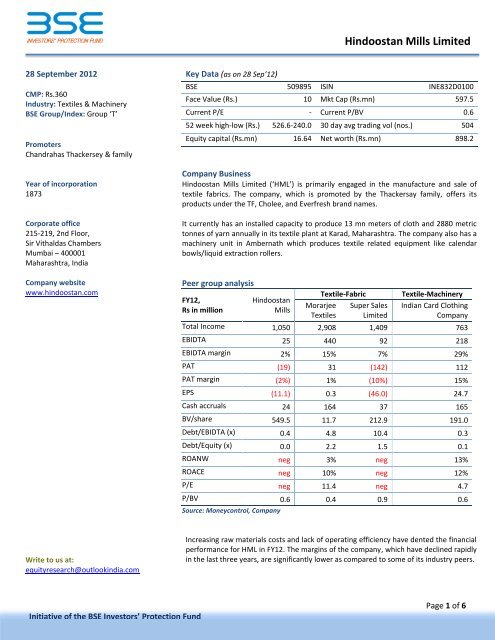
28 September 2012<br />
CMP: Rs.360<br />
Industry: Textiles & Machinery<br />
<strong>BSE</strong> Group/Index: Group ‘T’<br />
Promoters<br />
Chandrahas Thackersey & family<br />
Year of incorporation<br />
1873<br />
Corporate office<br />
215-219, 2nd Floor,<br />
Sir Vithaldas Chambers<br />
Mumbai – 400001<br />
Maharashtra, India<br />
Company website<br />
www.hindoostan.com<br />
Write to us at:<br />
equityresearch@outlookindia.com<br />
Initiative of the <strong>BSE</strong> Investors’ Protection Fund<br />
Key Data (as on 28 Sep’12)<br />
<strong>Hindoostan</strong> <strong>Mills</strong> <strong>Limited</strong><br />
<strong>BSE</strong> 509895 ISIN INE832D0100<br />
Face Value (Rs.) 10 Mkt Cap (Rs.mn) 597.5<br />
Current P/E - Current P/BV 0.6<br />
52 week high-low (Rs.) 526.6-240.0 30 day avg trading vol (nos.) 504<br />
Equity capital (Rs.mn) 16.64 Net worth (Rs.mn) 898.2<br />
Company Business<br />
<strong>Hindoostan</strong> <strong>Mills</strong> <strong>Limited</strong> (‘HML’) is primarily engaged in the manufacture and sale of<br />
textile fabrics. The company, which is promoted by the Thackersay family, offers its<br />
products under the TF, Cholee, and Everfresh brand names.<br />
It currently has an installed capacity to produce 13 mn meters of cloth and 2880 metric<br />
tonnes of yarn annually in its textile plant at Karad, Maharashtra. The company also has a<br />
machinery unit in Ambernath which produces textile related equipment like calendar<br />
bowls/liquid extraction rollers.<br />
Peer group analysis<br />
FY12,<br />
Rs in million<br />
<strong>Hindoostan</strong><br />
<strong>Mills</strong><br />
Textile-Fabric Textile-Machinery<br />
Morarjee<br />
Textiles<br />
Super Sales<br />
<strong>Limited</strong><br />
Indian Card Clothing<br />
Company<br />
Total Income 1,050 2,908 1,409 763<br />
EBIDTA 25 440 92 218<br />
EBIDTA margin 2% 15% 7% 29%<br />
PAT (19) 31 (142) 112<br />
PAT margin (2%) 1% (10%) 15%<br />
EPS (11.1) 0.3 (46.0) 24.7<br />
Cash accruals 24 164 37 165<br />
BV/share 549.5 11.7 212.9 191.0<br />
Debt/EBIDTA (x) 0.4 4.8 10.4 0.3<br />
Debt/Equity (x) 0.0 2.2 1.5 0.1<br />
ROANW neg 3% neg 13%<br />
ROACE neg 10% neg 12%<br />
P/E neg 11.4 neg 4.7<br />
P/BV 0.6 0.4 0.9 0.6<br />
Source: Moneycontrol, Company<br />
Increasing raw materials costs and lack of operating efficiency have dented the financial<br />
performance for HML in FY12. The margins of the company, which have declined rapidly<br />
in the last three years, are significantly lower as compared to some of its industry peers.<br />
Page 1 of 6
Business capacities and production Share Price Performance<br />
Business Capacity Annual<br />
Cloth 13,000,000 meters<br />
Calendar Bowls 400 nos.<br />
Yarn 2880 metric tonnes<br />
Production Annual<br />
Cloth 12,799,000 meters<br />
Calendar Bowls 351 nos.<br />
Yarn 2669 metric tonnes<br />
figures for FY11<br />
Top Public Shareholders with >1% shareholding<br />
Sl. No. Name of the Shareholder<br />
Initiative of the <strong>BSE</strong> Investors’ Protection Fund<br />
No. of Shares held<br />
(thousands)<br />
<strong>Hindoostan</strong> <strong>Mills</strong> <strong>Limited</strong><br />
Shares as % of<br />
Total No. of Shares<br />
1 CZAR Realty Pvt Ltd 35.3 2.1<br />
2 Harsha Hitesh Jhaveri 20.0 1.2<br />
3 Hiren Naresh Kara 65.4 3.9<br />
4 Hitesh Ramji Jhaveri 22.7 1.4<br />
5 Naresh Ranjitsinh Kara 32.2 1.9<br />
6 National Insurance Company Ltd 30.0 1.8<br />
7 Yogesh Uttamlal Mehta 20.2 1.2<br />
Total 225.9 13.6<br />
Change in Shareholding Pattern (%)<br />
Year Promoters DII FII Others<br />
Jun-12 51.6% 1.9% - 46.5%<br />
Mar-12 51.6% 1.9% - 46.5%<br />
Dec-11 51.6% 1.9% - 46.5%<br />
Sep-11 51.6% 1.9% - 46.5%<br />
Mar-11 63.8% 4.3% - 32.0%<br />
Mar-10 69.1% 3.6% - 27.3%<br />
Mar-09 69.1% 3.6% - 27.3%<br />
Mar-08 69.1% 3.6% - 27.3%<br />
10%<br />
0%<br />
-10%<br />
-20%<br />
-30%<br />
-40%<br />
-23%<br />
*2 yr = October 2010 to September 2012<br />
Shareholding Pattern (%)<br />
46.51%<br />
-32%<br />
1.93%<br />
4%<br />
2 YR 1 YR<br />
HML <strong>BSE</strong> Small Cap<br />
51.56%<br />
Promoters DII FII Others<br />
1%<br />
Page 2 of 6
Debt free company<br />
Shift in consumer preferences<br />
Increased competition in exports<br />
Volatility in raw material prices and<br />
availability<br />
Key contributor to economy<br />
Fragmented industry structure<br />
Roll manufacturing business<br />
Government intervention<br />
Key strengths<br />
<strong>Hindoostan</strong> <strong>Mills</strong> <strong>Limited</strong><br />
Due to the prevailing high interest rate environment, most of the debt-laden textile<br />
companies have faced downward pressure on their margins due to increased interest<br />
expenses. However, HML has not availed of any loans from banks in the last few years.<br />
The debt-free status has been one of the key strengths of the company vis-à-vis its<br />
peers and is expected to facilitate its recovery process.<br />
Key concerns<br />
While cotton fabric constituted 60% of the total textile production in the mid-90s, the<br />
share has steadily come down over the last 15 years and by 2008-09, the share of<br />
cotton fabrics had decreased to 48%. This is attributable to a shift in consumer<br />
preferences and growing demand for non-cotton fabrics such as polyester, silk, wool<br />
and khadi.<br />
Textile exports from neighboring countries like China, Pakistan and Bangladesh have<br />
stared posing a severe threat to Indian textile companies. The availability of low-cost<br />
labour in these countries has negated the cost-advantage for Indian exporters, thereby<br />
resulting in intense competition for access to the international markets.<br />
The company uses cotton as one of its primary raw materials. Due to lack of local<br />
availability, cotton prices have been extremely volatile in the last two years and<br />
reached a peak price of Rs.65000 per candy (356 kg) towards the end of FY11 (up from<br />
the average range of Rs.30000-40000). Any further adverse movements in rates would<br />
further suppress the operating profits.<br />
Further, there is also a limited availability of fine count cotton hard waste (a waste<br />
product of spinning mills and a major raw material for the roll manufacturing division),<br />
which may constrain the roll manufacturing/calendar bowl business of the company.<br />
Industry overview<br />
The Indian textile industry plays a major role in the economy and contributes 3% to the<br />
GDP and 14% to the overall industrial production in the country. The industry is also<br />
one of the largest exporters and India has set an export target of $40.5 bn (Rs.2106 bn)<br />
for the fiscal year 2012-13.<br />
The industry, which produced around 60,996 million sq meters of fabric in FY11, is<br />
dominated by unorganized small scale units. The segment is highly fragmented and<br />
there are more than 77,000 textile fabric manufacturers in the country.<br />
Due to high barriers of entry and lack of technical know-how, the roll manufacturing<br />
business in India continues to remain a niche segment. However, the end-users<br />
(unorganized small scale fabric manufacturers) are extremely price sensitive, which<br />
makes it difficult for companies to charge a high premium on their products.<br />
Government policy<br />
The textile industry is highly regulated with excess government intervention in export<br />
policies of cotton (and other related products) with regards to pricing, quotas, and<br />
other limitations/restrictions. Uncertainty and policy delays by the government<br />
therefore have a huge impact on the strategic plans of the entire industry.<br />
With the removal of trade barriers under the WTO, both the domestic and international<br />
competition in textile products like cotton yarn and fabric have increased manifold. In<br />
order to ensure that the local textile players are able to match international standards,<br />
the Government had launched the Technology Upgradation Fund Scheme (TUFS) to<br />
Technology Upgradation Fund (TUF)<br />
provide capital at subsidized interest rates and longer repayment periods to textile<br />
companies in order to become more cost effective and quality oriented. While the<br />
scheme was due to expire in March 2012, the Government has expresses its intent to<br />
include the TUFS under its 12<br />
Page 3 of 6<br />
Initiative of the <strong>BSE</strong> Investors’ Protection Fund<br />
th five-year plan (2012-2017).
Foreign Direct Investment (FDI) policy<br />
Efforts to boost roll manufacturing<br />
business<br />
Labour problems<br />
Declining profitability<br />
Quarterly results<br />
Initiative of the <strong>BSE</strong> Investors’ Protection Fund<br />
<strong>Hindoostan</strong> <strong>Mills</strong> <strong>Limited</strong><br />
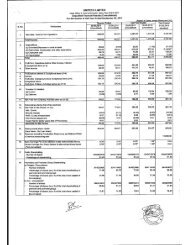
Particulars (Rs in mn) Apr ‘12 to Jun ‘12 Apr ‘11 to Jun ‘11 % Change 1<br />
Jan ’12 to Mar ‘12 % Change 2<br />
Total income 313.1 231.7 35.1% 332.2 (5.7%)<br />
Total expenditure 286.5 215.0 33.3% 305.0 (6.1%)<br />
EBIDTA 26.6 16.7 59.3% 27.2 (2.2%)<br />
PAT 12.0 7.5 60.0% 16.4 (26.8%)<br />
EPS 7.2 4.5 60.0% 9.9 (27.3%)<br />
1<br />
compared to corresponding quarter in the previous year<br />
2 sequential comparison<br />
The government has approved 100% FDI in the textile sector under the automatic<br />
route. The ministry of textiles has also set up a FDI Cell to attract foreign investments in<br />
the textile sector. The role of the cell will be to assist foreign companies in finding out<br />
potential joint venture partners in India and to provide support for co-ordination with<br />
state governments.<br />
Company fundamentals<br />
In a major thrust to increase its capacity of textile machinery units, the company is<br />
currently in the process of developing an additional roll manufacturing unit at Karad,<br />
Maharashtra. HML is also stepping up on its efforts to boost the production and export<br />
of its calendar bowls (liquid extraction rollers) by entering into a technical collaboration<br />
with Voith GmbH, Germany, who is one of the leading manufacturers of textile-based<br />
machinery worldwide. The collaboration is expected to provide technical know-how to<br />
HML and help produce better quality products at a premium price.<br />
Further, in order to reduce its dependence on the textile segment, SML is also exploring<br />
opportunities to foray into roll manufacturing for the steel and automotive industries.<br />
The textile industry is highly labour intensive and management of human resources<br />
therefore becomes an extremely critical issue for determining overall performance of<br />
the company. HML’s relations with its employees have been strained over the last few<br />
years and the company continued to have labour unrest at the factory in FY12. This has<br />
resulted in several disruptions over the course of the year, especially in the last quarter.<br />
Such labour problems in the future may further affect the company’s growth and<br />
expansion plans.<br />
Key financial indicators<br />
The FY12 income of HML fell marginally to Rs.1050 mn (from Rs.1065 mn) on account<br />
of a slowdown in the domestic and international markets. Material costs however,<br />
went up by 21% due to a sharp rise in the prices of key raw materials. As a result,<br />
EBIDTA margins were down to 2% from 11% and the company reported a net loss of<br />
Rs.18 mn for the year.<br />
Q1FY13 performance<br />
The first quarter of FY13 has witnessed a slowdown in revenue growth as compared to Q4FY12. However, expenses have also come<br />
down in line with the revenues which have resulted in a marginal impact on profitability. The y-o-y performance has been<br />
significantly better, and most key financials have registered healthy growth rates during this period.<br />
Page 4 of 6
4,000.0<br />
3,500.0<br />
3,000.0<br />
2,500.0<br />
2,000.0<br />
1,500.0<br />
1,000.0<br />
500.0<br />
-<br />
15.0%<br />
10.0%<br />
5.0%<br />
-<br />
(5.0%)<br />
3,477.1<br />
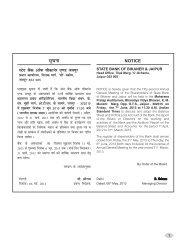
Book value per share Key ratios<br />
3.1% 3.1%<br />
Profitability ratios Leverage ratios<br />
Initiative of the <strong>BSE</strong> Investors’ Protection Fund<br />
<strong>Hindoostan</strong> <strong>Mills</strong> <strong>Limited</strong><br />
Segment-wise contribution to total revenue Geography-wise contribution to total revenue<br />
6.7%<br />
Inner ring represents FY11 data<br />
Outer ring represents FY12 data<br />
13.4% 14.2%<br />
FY10 FY11 FY12<br />
(2.0%) (1.6%)<br />
7.8%<br />
92.2%<br />
ROAE ROACE<br />
93.3%<br />
566.4 549.5<br />
FY10 FY11 FY12<br />
Textile<br />
Machinery<br />
0.4<br />
0.3<br />
0.2<br />
0.1<br />
-<br />
200.0<br />
150.0<br />
100.0<br />
50.0<br />
-<br />
(50.0)<br />
4.3%<br />
5.3%<br />
172.9<br />
50.0<br />
94.7%<br />
95.7%<br />
Inner ring represents FY11 data<br />
Outer ring represents FY12 data<br />
- - 0.0<br />
FY10 FY11 FY12<br />
Debt to EBITDA Debt to Equity<br />
47.7<br />
(11.1)<br />
10.0 5.0<br />
FY10 FY11 FY12<br />
EPS DPS<br />
India<br />
0.4<br />
Rest of World<br />
Page 5 of 6
Initiative of the <strong>BSE</strong> Investors’ Protection Fund<br />
<strong>Hindoostan</strong> <strong>Mills</strong> <strong>Limited</strong><br />
Financials<br />
P&L (Rs. mn) FY10 FY11 FY12 Balance Sheet (Rs. mn) FY10 FY11 FY12<br />
Total income 89 1,065 1,050 Share Capital 7 17 17<br />
EBIDTA 21 118 25 Reserves & Surplus 236 926 898<br />
EBIDTA margin 23% 11% 2% Net worth 243 943 914<br />
Depreciation 5 20 42 Borrowings - - 9<br />
EBIT 16 98 (18) Other liabilities 39 161 163<br />
Interest 1 - 1 Total liabilities 282 1,103 1,087<br />
PBT 15 98 (19) Net fixed assets 43 312 544<br />
Tax 3 19 - Other non-current assets 60 5 5<br />
PAT 12 79 (19) Loans and Advances 17 175 145<br />
PAT Margin 14% 7% (2%) Current Assets 161 612 393<br />
Valuation ratios FY10 FY11 FY12<br />
Total assets 282 1,103 1,087<br />
P/E 0.26 1.38 neg Cash Flow (Rs.mn) FY10 FY11 FY12<br />
P/BV 0.01 0.12 0.63 PBT 15 98 (19)<br />
CF from Operation 21 (136) 14<br />
CF from Investment 39 176 (137)<br />
CF from Financing (20) (4) (8)<br />
Inc/(dec) Cash (0) 142 (130)<br />
Closing Balance 8 149 19<br />
Disclaimer<br />
The information contained herein is from publicly available data or other sources believed to be reliable, but we do not represent that it is accurate<br />
or complete and it should not be relied on as such. Our company shall not be in any way responsible for any loss or damage that may arise to any<br />
person from any inadvertent error in the information contained in this report. This document is provided for assistance only and is not intended to<br />
be and must not alone be taken as the basis for any investment decision. The user assumes the entire risk of any use made of this information.<br />
Each recipient of this document should make such investigation as it deems necessary to arrive at an independent evaluation which may affect<br />
their investment in the securities of companies referred to in this document (including the merits and risks involved). The discussions or views<br />
expressed may not be suitable for all investors. This information is strictly confidential and is being furnished to you solely for your information.<br />
Page 6 of 6