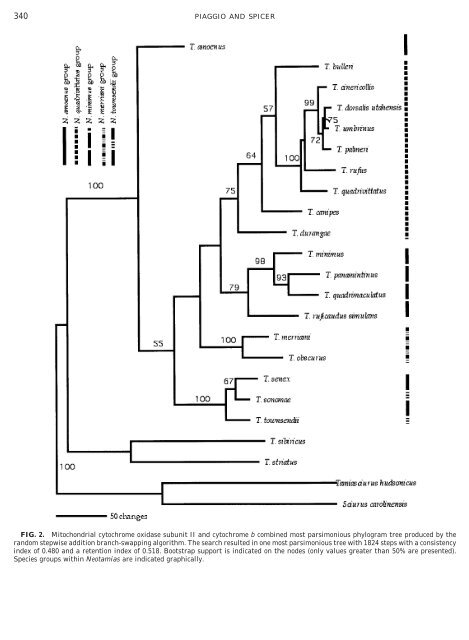
340 PIAGGIO AND SPICER FIG. 2. <strong>Mitochondrial</strong> cytochrome oxidase subunit II and cytochrome b combined most parsimonious phylogram tree produced by <strong>the</strong> random stepwise addition branch-swapping algorithm. The search resulted in one most parsimonious tree with 1824 steps with a consistency index <strong>of</strong> 0.480 and a retention index <strong>of</strong> 0.518. Bootstrap support is indicated on <strong>the</strong> nodes (only values greater than 50% are presented). Species groups within Neotamias are indicated graphically.
evolutionary history, which might be reflected in <strong>the</strong> transversional changes alone. A total <strong>of</strong> nine weighted transversional parsimony trees (L 376; unweighted parsimony equivalent L 1857) were produced. The topology <strong>of</strong> <strong>the</strong>se trees was not different <strong>from</strong> <strong>the</strong> topology <strong>of</strong> <strong>the</strong> unweighted parsimony tree (L 1777). The transversional parsimony does add length to <strong>the</strong> most parsimonious tree. Fur<strong>the</strong>rmore, log likelihood scores were also compared for <strong>the</strong> transversional parsimony data set (-ln likelihood 12005.048) and <strong>the</strong> unweighted parsimony combined data set (-ln likelihood 11789.318); again, <strong>the</strong> unweighted parsimony had a lower score, indicating a better fit to <strong>the</strong> data. Therefore, <strong>the</strong> unweighted parsimony tree appears to reflect <strong>the</strong> best estimate <strong>of</strong> <strong>the</strong> evolutionary history for <strong>the</strong>se species. We used <strong>the</strong> cyt b data with a reduced taxa set to examine whe<strong>the</strong>r o<strong>the</strong>r factors (e.g., transition/transversion rates or among-site rate heterogeneity) influenced <strong>the</strong> data set. For <strong>the</strong>se analyses we used various maximum-likelihood methods. We used only <strong>the</strong> cyt b data so we could include o<strong>the</strong>r sciurid sequences, which were not available for <strong>the</strong> COII gene. To reduce <strong>the</strong> data set to make <strong>the</strong> maximum-likelihood iterations complete in a reasonable amount <strong>of</strong> time, we used only one representative for taxa that demonstrated monophyletic relationships with o<strong>the</strong>rs <strong>of</strong> <strong>the</strong> same species in <strong>the</strong> parsimony analysis (Fig. 1). Therefore, only T. dorsalis and T. cinereicollis have more than one specimen in <strong>the</strong> maximum-likelihood tree because <strong>the</strong>se taxa appear paraphyletic in <strong>the</strong> parsimony analysis (Fig. 1). The reduced taxa set contained 43 taxa including o<strong>the</strong>r sciurids obtained <strong>from</strong> sources described previously. This reduced data set resulted in nine most parsimonious trees (L 2438, CI 0.318, RI 0.604). Using <strong>the</strong>se nine parsimony trees, we tested hypo<strong>the</strong>ses <strong>of</strong> differing rates <strong>of</strong> evolutionary changes utilizing CHIPMUNK CYT b AND COII MOLECULAR PHYLOGENY TABLE 4 Maximum-Likelihood Analysis <strong>of</strong> Hierarchical Substitution Models for <strong>the</strong> cyt b Sequence Data H 0 vs H 1 -LnL 0 -LnL 1 -2ln df P JC vs K2P 14407.075 13180.61 2452.93 2 0.0001* K2P vs HKY85 13180.61 12865.442 630.34 1 0.0001* HKY85 vs HKY85 12865.442 11225.756 3279.37 1 0.0001* HKY85 vs HKY85I 11225.756 11210.568 30.38 1 0.0001* GTR vs GTR 12667.989 11206.742 2922.49 1 0.0001* GTR vs GTRIbase freq. 11206.742 11192.937 27.61 5 0.0001* GTRIbase freq. (clock enforced) 11192.937 11221.209 56.54 4 0.054 1 Maximum-likelihood GTRIbase freq. n/a 11187.906 n/a n/a n/a Maximum-likelihood GTRI (clock enforced) 11187.906 11271.230 166.65 4 0.0001* 1 Note. Likelihoods were evaluated with <strong>the</strong> likelihood ratio test as described under Methods and Materials. JC, Jukes–Cantor (1969); K2P, Kimura (1980); HKY85, Hasegawa et al. (1985); GTR, general time-reversible model (Lanave et al., 1984; Rodriguez et al., 1990); , shape parameter <strong>of</strong> <strong>the</strong> gamma distribution estimated with 10 rate categories; I, proportion <strong>of</strong> invariable sites. Degrees <strong>of</strong> freedom when <strong>the</strong> hypo<strong>the</strong>sis <strong>of</strong> a molecular clock is tested equal n 2, where n <strong>the</strong> number <strong>of</strong> taxa sampled (Felsenstein, 1993). * Hypo<strong>the</strong>sis rejected. 341 <strong>the</strong> log likelihood ratio tests. The resulting likelihood ratio statistic and <strong>the</strong> 2 statistic between <strong>the</strong> models (Table 4) demonstrated that <strong>the</strong> GTRGIestimated base frequencies model was <strong>the</strong> best model under maximum-likelihood. The tree with <strong>the</strong> lowest -In likelihood, generated by application <strong>of</strong> this maximum-likelihood model to <strong>the</strong> parsimony trees, is presented with bootstrap results (Fig. 3). We also generated a maximum-likelihood tree with <strong>the</strong> same model (Fig. 4). The trees have different topologies, but both are presented to demonstrate that membership within <strong>the</strong> Tamias clades do not change, regardless <strong>of</strong> which model or algorithm is applied. Only <strong>the</strong> relationships among <strong>the</strong> clades in <strong>the</strong> parsimony and <strong>the</strong> likelihood trees change. In fact, <strong>the</strong> difference between <strong>the</strong> parsimony tree with <strong>the</strong> GTRIGestimated base frequencies likelihood model (ln likelihood 11192.937) and <strong>the</strong> likelihood tree with <strong>the</strong> same model (ln likelihood 11187.906) is only -ln 5 (Table 4). Both <strong>the</strong> parsimony tree (with <strong>the</strong> GTRIG estimated base frequencies likelihood model) and <strong>the</strong> likelihood tree with <strong>the</strong> same model were tested under a molecular clock hypo<strong>the</strong>sis <strong>of</strong> constant rates <strong>of</strong> evolutionary change (Table 4), and <strong>the</strong> hypo<strong>the</strong>sis was rejected (P 0.001). Therefore, we cannot apply a molecular clock to <strong>the</strong> data to estimate divergences. To compare divergences among taxa, branch lengths were generated <strong>from</strong> <strong>the</strong> maximum-likelihood tree (with <strong>the</strong> GTRIGestimated base frequencies likelihood model). These branch lengths were used to generate a distribution <strong>of</strong> genetic distances within and between genera (Fig. 5). These branch lengths and <strong>the</strong> phylogenies presented are estimates <strong>of</strong> evolutionary relationships among Tamias taxa and allow evaluation and discussion <strong>of</strong> <strong>the</strong> evolution and systematics <strong>of</strong> this genus.