Fortune Indonesia, Tbk - PT. PEFINDO
Fortune Indonesia, Tbk - PT. PEFINDO
Fortune Indonesia, Tbk - PT. PEFINDO

Create successful ePaper yourself
Turn your PDF publications into a flip-book with our unique Google optimized e-Paper software.
<strong>Fortune</strong> <strong>Indonesia</strong>, <strong>Tbk</strong><br />
Secondary Report<br />
Historical Chart<br />
JCI<br />
5,000<br />
4,500<br />
4,000<br />
3,500<br />
3,000<br />
2,500<br />
2,000<br />
1,500<br />
1,000<br />
500<br />
0<br />
JCI FORU<br />
Feb-12 Apr-12 Jun-12 Aug-12 Oct-12 Dec-12<br />
Source: Bloomberg<br />
Stock Information<br />
Contact:<br />
Equity & Index Valuation Division<br />
Phone: (6221) 7278 2380<br />
info-equityindexvaluation@pefindo.co.id<br />
“Disclaimer statement in the last page is an<br />
integral part of this report”<br />
www.pefindo.com<br />
FORU<br />
300<br />
200<br />
100<br />
0<br />
IDR<br />
Ticker code FORU<br />
Market price as of March 7, 2013 139<br />
Market price – 52 week high 182<br />
Market price – 52 week low 121<br />
Market cap – 52 week high (bn) 85<br />
Market cap – 52 week low (bn) 56<br />
Stock Valuation Last Current<br />
High 230 295<br />
Low 210 270<br />
Market Value Added & Market Risk<br />
MVA<br />
-82<br />
-84<br />
-86<br />
-88<br />
-90<br />
-92<br />
-94<br />
-96<br />
-98<br />
9M11 9M12<br />
Market Value Added Market Risk<br />
Source: Bloomberg, Pefindo Equity & Index Valuation Division<br />
Shareholders<br />
0.8<br />
0.7<br />
0.6<br />
0.5<br />
0.4<br />
0.3<br />
0.2<br />
0.1<br />
0<br />
Market Risk<br />
(%)<br />
<strong>PT</strong> Grhaadhika <strong>Fortune</strong> 38.82<br />
<strong>PT</strong> <strong>Fortune</strong> Daksa Pariwara 6.32<br />
Public (each below 5% ownership) 54.86<br />
*Note: as of September 30, 2012<br />
Ready to Pursue Stronger Growth<br />
Equity Valuation<br />
March 8, 2013<br />
Target Price<br />
Low High<br />
270 295<br />
Marketing Communication<br />
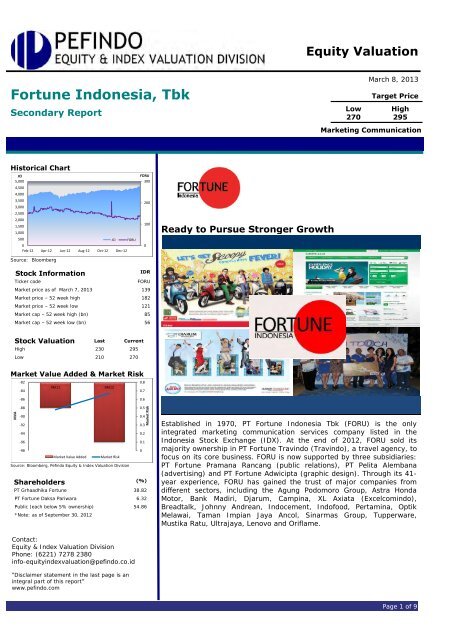
Established in 1970, <strong>PT</strong> <strong>Fortune</strong> <strong>Indonesia</strong> <strong>Tbk</strong> (FORU) is the only<br />
integrated marketing communication services company listed in the<br />
<strong>Indonesia</strong> Stock Exchange (IDX). At the end of 2012, FORU sold its<br />
majority ownership in <strong>PT</strong> <strong>Fortune</strong> Travindo (Travindo), a travel agency, to<br />
focus on its core business. FORU is now supported by three subsidiaries:<br />
<strong>PT</strong> <strong>Fortune</strong> Pramana Rancang (public relations), <strong>PT</strong> Pelita Alembana<br />
(advertising) and <strong>PT</strong> <strong>Fortune</strong> Adwicipta (graphic design). Through its 41year<br />
experience, FORU has gained the trust of major companies from<br />
different sectors, including the Agung Podomoro Group, Astra Honda<br />
Motor, Bank Madiri, Djarum, Campina, XL Axiata (Excelcomindo),<br />
Breadtalk, Johnny Andrean, Indocement, Indofood, Pertamina, Optik<br />
Melawai, Taman Impian Jaya Ancol, Sinarmas Group, Tupperware,<br />
Mustika Ratu, Ultrajaya, Lenovo and Oriflame.<br />
Page 1 of 9
INVESTMENT PARAMETERS<br />
“Disclaimer statement in the last page<br />
is an integral part of this report”<br />
www.pefindo.com<br />
Target Price Adjustment<br />
<strong>Fortune</strong> <strong>Indonesia</strong>, <strong>Tbk</strong><br />
We have made several adjustments to our previous forecast and adjust our<br />
Target Price upward to the range of IDR270 – IDR295 per share, based on the<br />
following considerations:<br />
Optimism on domestic advertising industry. In 2012, national spending on<br />
advertising increased by 24% year-on-year (YoY) to IDR107 trillion, mainly<br />
due to the aggressive promotion strategy of many business sectors. In line<br />
with the 2014 national election, which will see campaigning begin in the first<br />
half of 2013, we forecast national spending on advertising this year to<br />
increase 16% YoY.<br />
FORU’s financial performance. During 9M12, FORU managed to post a 9%<br />
YoY revenue growth to IDR361 billion, thanks to soaring advertising revenue.<br />
However, for FY2012, we’ve adjusted our revenue projection to only IDR481<br />
billion, lower than our projection in the previous report, because of the sale<br />
of FORU’s majority stake in travel agency <strong>PT</strong> <strong>Fortune</strong> Travindo (Travindo).<br />
Assumption of risk free rate, equity premium and beta reach 5.4%, 7.2% and<br />
0.4x, respectively.<br />
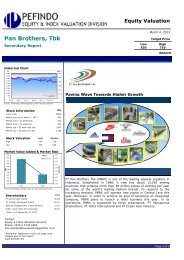
Business Prospects<br />
With <strong>Indonesia</strong>’s sound economic indicators, as seen in its strong domestic<br />
consumption, inflation rate below 5% and low benchmark interest rate (BI rate)<br />
of 5.75%, we believe many business sectors will seek to take advantage by<br />
increasing production and expanding their markets. This, in turn, would further<br />
boost the advertising industry. Accordingly, national spending on advertising this<br />
year is predicted to climb by 16% YoY to IDR124 trillion. Further, leading up to<br />
the national elections and World Cup in 2014, we are confident that the<br />
advertising industry will benefit from those two big events. Given all these<br />
opportunities along with FORU’s strong image in the domestic advertising<br />
industry, we expect FORU to grow its revenue by a compound annual growth<br />
rate (CAGR) of 9% during 2011–2016.<br />
Table 1: Performance Summary<br />
2009 2010 2011 2012P 2013P<br />
Revenue (IDR bn) 408 489 506 481 530<br />
Pre-tax Profit (IDR bn) 10 14 18 15 17<br />
Net Profit (IDR bn) 7 10 13 11 12<br />
EPS (IDR) 14.1 20.7 27.8 24.6 26.7<br />
EPS Growth (%) (27.7) 46.6 34.3 (11.7) 8.7<br />
P/E (x) 6.4 5.4 5.2 5.7* 5.2*<br />
PBV (x) 0.4 0.5 0.6 0.7* 0.6*<br />
Source: <strong>PT</strong> <strong>Fortune</strong> <strong>Indonesia</strong> <strong>Tbk</strong>., Pefindo Equity & Index Valuation Division Estimates<br />
Notes: * Based on Share Price as of March 7, 2013 – IDR139/share<br />
March 8, 2013 Page 2 of 9
GROWTH VALUE MAP<br />
“Disclaimer statement in the last page<br />
is an integral part of this report”<br />
www.pefindo.com<br />
<strong>Fortune</strong> <strong>Indonesia</strong>, <strong>Tbk</strong><br />
The Growth-Value Map below provides an overview of the market expectations<br />
for the companies listed on the IDX. The Current Performance (CP) metric,<br />
running along the horizontal axis, is a portion of current stock market value that<br />
can be linked to the perpetuity of a company’s current performance in<br />
profitability. The Growth Expectations (GE) metric, plotted on the vertical axis, is<br />
the difference between the current stock market value and the value of current<br />
performance. Both metrics are normalized by the company’s book value.<br />
Growth-Value Map divides companies into four clusters:<br />
Excellent Value Managers (“Q-1”)<br />
Market expects companies in Q-1 to surpass their benchmark in<br />
profitability and growth.<br />
Expectation Builders (“Q-2”)<br />
Market has relatively low expectations of profitability from companies in Q-<br />
2 in the short term, but has growth expectations exceed the benchmark.<br />
Traditionalists (“Q-3”)<br />
Market has low growth expectations of companies in the Q-3, although<br />
they showed a good profitability in the short term.<br />
Asset-loaded Value Managers (“Q-4”)<br />
Market has low expectations in terms of profitability and growth for<br />
companies in Q-4.<br />
Figure 1: Growth-Value Map of FORU (Advertising, Printing<br />
& Media Industry)<br />
Growth Expectations<br />
6<br />
5<br />
4<br />
3<br />
2<br />
1<br />
0<br />
-1<br />
-2<br />
-3<br />
-4<br />
Q-2<br />
Q-4<br />
0 1 2 3 4 5 6<br />
Current Performance (CP)<br />
March 8, 2013 Page 3 of 9<br />
FORU<br />
EMTK<br />
MNCN<br />
Source: Bloomberg, Pefindo Equity & Index Valuation Division<br />
Based on its financial report and market data, FORU is classified in the Assetloaded<br />
Value Managers (Q-4) cluster, which means the market has low<br />
expectations of its profitability and growth. However, by taking advantage of the<br />
prospect available to the domestic advertising industry, we believe FORU can<br />
gradually move to the Excellent Value Managers (Q-1) cluster. It also needs to<br />
strengthen its internal systems and regularly update the public about its<br />
economic success.<br />
JTPE<br />
SCMA<br />
Q-1<br />
Q-3
BUSINESS INFORMATION<br />
“Disclaimer statement in the last page<br />
is an integral part of this report”<br />
www.pefindo.com<br />
<strong>Fortune</strong> <strong>Indonesia</strong>, <strong>Tbk</strong><br />
Optimism on Advertising Industry in 2013<br />
<strong>Indonesia</strong> is one of the most attractive investment destinations today due to its<br />
young and productive population base and rising income levels. As a result,<br />
plenty of local and international companies alike take advantage of the wealth of<br />
opportunities presented by the country through aggressive promotions. National<br />
advertising spending is currently dominated by companies involved in<br />
telecommunications, fast-moving consumer goods, banking and automotive,<br />
among others. The upcoming 2014 national elections will also bode well for the<br />
industry, as the political climate is likely to heat up. We believe that the industry<br />
will begin working on political campaigns, specifically for the legislature, in April<br />
2013, with actual campaigns beginning in July 2013. Hence, national spending on<br />
advertising is predicted to reach IDR124 trillion this year, a 16% growth over<br />
2012.<br />
Figure 2: Spending Advertising in <strong>Indonesia</strong><br />
(IDR trillion)<br />
140<br />
120<br />
100<br />
80<br />
60<br />
40<br />
20<br />
0<br />
49<br />
March 8, 2013 Page 4 of 9<br />
60<br />
86<br />
107<br />
124<br />
2009 2010 2011 2012 2013P<br />
National Advertising Spending<br />
Source: <strong>PT</strong> <strong>Fortune</strong> <strong>Indonesia</strong> <strong>Tbk</strong>,, Pefindo Equity & Index Valuation Division Estimates<br />
More Focus on Core Business<br />
At the end of 2012, FORU sold its majority ownership in <strong>PT</strong> <strong>Fortune</strong> Travindo<br />
(Travindo), a travel agency. The move was taken in order to focus more on its<br />
core business of advertising. Without <strong>PT</strong> <strong>Fortune</strong> Travindo (Travindo), we<br />
forecast FORU’s revenue in 2012 to reach IDR481 billion. Currently, FORU is still<br />
supported by three subsidiaries: <strong>PT</strong> <strong>Fortune</strong> Pramana Rancang (<strong>Fortune</strong> PR, on<br />
public relations), <strong>PT</strong> <strong>Fortune</strong> Adwicipta (Adwicipta, on graphic design) and <strong>PT</strong><br />
Pelita Alembana (Pelita, on advertising).<br />
Figure 3: Some FORU’s Subsidiaries<br />
Source: <strong>PT</strong> <strong>Fortune</strong> <strong>Indonesia</strong> <strong>Tbk</strong>,, Pefindo Equity & Index Valuation Division
FINANCE<br />
“Disclaimer statement in the last page<br />
is an integral part of this report”<br />
www.pefindo.com<br />
<strong>Fortune</strong> <strong>Indonesia</strong>, <strong>Tbk</strong><br />
Positive Revenue Growth, but Bottom Line Slashed<br />
During 9M12, FORU posted a revenue growth of 9% YoY, which is modest when<br />
compared to its 12% average annual growth from 2009–2011. Meanwhile, we<br />
view FORU’s gross profit margin (GPM) was stable at 15.2%. Nevertheless,<br />
higher selling expenses led to a lower operating profit of 1.1% and net profit of<br />
0.9% from 2.5% and 2.0%, respectively, in 9M11. But with a high potential<br />
increase in revenue in the fourth quarter, we foresee FORU’s operating and net<br />
margins to reach 3.1% and 2.4%, respectively, by the end of 2012.<br />
Figure 4: FORU’s Revenue and Gross, Operating, Net<br />
Margin<br />
(IDR billion)<br />
600<br />
500<br />
400<br />
300<br />
200<br />
100<br />
0<br />
2010 2011 9M11 9M12<br />
March 8, 2013 Page 5 of 9<br />
18,00%<br />
16,00%<br />
14,00%<br />
12,00%<br />
10,00%<br />
8,00%<br />
6,00%<br />
4,00%<br />
2,00%<br />
0,00%<br />
Revenue Gross Margin Operating Margin Net Margin<br />
Source: <strong>PT</strong> <strong>Fortune</strong> <strong>Indonesia</strong> <strong>Tbk</strong>, Pefindo Equity & Index Valuation Division<br />
Sound Balance Sheet<br />
It is worthwhile to note FORU’s efforts to better manage its financial condition, as<br />
seen in its increasing liquidity and decreasing leverage. We noted that during<br />
9M12, FORU’s current ratio was at 2.16x, compared to 1.96x in 9M11, mainly due<br />
to declining short-term bank debts. Accordingly, FORU’s debt-to-equity ratio<br />
(DER) and interest-bearing debt-to-equity ratio also improved to 0.85x and<br />
0.02x, respectively, in 9M12, compared to 1.08x and 0.07x in 9M11.<br />
Figure 5: FORU’s Current Ratio, DER and Interest<br />
Bearing Debt<br />
2.50<br />
2.00<br />
1.50<br />
1.00<br />
0.50<br />
0.00<br />
1.63<br />
1.63<br />
1.74<br />
1.29<br />
1.96<br />
1.08<br />
2.16<br />
0.85<br />
0.02 0.06 0.07 0.02<br />
2010 2011 9M11 9M12<br />
Current Ratio DER Interest Bearing Dent to Equity<br />
Source: <strong>PT</strong> <strong>Fortune</strong> <strong>Indonesia</strong> <strong>Tbk</strong>,, Pefindo Equity & Index Valuation Division
“Disclaimer statement in the last page<br />
is an integral part of this report”<br />
www.pefindo.com<br />
<strong>Fortune</strong> <strong>Indonesia</strong>, <strong>Tbk</strong><br />
FORU Business Prospect<br />
We are optimistic about the prospects for the national advertising industry in the<br />
years to come, mainly due to sound economic indicators such as strong domestic<br />
consumption, a manageable inflation rate below 5% and a low benchmark<br />
interest rate (BI rate) of 5.75%, which would boost business activity.<br />
Accordingly, national spending on advertising this year is predicted to grow 16%<br />
YoY to IDR124 trillion. Leading up to the national elections and World Cup in<br />
2014, we are confident that the advertising industry will benefit from campaign<br />
and football promotion activities. Given all these opportunities along with FORU’s<br />
strong image in the domestic advertising industry, we expect FORU to grow its<br />
revenue by a compound annual growth rate (CAGR) of 9% during 2011–2016.<br />
(IDR billion)<br />
900<br />
800<br />
700<br />
600<br />
500<br />
400<br />
300<br />
200<br />
100<br />
0<br />
Figure 6: FORU’s Revenue Estimation<br />
506<br />
March 8, 2013 Page 6 of 9<br />
481<br />
530<br />
637<br />
703<br />
775<br />
2011 2012P 2013P 2014P 2015P 2016P<br />
Revenue Estimation<br />
Source: <strong>PT</strong> <strong>Fortune</strong> <strong>Indonesia</strong> <strong>Tbk</strong>., Pefindo Equity & Index Valuation Division Estimates
TARGET PRICE<br />
“Disclaimer statement in the last page<br />
is an integral part of this report”<br />
www.pefindo.com<br />
VALUATION<br />
Methodology<br />
<strong>Fortune</strong> <strong>Indonesia</strong>, <strong>Tbk</strong><br />
We applied the Discounted Cash Flow (DCF) method as the main valuation<br />
approach, considering that income growth is a value driver in FORU instead of<br />
asset growth.<br />
We did not combine the DCF method with the Guideline Company Method<br />
(GCM) as there are no similar companies eligible to be compared with FORU<br />
in the IDX.<br />
This valuation is based 100% on FORU’s share price as of March 7, 2013,<br />
using FORU’s financial report as of September 30, 2012, for our fundamental<br />
analysis.<br />
Value Estimation<br />
We use Cost of Capital of 7.9% and Cost of Equity of 7.9% based on the<br />
following assumption:<br />
Table 2: Assumption<br />
Risk free rate [%]* 5.3<br />
Risk premium [%]* 7.2<br />
Beta [x]* 0.4<br />
Cost of Equity [%] 7.9<br />
Marginal tax rate [%] 25.0<br />
Interest Bearing Debt to<br />
Equity Ratio [x] 0.02<br />
WACC [%] 7.9<br />
Source: Bloomberg, Pefindo Equity & Index Valuation Division Estimates<br />
Notes: *As of March 7, 2013<br />
The target price for 12 months based on the valuation as of March 7, 2013<br />
using the DCF method with a 7.9% discount rate assumption ranges between<br />
IDR270 - IDR295 per share.<br />
Table 3: Summary of DCF Method Valuation<br />
Conservative Moderate Aggressive<br />
PV of Free Cash Flows [IDR bn] 20 21 22<br />
PV Terminal Value [IDR bn] 81 86 90<br />
Non-Operating Assets- [IDR bn] 27 27 27<br />
Net Debt [IDR bn] (2) (2) (2)<br />
Total Equity Value [IDR bn] 127 132 137<br />
Number of Share [mn shares] 465 465 465<br />
Fair Value per Share [IDR] 270 285 295<br />
Source: Pefindo Equity & Index Valuation Division Estimates<br />
March 8, 2013 Page 7 of 9
Table 4: Consolidated Statements of Comprehensive<br />
Income<br />
(IDR bn) 2009 2010 2011 2012P 2013P<br />
Sales 408 489 506 481 530<br />
COGS (354) (427) (424) (400) (441)<br />
Gross Profit 55 62 82 81 89<br />
Operating Expense (46) (50) (64) (67) (72)<br />
Operating Profit 9 12 18 15 17<br />
Other Income (Charges) 1 1 0 0 (0)<br />
Pre-tax Profit 10 14 18 15 17<br />
Tax (3) (4) (5) (4) (4)<br />
Net Profit 7 10 13 11 12<br />
Source: <strong>PT</strong> <strong>Fortune</strong> <strong>Indonesia</strong> <strong>Tbk</strong>., Pefindo Equity & Index Valuation Division Estimates<br />
Table 5: Consolidated Statements of Financial<br />
Position<br />
Assets<br />
(IDR bn) 2009 2010 2011 2012P 2013P<br />
Current Assets<br />
Cash & cash equivalents 34 43 29 26 27<br />
Receivables 118 165 155 132 136<br />
Other short-term assets 59 52 62 74 83<br />
Fixed Assets 10 9 10 10 16<br />
Other Assets 9 8 10 13 13<br />
Total Assets 230 276 266 254 275<br />
Liabilities<br />
Trade payables 113 144 118 99 109<br />
Short-term liabilities 1 2 7 6 6<br />
Other Short-term<br />
liabilities<br />
“Disclaimer statement in the last page<br />
is an integral part of this report”<br />
www.pefindo.com<br />
9 14 17 12 12<br />
Long-term liabilities - - 0.3 - -<br />
Other Long-term<br />
liabilities<br />
10 12 8 12 12<br />
Total Liabilities 133 171 150 129 139<br />
Total Equity 97 105 116 125 135<br />
Source: <strong>PT</strong> <strong>Fortune</strong> <strong>Indonesia</strong> <strong>Tbk</strong>., Pefindo Equity & Index Valuation Division Estimates.<br />
Figure 7: Historical P/E and P/BV<br />
<strong>Fortune</strong> <strong>Indonesia</strong>, <strong>Tbk</strong><br />
March 8, 2013 Page 8 of 9<br />
7.00<br />
6.00<br />
5.00<br />
4.00<br />
3.00<br />
2.00<br />
1.00<br />
0.00<br />
2009 2010 2011<br />
P/E (x) P/BV (x)<br />
Source: <strong>PT</strong> <strong>Fortune</strong> <strong>Indonesia</strong> <strong>Tbk</strong>., Pefindo Equity & Index Valuation Division<br />
Figure 8 : Historical ROA, ROE and TAT<br />
(%)<br />
10.00<br />
9.00<br />
8.00<br />
7.00<br />
6.00<br />
5.00<br />
4.00<br />
3.00<br />
2.00<br />
1.00<br />
0.00<br />
2009 2010 2011<br />
ROA (%) ROE (%) TAT (x)<br />
Source: <strong>PT</strong> <strong>Fortune</strong> <strong>Indonesia</strong> <strong>Tbk</strong>., Pefindo Equity & Index Valuation Division<br />
Table 6: Key Ratio<br />
Ratio 2009 2010 2011 2012P 2013P<br />
Growth (%)<br />
Sales 13.1 19.8 3.3 (4.9) 10.3<br />
Operating Profit (20.2) 37.4 44.5 (15.1) 12.7<br />
Net Profit (27.7) 46.6 34.3 (11.7) 8.7<br />
Profitability (%)<br />
Gross Margin 13.4 12.7 16.2 16.9 16.8<br />
Operating Margin<br />
(x)<br />
1.95<br />
1.90<br />
1.85<br />
1.80<br />
1.75<br />
1.70<br />
2.2 2.5 3.5 3.1 3.2<br />
EBITDA Margin 2.3 2.6 3.7 3.6 3.7<br />
Net Margin 1.6 2.0 2.6 2.4 2.3<br />
ROA 2.9 3.5 4.9 4.5 4.5<br />
ROE 6.8 9.2 11.2 9.1 9.2<br />
Solvability (X)<br />
Debt to Equity 1.4 1.6 1.3 1.0 1.0<br />
Debt to Asset 0.6 0.6 0.6 0.5 0.5<br />
Liquidity (X)<br />
Current Ratio 1.7 1.6 1.7 1.9 1.9<br />
Quick Ratio 1.2 1.3 1.3 1.3 1.3<br />
Source: <strong>PT</strong> <strong>Fortune</strong> <strong>Indonesia</strong> <strong>Tbk</strong>., Pefindo Equity & Index Valuation Division Estimates
“Disclaimer statement in the last page<br />
is an integral part of this report”<br />
www.pefindo.com<br />
DISCLAIMER<br />
<strong>Fortune</strong> <strong>Indonesia</strong>, <strong>Tbk</strong><br />
This report was prepared based on trusted and reliable sources. Nevertheless, we do not<br />
guarantee its completeness, accuracy and adequacy. Therefore, we are not responsible for any<br />
investment decisions made based on this report. All assumptions, opinions and predictions were<br />
solely our internal judgments as of the reporting date, and those judgments are subject to<br />
change without further notice.<br />
We are not responsible for any mistakes or negligence that occur by using this report. Recent<br />
performance cannot always be used as a reference for future outcome. This report does not<br />
offer a recommendation to purchase or hold particular shares. This report might not be suitable<br />
for some investors. All opinions in this report have been presented fairly as of the issuing date<br />
with good intentions; however, they could change at any time without further notice. The price,<br />
value or income of each share of the Company stated in this report might be lower than<br />
investor expectations, and investors may obtain returns lower than the invested amount.<br />
Investment is defined as the probable income that will be received in the future; none theless<br />
such returns may fluctuate. As for companies whose shares are denominated in a currency<br />
other than Rupiah, foreign exchange fluctuation may reduce their share value, price or the<br />
returns for investors. This report does not contain any information for tax considerations in<br />
investment decision-making.<br />
The share price target in this report is a fundamental value, not a fair market value or a<br />
transaction price reference required by regulations.<br />
The share price target issued by thePefindo Equity & Index Valuation Division is not a<br />
recommendation to buy, sell or hold particular shares . It should not be considered as<br />
investment advice from the Pefindo Equity & Index Valuation Division and its scope of service to<br />
some parties, including listed companies, financial advisors, brokers, investment banks,<br />
financial institutions and intermediaries, does not correlate with receiving rewards or any other<br />
benefits from such parties.<br />
This report is not intended for any particular investor and cannot be used as part of an<br />
objective investment analysis of particular shares, an investment recommendation, or an<br />
investment strategy. We strongly recommend investors to consider the suitability of the<br />
situation and conditions before making a decision in relation with the figures in this report. If<br />
necessary, consult with your financial advisor.<br />
<strong>PEFINDO</strong> keeps the activities of the Equity Valuation Division separate from its Ratings Division<br />
to preserve the independence and objectivity of its analytical processes and pr oducts. <strong>PEFINDO</strong><br />
has established policies and procedures to maintain the confidentiality of non -public information<br />
received in connection with each analytical process. The entire process, methodology and the<br />
database used in the preparation of the Reference Share Price Target Report as a whole are<br />
different from the processes, methodologies and databases used by <strong>PEFINDO</strong> in issuing ratings.<br />
This report was prepared and composed by the Pefindo Equity & Index Valuation Division with<br />
the objective of enhancing the transparency of share prices of listed companies in the <strong>Indonesia</strong><br />
Stock Exchange (IDX). This report is also free of influence from any other party, including<br />
pressure or force either from IDX or the listed company reviewed . Pefindo Equity & Index<br />
Valuation Division earns a reward amounting to IDR20 million from IDX and the reviewed<br />
company for issuing this report twice a year. For further information, please visit our website at<br />
http://www.pefindo.com<br />
This report was prepared and composed by the Pefindo Equity & Index Valuation Division. In<br />
<strong>Indonesia</strong>, this report is published in our website and in the IDX website.<br />
March 8, 2013 Page 9 of 9