
Create successful ePaper yourself
Turn your PDF publications into a flip-book with our unique Google optimized e-Paper software.
<strong>Jaya</strong> <strong>Pari</strong> <strong>Steel</strong>, <strong>Tbk</strong><br />
Secondary Report<br />
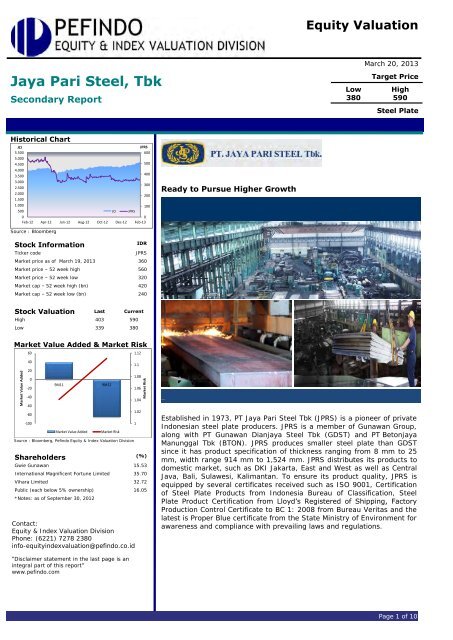
Historical Chart<br />
JCI<br />
JPRS<br />
5.500<br />
5.000<br />
600<br />
4.500<br />
500<br />
4.000<br />
3.500<br />
400<br />
3.000<br />
2.500<br />
300<br />
2.000<br />
1.500<br />
200<br />
1.000<br />
100<br />
500<br />
JCI JPRS<br />
0<br />
0<br />
Feb-12 Apr-12 Jun-12 Aug-12 Oct-12 Dec-12 Feb-13<br />
Source : Bloomberg<br />
Stock Information<br />
Contact:<br />
Equity & Index Valuation Division<br />
Phone: (6221) 7278 2380<br />
info-equityindexvaluation@pefindo.co.id<br />
“Disclaimer statement in the last page is an<br />
integral part of this report”<br />
www.pefindo.com<br />
IDR<br />
Ticker code JPRS<br />
Market price as of March 19, 2013 360<br />
Market price – 52 week high 560<br />
Market price – 52 week low 320<br />
Market cap – 52 week high (bn) 420<br />
Market cap – 52 week low (bn) 240<br />
Stock Valuation Last Current<br />
High 403 590<br />
Low 339 380<br />
Market Value Added & Market Risk<br />
Market Value Added<br />
60<br />
40<br />
20<br />
0<br />
-20<br />
-40<br />
-60<br />
-80<br />
-100<br />
9M11 9M12<br />
Market Value Added Market Risk<br />
Source : Bloomberg, Pefindo Equity & Index Valuation Division<br />
Shareholders<br />
1.12<br />
1.1<br />
1.08<br />
1.06<br />
1.04<br />
1.02<br />
1<br />
Market Risk<br />
(%)<br />
Gwie Gunawan 15.53<br />
International Magnificent Fortune Limited 35.70<br />
Vihara Limited 32.72<br />
Public (each below 5% ownership) 16.05<br />
*Notes: as of September 30, 2012<br />
Ready to Pursue Higher Growth<br />
Equity Valuation<br />
March 20, 2013<br />
Target Price<br />
Low High<br />
380 590<br />
<strong>Steel</strong> Plate<br />
Property<br />
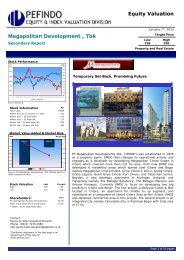
Established in 1973, <strong>PT</strong> <strong>Jaya</strong> <strong>Pari</strong> <strong>Steel</strong> <strong>Tbk</strong> (JPRS) is a pioneer of private<br />
Indonesian steel plate producers. JPRS is a member of Gunawan Group,<br />
along with <strong>PT</strong> Gunawan Dianjaya <strong>Steel</strong> <strong>Tbk</strong> (GDST) and <strong>PT</strong> Betonjaya<br />
Manunggal <strong>Tbk</strong> (BTON). JPRS produces smaller steel plate than GDST<br />
since it has product specification of thickness ranging from 8 mm to 25<br />
mm, width range 914 mm to 1,524 mm. JPRS distributes its products to<br />
domestic market, such as DKI Jakarta, East and West as well as Central<br />
Java, Bali, Sulawesi, Kalimantan. To ensure its product quality, JPRS is<br />
equipped by several certificates received such as ISO 9001, Certification<br />
of <strong>Steel</strong> Plate Products from Indonesia Bureau of Classification, <strong>Steel</strong><br />
Plate Product Certification from Lloyd’s Registered of Shipping, Factory<br />
Production Control Certificate to BC 1: 2008 from Bureau Veritas and the<br />
latest is Proper Blue certificate from the State Ministry of Environment for<br />
awareness and compliance with prevailing laws and regulations.<br />
Page 1 of 10
INVESTMENT PARAMETER<br />
“Disclaimer statement in the last page<br />
is an integral part of this report”<br />
www.pefindo.com<br />
Target Price Adjustment<br />
<strong>Jaya</strong> <strong>Pari</strong> <strong>Steel</strong>, <strong>Tbk</strong><br />
We have made several adjustments to our previous forecast and adjust our<br />
Target Price upward to the range of IDR380 – IDR590 per share, based<br />
on the following considerations:<br />
Indonesian steel market this year is forecasted to reach IDR71 trillion,<br />
up by 7% YoY compared to IDR66 trillion in 2012, mainly due to solid<br />
economic growth in domestic that could drive to the increasing of<br />
manufacture, automotive and infrastructure activities, further boosting<br />
steel consumption.<br />
Financial performance during 9M12. We view that JPRS’s achievement<br />
up to 9M12 was in line with our revenue projection in the previous<br />
report for 2012 period. Despite a decline performance in 9M12,<br />
however, in line with increasing trend of steel price and augmented with<br />
positive growth of national steel industry, we believe JPRS will be able to<br />
perform better in the years ahead.<br />
Risk free rate, equity premium, and beta assumption are 5.5%, 7.6%,<br />
and 1.0x respectively.<br />
Business Prospects<br />
In line with the positive growth of infrastructure, construction,<br />
infrastructure and automotive sectors, we believe steel industry has<br />
prospective outlook in the years ahead. This year, steel consumption in<br />
domestic is estimated to increase by 9% YoY or about 11 million tons,<br />
compared to 10.4 million tons in 2012. Meanwhile, domestic production<br />
capacity is predicted only 6.3 million tons this year. By considering above<br />
factors and augmented with JPRS product distribution for domestic market,<br />
we foresee that JPRS’s revenue will be able to grow by 5% CAGR during<br />
2011 – 2016 periods.<br />
Table 1: Performance Summary<br />
2009 2010 2011 2012P 2013P<br />
Revenue [IDR bn] 303 428 641 461 533<br />
Pre-tax Profit [IDR bn] 1 39 48 15 29<br />
Net Profit [IDR bn] 1 28 37 11 22<br />
EPS [IDR] 0.7 37.9 49.9 15.1 29.1<br />
EPS Growth [%] (99.0) 5,437.5 31.5 (69.7) 92.2<br />
P/E [x] 103.5 15.3 9.7 23.8* 12.4*<br />
PBV [x] 0.7 1.3 1.0 0.8* 0.7*<br />
Source: <strong>PT</strong> <strong>Jaya</strong> <strong>Pari</strong> <strong>Steel</strong> <strong>Tbk</strong>, Pefindo Equity & Index Valuation Division Estimates<br />
*) Based on share Price as of March 19, 2013 – IDR 360 per share<br />
March 20, 2013 Page 2 of 10
GROWTH VALUE MAP<br />
“Disclaimer statement in the last page<br />
is an integral part of this report”<br />
www.pefindo.com<br />
<strong>Jaya</strong> <strong>Pari</strong> <strong>Steel</strong>, <strong>Tbk</strong><br />
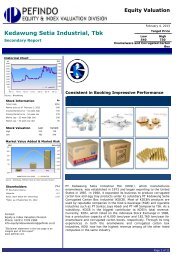
Growth-Value Map below provides an overview of market expectations for the<br />
companies listed on the IDX. Current Performance (CP) metric, running along the<br />
horizontal axis, is a portion of current stock market value that can be linked to<br />
the perpetuity of current company’s performance in profitability. Growth<br />
Expectations (GE) metric, plotted on the vertical axis, is the difference between<br />
the current stock market value and the value of current performance. Both<br />
metrics are normalized by the company’s book value.<br />
Growth-Value Map divides companies into four clusters:<br />
Excellent Value Managers (“Q-1”)<br />
Market expects companies in Q-1 to surpass their benchmark in<br />
profitability and growth.<br />
Expectation Builders (“Q-2”)<br />
Market has relatively low expectations of profitability in the short term<br />
from companies in Q-2, but has growth expectations exceed the<br />
benchmark.<br />
Traditionalists (“Q-3”)<br />
Market has low growth expectations of companies in the Q-3, although<br />
they showed good profitability in the short term.<br />
Asset-loaded Value Managers (“Q-4”)<br />
Market has low expectations in terms of profitability and growth for<br />
companies in Q-4.<br />
Growth Expectations<br />
Figure 1: Growth-Value Map of JPRS (<strong>Steel</strong> Industry)<br />
6<br />
5<br />
4<br />
3<br />
2<br />
1<br />
0<br />
-1<br />
-2<br />
Q-2 Q-1<br />
JPRS<br />
Q-4 Q-3<br />
0 1 2 3 4<br />
Current Performance (CP)<br />
Source: Bloomberg, Pefindo Equity & Index Valuation Division<br />
Based on financial report and market data, JPRS is classified in the Expectation<br />
Builders (Q-2) cluster. Market has higher growth expectation in the long term,<br />
but relatively lower expectation of profitability in the short term. JPRS has the<br />
opportunity to move to Excellent Value Managers by way of strengthening its<br />
internal growth and regularly updating its economic success to public.<br />
March 20, 2013 Page 3 of 10
BUSINESS INFORMATION<br />
“Disclaimer statement in the last page<br />
is an integral part of this report”<br />
www.pefindo.com<br />
<strong>Jaya</strong> <strong>Pari</strong> <strong>Steel</strong>, <strong>Tbk</strong><br />
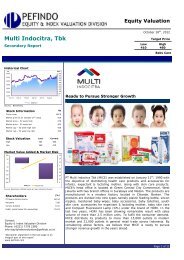
Supported by Domestic Market Optimism in 2013<br />
Indonesian steel market is forecasted to reach IDR71 trillion, up by 7% YoY<br />
compared to IDR66 trillion in 2012. It is mainly caused by solid economic growth<br />
in domestic that could drive to the increasing of manufacture, automotive and<br />
infrastructure activities. Despite shadowed by financial crisis in USA and Europe,<br />
we believe it will not affect domestic steel manufacturers since they can maintain<br />
their sales volume by selling the products in domestic market.<br />
in IDR trillion<br />
80<br />
70<br />
60<br />
50<br />
40<br />
30<br />
20<br />
10<br />
0<br />
Figure 2: Indonesia <strong>Steel</strong> Market and <strong>Steel</strong><br />
Consumption<br />
41.5<br />
March 20, 2013 Page 4 of 10<br />
63.7<br />
66.4<br />
71.05<br />
2010 2011 2012P 2013P<br />
National <strong>Steel</strong> Market National <strong>Steel</strong> Consumption<br />
Source: IISA, various source processed by Pefindo Equity & Index Valuation Division<br />
Meanwhile, there is an increasing raw material price since early this year. As a<br />
result, several steel manufacturer has increased their selling price around 13%-<br />
15%. Raw material price in January 2013 compared to October 2012 has<br />
increased significantly, particularly scrap and iron ore which rose by 15% and<br />
30%, respectively.<br />
in USD<br />
200<br />
180<br />
160<br />
140<br />
120<br />
100<br />
80<br />
60<br />
40<br />
20<br />
Figure 3: Iron Ore Price<br />
0<br />
Aug-12 Sep-12 Oct-12 Nov-12 Dec-12 Jan-13<br />
China iron ore spot price Hebei/Tangshan<br />
Source: Bloomberg, Pefindo Equity & Index Valuation Division<br />
12<br />
10<br />
8<br />
6<br />
4<br />
2<br />
0<br />
in million ton
FINANCE<br />
“Disclaimer statement in the last page<br />
is an integral part of this report”<br />
www.pefindo.com<br />
<strong>Jaya</strong> <strong>Pari</strong> <strong>Steel</strong>, <strong>Tbk</strong><br />
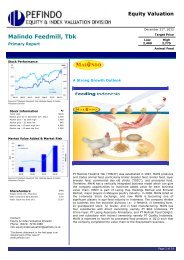
Better Financial Position<br />
In the last few years, JPRS financial position looks better, as depicted by the<br />
increasing liquidity and decreasing debt to equity ratio (DER). We noted that<br />
JPRS current ratio and DER were recorded by 2.9x and 0.3x in 2009, then it<br />
became 10.0x and 0.1x, respectively in 9M12. Considering above historical result,<br />
we believe JPRS will be able to maintain stable balance sheet ahead.<br />
(IDR billion)<br />
400<br />
350<br />
300<br />
250<br />
200<br />
150<br />
100<br />
50<br />
0<br />
218<br />
Figure 4: Parts of JPRS Balance Sheet<br />
76 82<br />
286<br />
272<br />
103111<br />
300 305<br />
March 20, 2013 Page 5 of 10<br />
90100<br />
338<br />
243<br />
24<br />
35<br />
2009 2010 2011 9M12<br />
Current Asset Current Liabilities Total Liabilities Total Equity<br />
Source: <strong>PT</strong> <strong>Jaya</strong> <strong>Pari</strong> <strong>Steel</strong> <strong>Tbk</strong>, Pefindo Equity & Index Valuation Division<br />
Business Prospect<br />
In line with the positive growth of infrastructure, construction as well as<br />
automotive sectors, we believe steel industry has prospective outlook in the years<br />
ahead. This year, steel consumption is estimated to increase by 9% YoY or about<br />
11 million tons, compared to 10.4 million tons in 2012. Meanwhile, domestic<br />
production capacity is predicted only 6.3 million tons this year. By considering<br />
above factors, we foresee that JPRS’s revenue will be able to grow by 5% CAGR<br />
during 2011 – 2016 periods.<br />
IDR billion<br />
900<br />
800<br />
700<br />
600<br />
500<br />
400<br />
300<br />
200<br />
100<br />
0<br />
641<br />
Figure 5: JPRS’s Revenue Estimation<br />
461<br />
533<br />
614<br />
709<br />
822<br />
2011 2012P 2013P 2014P 2015P 2016P<br />
Revenue Estimation<br />
Source: <strong>PT</strong> <strong>Jaya</strong> <strong>Pari</strong> <strong>Steel</strong> <strong>Tbk</strong>, Pefindo Equity & Index Valuation Division Estimates<br />
342
INDUSTRY COMPARISON<br />
“Disclaimer statement in the last page<br />
is an integral part of this report”<br />
www.pefindo.com<br />
<strong>Jaya</strong> <strong>Pari</strong> <strong>Steel</strong>, <strong>Tbk</strong><br />
Table 2: JPRS and Peers Performance Summary as of September 2012<br />
JPRS GDST BTON BAJA KRAS<br />
Sales [IDR, bn] 244 1,222 118 779 15,878<br />
Gross Profit [IDR, bn] 15 112 23 56 1,150<br />
Net Profit [IDR, bn] 4 36 19 14 8<br />
Total Asset [IDR, bn] 377 1,164 144 840 23,376<br />
Total Liabilities [IDR, bn] 35 382 36 588 13,254<br />
Total Equity [IDR, bn] 342 782 107 252 10,122<br />
Growth YoY<br />
Sales [%] (41.2) (22.3) 2.9 24.7 25.5<br />
Gross Profit [%] (69.8) (48.1) 25.9 129.9 (5.0)<br />
Net Profit [%] (86.3) (64.4) 57.8 (13.8) (99.3)<br />
Profitability<br />
Gross Margin [%] 6.1 9.2 19.3 7.2 7.2<br />
Net Margin [%] 1.5 3.0 16.0 1.8 0.0<br />
ROA [%] 1.0 3.1 13.1 1.6 0.0<br />
ROE [%] 1.1 4.6 17.5 5.4 0.1<br />
Leverage<br />
DER [x] 0.1 0.5 0.3 2.3 1.3<br />
Source: <strong>PT</strong> <strong>Jaya</strong> <strong>Pari</strong> <strong>Steel</strong> <strong>Tbk</strong>, <strong>PT</strong> Gunawan Dianjaya <strong>Steel</strong> <strong>Tbk</strong>, <strong>PT</strong> Betonjaya Manunggal <strong>Tbk</strong>, <strong>PT</strong> Saranacentral Bajatama <strong>Tbk</strong>, <strong>PT</strong> Krakatau<br />
<strong>Steel</strong> <strong>Tbk</strong>, Pefindo Equity & Index Valuation Division<br />
March 20, 2013 Page 6 of 10
TARGET PRICE<br />
“Disclaimer statement in the last page<br />
is an integral part of this report”<br />
www.pefindo.com<br />
VALUATION<br />
Methodology<br />
<strong>Jaya</strong> <strong>Pari</strong> <strong>Steel</strong>, <strong>Tbk</strong><br />
We apply Discounted Cash Flow (DCF) method as the main valuation<br />
approach considering the income growth is a value driver in JPRS instead of<br />
asset growth.<br />
Furthermore, we also apply Guideline Company Method (GCM) as comparison<br />
method.<br />
This valuation is based on 100% shares price as of March 19, 2013, using<br />
JPRS’s financial report as of September 30, 2012, for our fundamental<br />
analysis.<br />
Value Estimation<br />
We use Cost of Capital of 13.5% and Cost of Equity of 13.5% based on the<br />
following assumptions:<br />
Table 3: Assumption<br />
Risk free rate [%]* 5.5<br />
Risk premium [%]* 7.6<br />
Beta [x]* 1.0<br />
Cost of Equity [%] 13.5<br />
Marginal tax rate [%] 25.0<br />
WACC [%] 13.5<br />
Source: Bloomberg, Pefindo Equity & Index Valuation Division Estimates<br />
Notes: * As of March 19, 2013<br />
Target price for 12 months based on valuation as per March 19, 2013 is as<br />
follows:<br />
Using DCF method with discount rate assumption 13.5% is IDR430 –<br />
IDR470 per share.<br />
Using GCM method (PBV 1.9X and P/E 18.1X) is IDR280 – IDR880<br />
per share.<br />
In order to obtain a value which represents both value indications, we have<br />
weighted both DCF and GCM methods by 70%:30%.<br />
Based on the above calculation, target price of JPRS for 12 month is IDR380<br />
– IDR590 per share<br />
Table 4: Summary of DCF Method Valuation<br />
Conservative Moderate Aggressive<br />
PV of Free Cash Flows – IDR bn 62 65 68<br />
PV Terminal Value – IDR bn 250 263 276<br />
Non-Operating Assets – IDR bn 7 7 7<br />
Total Equity Value – IDR bn 319 336 352<br />
Number of Share, mn shares 750 750 750<br />
Fair Value per Share, IDR 430 450 470<br />
Source: Pefindo Equity & Index Valuation Division Estimates<br />
March 20, 2013 Page 7 of 10
“Disclaimer statement in the last page<br />
is an integral part of this report”<br />
www.pefindo.com<br />
Table 5: GCM Comparison<br />
Valuation, March 19, 2013<br />
JPRS GDST BAJA Average<br />
P/E, [x] 18.2 12.9 23.3 18.1<br />
P/BV, [x] 0.8 1.1 3.8 1.9<br />
Source: Bloomberg, Pefindo Equity & Index Valuation Division Estimates<br />
Table 6: Summary of GCM Method Valuation<br />
Multiples<br />
(x)<br />
Est. EPS<br />
(IDR)<br />
Est. BV/Share<br />
(IDR)<br />
<strong>Jaya</strong> <strong>Pari</strong> <strong>Steel</strong>, <strong>Tbk</strong><br />
Value<br />
(IDR)<br />
P/E 18.1 15 - 280<br />
P/BV 1.9 - 460 880<br />
Source: Bloomberg, Pefindo Equity & Index Valuation Division Estimates<br />
Table 7: Fair Value Reconciliation<br />
Fair Value per Share [IDR]<br />
DCF GCM Average<br />
Upper limit 470 880 590<br />
Bottom limit 430 280 380<br />
Weight 70% 30%<br />
Source: Pefindo Equity & Index Valuation Division Estimates<br />
March 20, 2013 Page 8 of 10
Table 8: Consolidated Statements of Comprehensive<br />
Income<br />
(IDR billion) 2009 2010 2011 2012P 2013P<br />
Net Sales 303 428 641 461 533<br />
COGS (267) (372) (585) (432) (488)<br />
Gross Profit 35 56 57 29 45<br />
Operating Expense (34) (17) (9) (14) (16)<br />
Pre-tax Profit 1 39 48 15 29<br />
Tax (1) (10) (11) (4) (7)<br />
Net Profit 1 28 37 11 22<br />
Source: <strong>PT</strong> <strong>Jaya</strong> <strong>Pari</strong> <strong>Steel</strong> <strong>Tbk</strong>., Pefindo Equity & Index Valuation Division Estimates<br />
Table 9: Consolidated Statements of Financial Position<br />
Assets<br />
(IDR billion) 2009 2010 2011 2012P 2013P<br />
Current Assets<br />
Cash and cash<br />
equivalents<br />
“Disclaimer statement in the last page<br />
is an integral part of this report”<br />
www.pefindo.com<br />
1 49 12 32 41<br />
Receivables 128 94 192 160 185<br />
Inventory 79 117 94 57 66<br />
Other Assets 9 26 7 23 23<br />
Total Current Assets 218 286 305 272 315<br />
Fixed Assets 19 18 15 15 15<br />
Other Assets 117 108 118 118 118<br />
Total Assets 354 411 438 404 448<br />
Liabilities<br />
Trade payables 73 93 80 35 60<br />
Other Short-term<br />
payables<br />
3 11 10 12 13<br />
Other long-term payables 7 8 10 10 10<br />
Total Liabilities 82 111 100 58 84<br />
Total Equity 272 300 338 347 364<br />
Source: <strong>PT</strong> <strong>Jaya</strong> <strong>Pari</strong> <strong>Steel</strong> <strong>Tbk</strong>, Pefindo Equity & Index Valuation Division Estimates<br />
Figure 6: Historical P/E and P/BV<br />
<strong>Jaya</strong> <strong>Pari</strong> <strong>Steel</strong>, <strong>Tbk</strong><br />
Source: <strong>PT</strong> <strong>Jaya</strong> <strong>Pari</strong> <strong>Steel</strong> <strong>Tbk</strong>., Pefindo Equity & Index Valuation Division<br />
Figure 7: Historical ROA, ROE and TAT<br />
Source: <strong>PT</strong> <strong>Jaya</strong> <strong>Pari</strong> <strong>Steel</strong> <strong>Tbk</strong>., Pefindo Equity & Index Valuation Division<br />
Table 10 :Key Ratios<br />
Growth [%]<br />
Ratio 2009 2010 2011 2012P 2013P<br />
Sales (58.7) 41,2 49.9 (28.1) 15.6<br />
Operating Profit (98.2) 2,815.2 24.4 (68.5) 92.2<br />
EBITDA (97.6) 2,102.5 22.6 (62.3) 74.4<br />
Net Profit (99.0) 5,437.5 31.5 (69.7) 92.2<br />
Profitability [%]<br />
Gross Margin 11.7 13.0 8.9 6.3 8.4<br />
Operating Margin 0.4 9.0 7.5 3.3 5.5<br />
EBITDA Margin 0.6 9.5 7.8 4.1 6.2<br />
Net Margin 0.2 6.7 5.8 2.5 4.1<br />
ROA 0.1 6.9 8.5 2.8 4.9<br />
ROE 0.2 9.5 11.1 3.3 6.0<br />
Solvability [X]<br />
Debt to Equity 0.3 0.4 0.3 0.2 0.2<br />
Debt to Asset 0.2 0.3 0.2 0.1 0.2<br />
Liquidity [X]<br />
Current Ratio 2.9 2.8 3.4 5.8 4.3<br />
Quick Ratio 1.2 1.4 1.2 1.8 1.4<br />
Source: <strong>PT</strong> <strong>Jaya</strong> <strong>Pari</strong> <strong>Steel</strong> <strong>Tbk</strong>. Pefindo Equity & Index Valuation Division Estimates<br />
March 20, 2013 Page 9 of 10
“Disclaimer statement in the last page<br />
is an integral part of this report”<br />
www.pefindo.com<br />
DISCLAIMER<br />
<strong>Jaya</strong> <strong>Pari</strong> <strong>Steel</strong>, <strong>Tbk</strong><br />
This report was prepared based on the trusted and reliable sources. Nevertheless, we do not<br />
guarantee its completeness, accuracy and adequacy. Therefore we do not responsible of any<br />
investment decision making based on this report. As for any assumptions, opinions and<br />
predictions were solely our internal judgments as per reporting date, and those judgments are<br />
subject to change without further notice.<br />
We do not responsible for mistake and negligence occurred by using this report. Last<br />
performance could not always be used as reference for future outcome. This report is not an<br />
offering recommendation, purchase or holds particular shares. This report might not be suitable<br />
for some investors. All opinion in this report has been presented fairly as per issuing date with<br />
good intentions; however it could be change at any time without further notice. The price, value<br />
or income from each share of the Company stated in this report might lower than the investor<br />
expectation and investor might obtain lower return than the invested amount. Investment is<br />
defined as the probable income that will be received in the future; nonetheless such return may<br />
possibly fluctuate. As for the Company which its share is denominated other than Rupiah, the<br />
foreign exchange fluctuation may reduce the value, price or investor investment return. This<br />
report does not contain any information for tax consideration in investment d ecision making.<br />
The share price target in this report is a fundamental value, not a fair market value nor a<br />
transaction price reference required by the regulations.<br />
The share price target issued by Pefindo Equity & Index Valuation Division is not a<br />
recommendation to buy, sell or hold particular shares and it could not be considered as an<br />
investment advice from Pefindo Equity & Index Valuation Division as its scope of service to, or<br />
in relation to some parties, including listed companies, financial adv isor, broker, investment<br />
bank, financial institution and intermediary, in correlation with receiving rewards or any other<br />
benefits from that parties.<br />
This report is not intended for particular investor and cannot be used as part of investment<br />
objective on particular shares and neither an investment recommendation on particular shares<br />
or an investment strategy. We strongly recommended investor to consider the suitable situation<br />
and condition at first before making decision in relation with the figure in thi s report. If it is<br />
necessary, kindly contact your financial advisor.<br />
<strong>PEFINDO</strong> keeps the activities of Equity Valuation separate from Ratings to preserve<br />
independence and objectivity of its analytical processes and products. <strong>PEFINDO</strong> has established<br />
policies and procedures to maintain the confidentiality of certain non -public information<br />
received in connection with each analytical process. The entire process, methodology and the<br />
database used in the preparation of the Reference Share Price Target Report as a whole is<br />
different from the processes, methodologies and databases used <strong>PEFINDO</strong> in doing the rating.<br />
This report was prepared and composed by Pefindo Equity & Index Valuation Division with the<br />
objective to enhance shares price transparency of listed companies in Indonesia Stock Exchange (IDX).<br />
This report is also free of other party’s influence, pressure or force either from IDX or the listed company<br />
which reviewed by Pefindo Equity & Index Valuation Division. Pefindo Equity & Index Valuation<br />
Division will earn reward amounting to IDR 20 mn each from IDX and the reviewed company for issuing<br />
report twice per year. For further information, please visit our website at http://www.pefindo.com<br />
This report is prepared and composed by Pefindo Equity & Index Valuation Division. In<br />
Indonesia, this report is published in our website and in IDX website.<br />
March 20, 2013 Page 10 of 10