
You also want an ePaper? Increase the reach of your titles
YUMPU automatically turns print PDFs into web optimized ePapers that Google loves.
<strong>Multi</strong> <strong>Indocitra</strong>, <strong>Tbk</strong><br />
Secondary Report<br />
Historical Chart<br />
JCI<br />
4.400<br />
4.200<br />
4.000<br />
3.800<br />
3.600<br />
3.400<br />
3.200<br />
Oct-11 Dec-11 Feb-12 Apr-12 Jun-12 Aug-12<br />
Source: Bloomberg<br />
JCI MICE<br />
Stock Information<br />
Contact:<br />
Equity & Index Valuation Division<br />
Phone: (6221) 7278 2380<br />
info-equityindexvaluation@pefindo.co.id<br />
“Disclaimer statement in the last page is an<br />
integral part of this report”<br />
www.pefindo.com<br />
MICE<br />
500<br />
450<br />
400<br />
350<br />
300<br />
250<br />
200<br />
150<br />
100<br />
50<br />
0<br />
Ticker code MICE<br />
Market price as of October 17 th 2012 410<br />
Market price – 52 week high 470<br />
Market price – 52 week low 305<br />
Market cap – 52 week high (bn) 426<br />
Market cap – 52 week low (bn) 153<br />
Stock Valuation Last Current<br />
High 405 460<br />
Low 360 410<br />
Market Value Added & Market Risk<br />
100<br />
50<br />
0<br />
-50<br />
-100<br />
-150<br />
-200<br />
-250<br />
MVA Market Risk<br />
Source: Bloomberg, Pefindo Equity & Index Valuation Division<br />
Shareholders<br />
Rp<br />
1,6<br />
1,4<br />
1,2<br />
1<br />
0,8<br />
0,6<br />
0,4<br />
0,2<br />
0<br />
(%)<br />
<strong>PT</strong> Buana Graha Utama 60.44<br />
Haiyanto 7.98<br />
Surono Subekti 6.41<br />
Public (each below 5% ownership) 25.18<br />
Ready to Pursue Stronger Growth<br />
Equity Valuation<br />
October 18 th , 2012<br />
Target Price<br />
Low High<br />
410 460<br />
Baby Care<br />
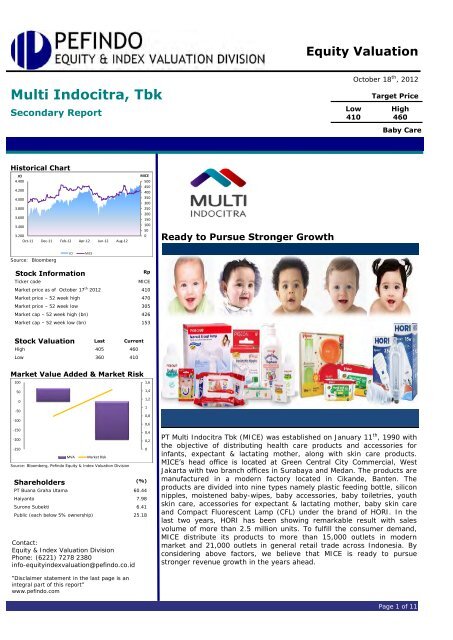
<strong>PT</strong> <strong>Multi</strong> <strong>Indocitra</strong> <strong>Tbk</strong> (MICE) was established on January 11 th , 1990 with<br />
the objective of distributing health care products and accessories for<br />
infants, expectant & lactating mother, along with skin care products.<br />
MICE’s head office is located at Green Central City Commercial, West<br />
Jakarta with two branch offices in Surabaya and Medan. The products are<br />
manufactured in a modern factory located in Cikande, Banten. The<br />
products are divided into nine types namely plastic feeding bottle, silicon<br />
nipples, moistened baby-wipes, baby accessories, baby toiletries, youth<br />
skin care, accessories for expectant & lactating mother, baby skin care<br />
and Compact Fluorescent Lamp (CFL) under the brand of HORI. In the<br />
last two years, HORI has been showing remarkable result with sales<br />
volume of more than 2.5 million units. To fulfill the consumer demand,<br />
MICE distribute its products to more than 15,000 outlets in modern<br />
market and 21,000 outlets in general retail trade across Indonesia. By<br />
considering above factors, we believe that MICE is ready to pursue<br />
stronger revenue growth in the years ahead.<br />
Page 1 of 11
INVESTMENT PARAMETERS<br />
“Disclaimer statement in the last page<br />
is an integral part of this report”<br />
www.pefindo.com<br />
Target Price Adjustment<br />
<strong>Multi</strong> <strong>Indocitra</strong>, <strong>Tbk</strong><br />
We made some adjustments to our previous forecast and adjust MICE’s Target<br />
Price to the range of Rp 410 - Rp 460 per share, based on the following<br />
considerations:<br />
Although MICE’s sales performance in 2011 was slightly lower than our<br />
previous projection, but MICE’s profitability achievement was above ours.<br />
During 2011, MICE succeeded to book operating and net profit as much as<br />
Rp 53 billion and Rp 36 billion, respectively. It was higher by 3% and 16%<br />
than our projection, mainly due to MICE’s efficiency in COGS which further<br />
cascaded the bottom line performance.<br />
Up to 1H12, MICE succeeded to book encouraging result with 18% YoY of<br />
revenue growth. It positively affects the performance of profitability, namely<br />
gross, operating and net profit which grew by 12% YoY, 2% YoY and 6%,<br />
respectively. Positive result in 1H12 was mainly bolstered by the sales of<br />
baby care products, contribution of HORI as well as better efficiency in<br />
operational expense. And in 2012, we are confident that MICE could generate<br />
Rp 532 billion of revenue considering both baby care and lamp demand<br />
continues to grow.<br />
Since its launching in 2010, HORI has been posting magnificent performance.<br />
In 2011, MICE successfully sold as many as 2.5 million units of lamp or<br />
equivalent to Rp 43 billion. Considering HORI products are used by<br />
household, in which appears as the largest customer of PLN and expected to<br />
continue growing each year, plus more than 32 HORI outlets in domestic, we<br />
believe HORI’s sales volume could hit 3.6 million units, or around Rp 65<br />
billion in 2012.<br />
Assumption of risk free rate, equity premium and beta reach 5.8%, 6.3% and<br />
1.4x, respectively.<br />
Keep Success in Maintaining its Predicate as Market Leader<br />
In general, MICE classifies its products into two big categories, among others:<br />
baby acessories and lamp. Of those products, the major contribution to MICE’s<br />
total revenue comes from baby accessories especially in plastic feeding bottle<br />
and silicon nipples. According to recent data, the sales value of plastic feeding<br />
bottle and silicon nipples with Pigeon brand are taking account of 65% in<br />
national level. During 2008 – 2011 periods, MICE’s revenue from plastic feeding<br />
bottle and silicon nipples grew at 19% CAGR. Considering the GDP of Indonesian<br />
that continues to soar, in which can trigger stronger purchasing power and<br />
augmented with MICE’s integrated marketing activities to enlarge Pigeon brand<br />
equity, we believe the revenue from plastic feeding bottle and silicon nipples will<br />
climb by 14% YoY or reach Rp 206 billion in 2012.<br />
Business Prospects<br />
We are positive to view MICE’s business prospect in the years ahead based on<br />
these consideration: Indonesian economy that managed to grow by 6.4% YoY in<br />
1H12 and estimated to reach 6.2% YoY by the end of 2012, stable growth of<br />
birthrate, huge number of young family generation, sell its products to domestic<br />
as well as strong Pigeon brand as market leader in baby care products.<br />
Meanwhile, we view that the other MICE’s product line, CFL (HORI), also looks<br />
prospective underpinned by CFL market which is predicted to climb by 23% YoY<br />
or reach 320 million units in 2012. By considering above factors and augmented<br />
with MICE’s vigorous promotion, we believe MICE will be able to record Rp 532<br />
billion of revenue this year, or reflecting 14% YoY growth and 12% CAGR in<br />
2011 – 2015 periods.<br />
October 18 th , 2012 Page 2 of 11
“Disclaimer statement in the last page<br />
is an integral part of this report”<br />
www.pefindo.com<br />
Table 1: Performance Summary<br />
<strong>Multi</strong> <strong>Indocitra</strong>, <strong>Tbk</strong><br />
2009 2010 2011 2012P 2013P<br />
Revenue (Rp bn) 340 423 465 532 600<br />
Pre-tax Profit (Rp bn) 49 47 50 60 67<br />
Net Profit (Rp bn) 35 34 36 46 50<br />
EPS (Rp) 58 56 61 76 83<br />
EPS Growth (%) 45 (3) 8 26 9<br />
P/E (x) 4.5 7.2 6.0 5.4* 4.9*<br />
PBV (x) 0.6 0.9 0.7 0.7* 0 .7*<br />
Source: <strong>PT</strong> <strong>Multi</strong> <strong>Indocitra</strong> <strong>Tbk</strong> ., Pefindo Equity and Index Valuation Division Estimates<br />
Notes: * Based on Share Price as of October 17 th , 2012 – Rp 410/share<br />
October 18 th , 2012 Page 3 of 11
GROWTH VALUE MAP<br />
“Disclaimer statement in the last page<br />
is an integral part of this report”<br />
www.pefindo.com<br />
<strong>Multi</strong> <strong>Indocitra</strong>, <strong>Tbk</strong><br />
Growth-Value Map provides overview of market expectations for the companies<br />
listed on IDX. Current Performance (“CP”) metric, running along the horizontal<br />
axis, is a portion of current stock market value that can be linked to the<br />
perpetuity of current company’s performance in profitability. Growth Expectations<br />
(“GE”) metric, plotted on the vertical axis, is the difference between current stock<br />
market value and the value of current performance. Both metrics are normalized<br />
by the company’s book value.<br />
Growth-Value Map divides companies into four clusters, they are:<br />
Excellent Value Managers (“Q-1”)<br />
Market expects companies in Q-1 to surpass their benchmark in<br />
profitability and growth.<br />
Expectation Builders (“Q-2”)<br />
Market has relatively low expectations of profitability from companies in Q-<br />
2 in the short term, but has growth expectations exceed the benchmark.<br />
Traditionalists (“Q-3”)<br />
Market has low growth expectations of companies in the Q-3, although<br />
they showed a good profitability in the short term.<br />
Asset-loaded Value Managers (“Q-4”)<br />
Market has low expectations in terms of profitability and growth for<br />
companies in Q-4.<br />
Growth Expectations<br />
6<br />
5<br />
4<br />
3<br />
2<br />
1<br />
0<br />
-1<br />
-2<br />
-3<br />
-4<br />
Q-2<br />
Q-4<br />
Figure 1: Growth-Value Map of MICE<br />
0 1 2 3 4<br />
Current Performance (CP)<br />
October 18 th 2012 Page 4 of 11<br />
MICE<br />
Source: Bloomberg, Pefindo Equity & Index Valuation Division<br />
Based on financial statement and market value, MICE is lying in Asset Loaded<br />
Manager cluster. Market has relatively low expectation to MICE in term of<br />
profitability and growth. However, we believe MICE’s strategic plan to boost<br />
Pigeon brand and HORI brand by opening new plenty outlets across Indonesia will<br />
lift its revenue up. Also, it may still need a better investor relation effort to make<br />
investors realize the company profitability potentials. MICE has the opportunity to<br />
move to Excellent Value Managers’ cluster by way of strengthening their<br />
internal growth capabilities and doing actions to drive market perceptions of their<br />
economic success.<br />
Q-1<br />
Q-3
BUSINESS INFORMATION<br />
“Disclaimer statement in the last page<br />
is an integral part of this report”<br />
www.pefindo.com<br />
<strong>Multi</strong> <strong>Indocitra</strong>, <strong>Tbk</strong><br />
The Only Company in this Industry Listed in IDX<br />
Since 2005, MICE has been listed in Indonesia Stock Exchange (IDX). This action<br />
reflects MICE’s seriousness in developing its business and introducing its identity<br />
to public. Among many local and foreign players in this industry, MICE is the only<br />
listed company that engage in baby care products. Through its long experience<br />
and underpinned by Pigeon brand, currently MICE takes dominant position in<br />
baby care industry with around 65% market share.<br />
Improving Economic Condition Benefits MICE’s Business<br />
Indonesia’s economic growth which attained 6.4% YoY in 1H12 has attracted<br />
many foreign companies to invest in domestic. We estimate that the growth of<br />
Indonesian economy may reach 6.2% YoY in 2012. Along with manageable<br />
inflation of 4.53% YoY in 1H12, low benchmark interest rate (BI Rate) of 5.75%,<br />
and improving GDP per capita which may break USD 4,000 level in 2012, we<br />
believe that MICE’s business, as baby care producer, will remain prospective.<br />
Supported by other factors namely huge number of young family generation,<br />
stable growth of birthrate, strong Pigeon brand equity as well as strong demand<br />
of CFL, we eye that MICE could enjoy satisfactory revenue growth in the years<br />
ahead.<br />
Table 2: Indonesia’s Economic Indicators, 2008 – 1H12<br />
Indicators Unit 2008 2009 2010 2011 1H12<br />
GDP Growth % YoY 6.1 4.5 6.1 6.5 6.4<br />
Inflation Rate % YoY 11.06 2.78 6.98 3.79 4.53<br />
Mid-Exchange Rate Rp/USD 9,136 9,680 10,398 8,779 9,480<br />
BI Rate % 9.25 6.50 6.50 6.00 5.75<br />
GDP per Capita USD 2,245 2,350 3,010 3,543<br />
Third Party Funds Rp tn 1,682 1,913 2,304 2,736 2,867<br />
Foreign Exchange Reserves USD bn 52<br />
66<br />
96 110 107<br />
Source: Bank Indonesia, Central Bureau of Statistic, Pefindo Equity & Index Valuation Division<br />
Providing High-Quality Products<br />
One important factor that makes MICE can retain the biggest market share in its<br />
industry is due to the quality of its products. The manufacturing of Pigeon<br />
products, which is carried out by the subsidiary and affiliated company have been<br />
carefully checked for its quality to make sure that the quality standard which is<br />
stipulated by Pigeon Corporation of Japan are followed. <strong>PT</strong>. <strong>Multi</strong>elok Cosmetics<br />
and <strong>PT</strong>. Pigeon Indonesia have obtained some certifications, namely:<br />
<strong>PT</strong>. <strong>Multi</strong>elok Cosmetics: Certification AS/NZS ISO 9001:2000 from SAI Global<br />
Limited Australia, Certification for Good Manufacturing Process (GMP) from the<br />
Indonesian Medicines and Food Supervisory Body<br />
<strong>PT</strong>. Pigeon Indonesia: Certification AS/NZS ISO 9001:2000 from SAI Global<br />
Limited Australia.<br />
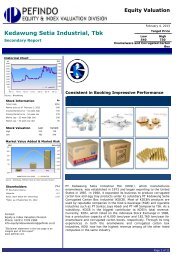
Wide Distribution Coverage to Boost Sales<br />
We believe MICE’s effort to promote their products across Indonesia will be<br />
running smoothly. Besides doing partnership with the hospitals in remote area to<br />
introduce Pigeon, MICE also distribute the products in wide coverage. Currently,<br />
MICE’s distribution channel is supported by 15,500 outlets in modern market and<br />
21,000 outlets in general retail trade. Such condition positively affects MICE’s<br />
revenue as it grew by 15% CAGR during 2008 – 2011 periods. This year, MICE<br />
plans to spend Rp 70 billion for promotion, add new machines as well as<br />
distribution area. And we expect such investment could lead MICE’s revenue to<br />
climb by 14% YoY to reach Rp 532 billion in 2012.<br />
October 18 th , 2012 Page 5 of 11
“Disclaimer statement in the last page<br />
is an integral part of this report”<br />
www.pefindo.com<br />
Figure 2: MICE’s Distribution Coverage<br />
Modern market: 15.500 outlet General trade: 21.000 outlet<br />
Source: <strong>PT</strong> <strong>Multi</strong> <strong>Indocitra</strong> <strong>Tbk</strong>., Pefindo Equity & Index Valuation Division<br />
<strong>Multi</strong> <strong>Indocitra</strong>, <strong>Tbk</strong><br />
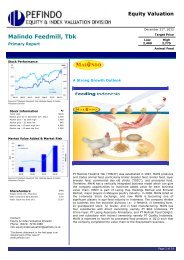
Jabodetabek Remains Fascinating Market<br />
In the last three years period, MICE’s revenue successfully soared by 17% CAGR.<br />
It continued in 1H12, in which MICE recorded 18% YoY revenue growth or<br />
equivalent to Rp 265 billion. From that figure, Jabodetabek takes a major<br />
contribution with 39% to MICE’s total revenue. It is the followed by Sumatera of<br />
14%, East Java of 13%, Central Java of 10%, West Java of 9%, Sulawesi of 7%,<br />
Kalimantan and Bali of 5% and 3%. As the business that relies on people<br />
purchasing power, we eye that MICE’s market positioning in Jabodetabek is<br />
appropriate since the economic growth in Jabodetabek continues to rise. As of<br />
1H12, the economic growth in that region was cumulatively 6.6% YoY.<br />
Figure 3: MICE’s Sales by Area<br />
Source: <strong>PT</strong> <strong>Multi</strong> <strong>Indocitra</strong> <strong>Tbk</strong>., Pefindo Equity & Index Valuation Division<br />
October 18 th , 2012 Page 6 of 11
FINANCE<br />
“Disclaimer statement in the last page<br />
is an integral part of this report”<br />
www.pefindo.com<br />
<strong>Multi</strong> <strong>Indocitra</strong>, <strong>Tbk</strong><br />
Operating and Net Profit are above Expectation<br />
During 2011, MICE’s revenue growth soared by 10% YoY to reach Rp 465 billion<br />
compared to the same period last year, slightly lower than our previous<br />
projection which was Rp 502 billion. It was mainly due to the decreasing sales in<br />
youth skin care products and export. However, from the profitability side such as<br />
operating and net profit, MICE’s achievement was above our projection at the<br />
period. MICE’s actual operating and net profit were Rp 53 billion and Rp 36<br />
billion, while ours were Rp 52 billion and Rp 31 billion.<br />
Figure 4: MICE’s Projection vs Actual Performance<br />
600 502<br />
400<br />
200<br />
0<br />
(in Rp billion)<br />
October 18 th , 2012 Page 7 of 11<br />
465<br />
53 53 31 36<br />
Source: <strong>PT</strong> <strong>Multi</strong> <strong>Indocitra</strong> <strong>Tbk</strong>, Pefindo Equity & Index Valuation Division<br />
Positive Result in 1H12<br />
MICE succeeded to book great performance in 1H12 in term of revenue and<br />
profitability such as gross, operating and net profit growth compared to 1H11<br />
periods. It grew by 18% YoY, 12% YoY, 2% YoY and 6% YoY, respectively. We<br />
view that baby care product is still the main contributor to MICE’s total revenue<br />
at the period. It is followed by export, CFL (HORI) and youth skin care. To boost<br />
higher revenue growth, MICE has allocated around of Rp 70 billion for promotion,<br />
add new machines as well distribution channel. Considering robust demand of<br />
baby care products due to stable growth of birthrate and augmented with<br />
increasing people purchasing power in domestic, we believe MICE will be able to<br />
generate as much as Rp 532 billion in 2012, or reflecting 14% YoY of growth.<br />
Faster Inventory Turnover Leads Better Cash Conversion Cycle<br />
MICE managed to book better inventory turnover, in which indicate its success in<br />
converting inventory to sales. In 1H12, MICE’s inventory turnover reached 127<br />
days, better than the same period last year which was 143 days. After<br />
considering the turnover of trade receivable and trade payable, MICE’s cash<br />
conversion cycle was getting better with 165 days, compared to 1H11 period<br />
which as long as 193 days.<br />
200<br />
150<br />
100<br />
Figure 5: MICE’s Inventory Turnover and Cash<br />
Conversion Cycle<br />
50<br />
0<br />
143<br />
193<br />
127<br />
1H11 1H12<br />
Inventory Turnover Cash Conversion Cycle<br />
Source: <strong>PT</strong> <strong>Multi</strong> <strong>Indocitra</strong> <strong>Tbk</strong>., Pefindo Equity & Index Valuation Division<br />
165<br />
2011<br />
(in days)
“Disclaimer statement in the last page<br />
is an integral part of this report”<br />
www.pefindo.com<br />
<strong>Multi</strong> <strong>Indocitra</strong>, <strong>Tbk</strong><br />
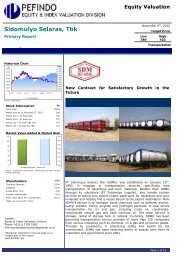
Remarkable Performance of HORI<br />
Besides selling baby care products, MICE also provide CFL under the brand of<br />
HORI. The existence of HORI is considered a new player in national lamp<br />
industry. However, surprisingly, in the first year of its performance in 2010, HORI<br />
successfully generated Rp 33 billion of revenue. Later in 2011, HORI’s revenue<br />
soared by 31% YoY to reach Rp 43 billion, or in term of sales volume reached 2.5<br />
million units. Such condition reflects MICE’s ability to diversify its business line.<br />
For 2012, we estimate HORI’s sales volume could grow by 44% YoY to reach 3.6<br />
million units or around Rp 65 billion, citing strong demand of CFL as a result of<br />
growing property in Indonesia.<br />
Figure 6: HORI’s Revenue and CFL Consumption<br />
HORI’s Revenue<br />
Source: <strong>PT</strong> <strong>Multi</strong> <strong>Indocitra</strong> <strong>Tbk</strong> and Various Source Processed by Pefindo Equity Research Division<br />
CFL Consumption<br />
October 18 th , 2012 Page 8 of 11<br />
in million units<br />
350<br />
300<br />
250<br />
200<br />
150<br />
100<br />
50<br />
0<br />
200<br />
260<br />
320<br />
2010 2011 2012P<br />
MICE Business Prospect<br />
We are positive to view MICE’s business prospect in the years ahead based on<br />
these consideration: Indonesian economy managed to grow by 6.4% YoY in 1H12<br />
and estimated to reach 6.2% YoY by the end of 2012, stable growth of birthdate,<br />
huge number of young family generation, major portion of domestic sales as well<br />
as strong Pigeon brand as market leader in baby care products. Meanwhile, we<br />
view that the other MICE’s product line, CFL (HORI), also looks prospective<br />
underpinned by CFL market which is predicted to climb by 23% YoY or reach 320<br />
million units in 2012. By considering above factors and augmented with MICE’s<br />
vigorous promotion, we believe MICE will be able to record Rp 532 billion of<br />
revenue in 2012, or reflecting 14% YoY growth and 12% CAGR in 2011 – 2015<br />
periods.<br />
800<br />
700<br />
600<br />
500<br />
400<br />
300<br />
200<br />
100<br />
0<br />
Figure 7: MICE’s Revenue Estimation<br />
465<br />
532<br />
600<br />
665<br />
(in Rp billion)<br />
737<br />
2011 2012P 2013P 2014P 2015P<br />
MICE's Revenue<br />
Source: <strong>PT</strong> <strong>Multi</strong> <strong>Indocitra</strong> <strong>Tbk</strong>., Pefindo Equity & Index Valuation Division Estimates
TARGET PRICE<br />
“Disclaimer statement in the last page<br />
is an integral part of this report”<br />
www.pefindo.com<br />
VALUATION<br />
Methodology<br />
<strong>Multi</strong> <strong>Indocitra</strong>, <strong>Tbk</strong><br />
We apply Discounted Cash Flow (DCF) method as the main valuation<br />
approach considering the income growth is a value driver in MICE instead of<br />
asset growth.<br />
We do not combine DCF method with Guideline Company Method (GCM) as<br />
there are no similar companies eligible to be compared with MICE in the IDX.<br />
This valuation is based on 100% MICE’s shares price as of October 17 th ,<br />
2012, using MICE’s financial report as of June 30 th , 2012 for our fundamental<br />
analysis.<br />
Value Estimation<br />
We use Cost of Capital of 12.6% and Cost of Equity of 14.3% based on the<br />
following assumption:<br />
Table 3: Assumption<br />
Risk free rate [%]* 5.8<br />
Risk premium [%]* 6.3<br />
Beta [x]* 1.4<br />
Cost of Equity [%] 14.3<br />
Marginal tax rate [%] 25.0<br />
Debt to Equity Ratio [x] 0.23<br />
WACC [%] 12.6<br />
Source: Bloomberg, Pefindo Equity & Index Valuation Division Estimates<br />
Notes: *As of October 17 th , 2012<br />
The target price for 12 months based on Valuation as of October 17 th , 2012<br />
using DCF method with an assumption of 12.6% discount rate is ranging<br />
between Rp 410 to Rp 460 per share.<br />
Table 4: Summary of DCF Method Valuation<br />
Conservative Moderate Aggressive<br />
PV of Free Cash Flows [Rp bn] 60 63 66<br />
PV Terminal Value [Rp bn] 224 238 250<br />
Non-Operating Assets- [Rp bn] 33 33 33<br />
Net Debt [Rp bn] (74) (74) (74)<br />
Total Equity Value [Rp bn] 245 260 275<br />
Number of Share [mn shares] 600 600 600<br />
Fair Value per Share [Rp] 410 435 460<br />
Source: Pefindo Equity & Index Valuation Division Estimates<br />
October 18 th , 2012 Page 9 of 11
Table 5: Income Statement<br />
Income Statement<br />
(in Rp billion)<br />
“Disclaimer statement in the last page<br />
is an integral part of this report”<br />
www.pefindo.com<br />
2009 2010 2011 2012P 2013P<br />
Sales 340 423 465 532 600<br />
COGS (162) (194) (203) (232) (260)<br />
Gross Profit 178 230 262 300 339<br />
Operating Expense (134) (182) (209) (238) (269)<br />
Operating Profit 44 48 53 62 70<br />
Other Income (Charges) 5 (0.3) (3) (2) (3)<br />
Pre-tax Profit 49 47 50 60 67<br />
Tax (14) (13) (14) (14) (17)<br />
Net Profit 35 34 36 46 50<br />
Source: <strong>PT</strong> <strong>Multi</strong> <strong>Indocitra</strong> <strong>Tbk</strong>., Pefindo Equity and Index Valuation Division Estimates<br />
Table 6: Balance Sheet<br />
Balance Sheet<br />
(in Rp billion)<br />
Assets<br />
Current Assets<br />
2009 2010 2011 2012P 2013P<br />
Cash & cash equivalents 59 44 36 49 29<br />
Receivables 57 97 105 120 128<br />
Inventory 58 71 81 93 104<br />
Other Assets 62 17 18 20 17<br />
Total Current Assets 236 229 240 282 278<br />
Fixed Assets 41 112 163 196 239<br />
Other Assets 14 31 30 34 34<br />
Total Assets 291 372 433 512 551<br />
Liabilities<br />
Trade liabilities 14 9 19 22 24<br />
Short-term liabilities 4 30 34 54 62<br />
Other Short-term<br />
liabilities<br />
15 29 36 47 55<br />
Long-term liabilities 6 18 38 50 56<br />
Total Liabilities 39 86 127 173 197<br />
Total Equity 252 286 306 339 354<br />
Source: <strong>PT</strong> <strong>Multi</strong> <strong>Indocitra</strong> <strong>Tbk</strong>., Pefindo Equity and Index Valuation Division Estimates<br />
Figure 8: Historical P/E and P/BV<br />
<strong>Multi</strong> <strong>Indocitra</strong>, <strong>Tbk</strong><br />
October 18 th , 2012 Page 10 of 11<br />
08<br />
07<br />
06<br />
05<br />
04<br />
03<br />
02<br />
01<br />
00<br />
2009 2010 2011<br />
Figure 9: Historical ROA, ROE and TAT<br />
16<br />
14<br />
12<br />
10<br />
08<br />
06<br />
04<br />
02<br />
00<br />
2009 2010 2011<br />
Table 7: Key Ratio<br />
01<br />
01<br />
01<br />
01<br />
01<br />
00<br />
00<br />
00<br />
00<br />
00<br />
01<br />
01<br />
01<br />
01<br />
01<br />
01<br />
01<br />
01<br />
P/E<br />
P/BV<br />
Ratio 2009 2010 2011 2012P 2013P<br />
Growth (%)<br />
ROA<br />
Sales 10.6 24.3 9.9 14.4 12.6<br />
Operating Profit 4.3 7.4 12.0 16.9 12.6<br />
EBITDA 0.7 8.0 9.7 6.4 14.9<br />
Net Profit 16.6 (2.8) 7.5 25.5 9.4<br />
Profitability (%)<br />
Gross Margin 52.3 54.2 56.3 56.4 56.6<br />
Operating Margin<br />
ROE<br />
TAT<br />
13.0 11.3 11.5 11.7 11.7<br />
EBITDA Margin 16.2 14.1 14.0 13.0 13.3<br />
Net Margin 10.2 8.0 7.8 8.6 8.3<br />
ROA 12.0 9.1 8.4 8.9 9.1<br />
ROE 13.8 11.8 11.9 13.5 14.1<br />
Solvability (X)<br />
Debt to Equity 0.2 0.3 0.4 0.5 0.6<br />
Debt to Asset 0.1 0.2 0.3 0.3 0.4<br />
Liquidity (X)<br />
Current Ratio 7.2 3.4 2.7 2.3 2.0<br />
Quick Ratio 3.7 2.1 1.6 1.4 1.1<br />
Source: <strong>PT</strong> <strong>Multi</strong> <strong>Indocitra</strong> <strong>Tbk</strong>., Pefindo Equity and Index Valuation Division Estimates
“Disclaimer statement in the last page<br />
is an integral part of this report”<br />
www.pefindo.com<br />
DISCLAIMER<br />
<strong>Multi</strong> <strong>Indocitra</strong>, <strong>Tbk</strong><br />
This report was prepared based on the trusted and reliable sources. Nevertheless, we do not<br />
guarantee its completeness, accuracy and adequacy. Therefore we do not responsible of any<br />
investment decision making based on this report. As for any assumptions, opinions and<br />
predictions were solely our internal judgments as per reporting date, and those judgments are<br />
subject to change without further notice.<br />
We do not responsible for mistake and negligence occurred by using this report. Last<br />
performance could not always be used as reference for future outcome. This report is not an<br />
offering recommendation, purchase or holds particular shares. This report might not be suitable<br />
for some investors. All opinion in this report has been presented fairly as per issuing date with<br />
good intentions; however it could be change at any time without further notice. The price, value<br />
or income from each share of the Company stated in this report might lower than the investor<br />
expectation and investor might obtain lower return than the invested amount. Investment is<br />
defined as the probable income that will be received in the future; nonetheless such return may<br />
possibly fluctuate. As for the Company which its share is denominated other than Rupiah, the<br />
foreign exchange fluctuation may reduce the value, price or investor investment return. This<br />
report does not contain any information for tax consideration in investment decision making.<br />
The share price target in this report is a fundamental value, not a fair market value nor a<br />
transaction price reference required by the regulations.<br />
The share price target issued by Pefindo Equity & Index Valuation Division is not a<br />
recommendation to buy, sell or hold particular shares and it could not be considered as an<br />
investment advice from Pefindo Equity & Index Valuation Division as its scope of service to, or<br />
in relation to some parties, including listed companies, financial advisor, broker, investment<br />
bank, financial institution and intermediary, in correlation with receiving rewards or any other<br />
benefits from that parties.<br />
This report is not intended for particular investor and cannot be used as part of investment<br />
objective on particular shares and neither an investment recommendation on particular shares<br />
or an investment strategy. We strongly recommended investor to consider the suitable situation<br />
and condition at first before making decision in relation with the figure in this report. If it is<br />
necessary, kindly contact your financial advisor.<br />
<strong>PEFINDO</strong> keeps the activities of Equity Valuation separate from Ratings to preserve<br />
independence and objectivity of its analytical processes and products. <strong>PEFINDO</strong> has established<br />
policies and procedures to maintain the confidentiality of certain no n-public information<br />
received in connection with each analytical process. The entire process, methodology and the<br />
database used in the preparation of the Reference Share Price Target Report as a whole is<br />
different from the processes, methodologies and databases used <strong>PEFINDO</strong> in doing the rating.<br />
This report was prepared and composed by Pefindo Equity & Index Valuation Division with the<br />
objective to enhance shares price transparency of listed companies in Indonesia Stock Exchange (IDX).<br />
This report is also free of other party’s influence, pressure or force either from IDX or the listed company<br />
which reviewed by Pefindo Equity & Index Valuation Division. Pefindo Equity & Index Valuation<br />
Division will earn reward amounting to Rp 20 mn each from IDX and the reviewed company for issuing<br />
report twice per year. For further information, please visit our website at http://www.pefindo.com<br />
This report is prepared and composed by Pefindo Equity & Index Valuation Division. In<br />
Indonesia, this report is published in our website and in IDX website .<br />
October 18 th , 2012 Page 11 of 11