
You also want an ePaper? Increase the reach of your titles
YUMPU automatically turns print PDFs into web optimized ePapers that Google loves.
Table 5: Income Statement<br />
Income Statement<br />
(in Rp billion)<br />
“Disclaimer statement in the last page<br />
is an integral part of this report”<br />
www.pefindo.com<br />
2009 2010 2011 2012P 2013P<br />
Sales 340 423 465 532 600<br />
COGS (162) (194) (203) (232) (260)<br />
Gross Profit 178 230 262 300 339<br />
Operating Expense (134) (182) (209) (238) (269)<br />
Operating Profit 44 48 53 62 70<br />
Other Income (Charges) 5 (0.3) (3) (2) (3)<br />
Pre-tax Profit 49 47 50 60 67<br />
Tax (14) (13) (14) (14) (17)<br />
Net Profit 35 34 36 46 50<br />
Source: <strong>PT</strong> <strong>Multi</strong> <strong>Indocitra</strong> <strong>Tbk</strong>., Pefindo Equity and Index Valuation Division Estimates<br />
Table 6: Balance Sheet<br />
Balance Sheet<br />
(in Rp billion)<br />
Assets<br />
Current Assets<br />
2009 2010 2011 2012P 2013P<br />
Cash & cash equivalents 59 44 36 49 29<br />
Receivables 57 97 105 120 128<br />
Inventory 58 71 81 93 104<br />
Other Assets 62 17 18 20 17<br />
Total Current Assets 236 229 240 282 278<br />
Fixed Assets 41 112 163 196 239<br />
Other Assets 14 31 30 34 34<br />
Total Assets 291 372 433 512 551<br />
Liabilities<br />
Trade liabilities 14 9 19 22 24<br />
Short-term liabilities 4 30 34 54 62<br />
Other Short-term<br />
liabilities<br />
15 29 36 47 55<br />
Long-term liabilities 6 18 38 50 56<br />
Total Liabilities 39 86 127 173 197<br />
Total Equity 252 286 306 339 354<br />
Source: <strong>PT</strong> <strong>Multi</strong> <strong>Indocitra</strong> <strong>Tbk</strong>., Pefindo Equity and Index Valuation Division Estimates<br />
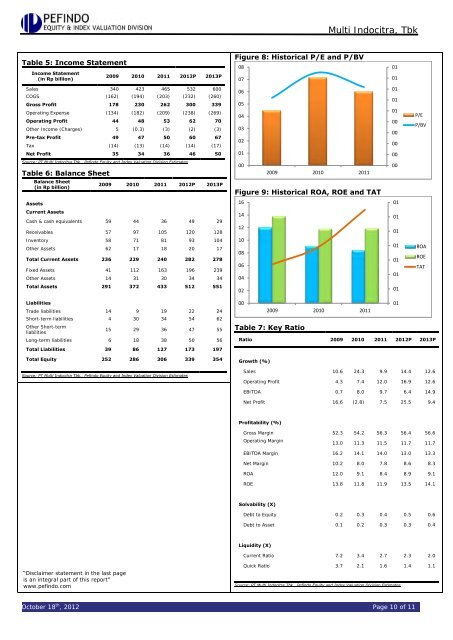
Figure 8: Historical P/E and P/BV<br />
<strong>Multi</strong> <strong>Indocitra</strong>, <strong>Tbk</strong><br />
October 18 th , 2012 Page 10 of 11<br />
08<br />
07<br />
06<br />
05<br />
04<br />
03<br />
02<br />
01<br />
00<br />
2009 2010 2011<br />
Figure 9: Historical ROA, ROE and TAT<br />
16<br />
14<br />
12<br />
10<br />
08<br />
06<br />
04<br />
02<br />
00<br />
2009 2010 2011<br />
Table 7: Key Ratio<br />
01<br />
01<br />
01<br />
01<br />
01<br />
00<br />
00<br />
00<br />
00<br />
00<br />
01<br />
01<br />
01<br />
01<br />
01<br />
01<br />
01<br />
01<br />
P/E<br />
P/BV<br />
Ratio 2009 2010 2011 2012P 2013P<br />
Growth (%)<br />
ROA<br />
Sales 10.6 24.3 9.9 14.4 12.6<br />
Operating Profit 4.3 7.4 12.0 16.9 12.6<br />
EBITDA 0.7 8.0 9.7 6.4 14.9<br />
Net Profit 16.6 (2.8) 7.5 25.5 9.4<br />
Profitability (%)<br />
Gross Margin 52.3 54.2 56.3 56.4 56.6<br />
Operating Margin<br />
ROE<br />
TAT<br />
13.0 11.3 11.5 11.7 11.7<br />
EBITDA Margin 16.2 14.1 14.0 13.0 13.3<br />
Net Margin 10.2 8.0 7.8 8.6 8.3<br />
ROA 12.0 9.1 8.4 8.9 9.1<br />
ROE 13.8 11.8 11.9 13.5 14.1<br />
Solvability (X)<br />
Debt to Equity 0.2 0.3 0.4 0.5 0.6<br />
Debt to Asset 0.1 0.2 0.3 0.3 0.4<br />
Liquidity (X)<br />
Current Ratio 7.2 3.4 2.7 2.3 2.0<br />
Quick Ratio 3.7 2.1 1.6 1.4 1.1<br />
Source: <strong>PT</strong> <strong>Multi</strong> <strong>Indocitra</strong> <strong>Tbk</strong>., Pefindo Equity and Index Valuation Division Estimates