Reno De Medici - Cascades
Reno De Medici - Cascades
Reno De Medici - Cascades
You also want an ePaper? Increase the reach of your titles
YUMPU automatically turns print PDFs into web optimized ePapers that Google loves.
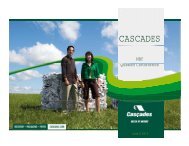
CASCADES<br />
Scotia Capital High Yield<br />
Conference<br />
November 30, 2011
DISCLAIMER<br />
Certain statements in this presentation, including statements regarding future results and performance, are<br />
forward-looking statements within the meaning of securities legislation based on current expectations. The<br />
accuracy of such statements is subject to a number of risks, uncertainties and assumptions that may cause<br />
actual results to differ materially from those projected, including, but not limited to, the effect of general economic<br />
conditions, decreases in demand for the Company’s products, the prices and availability of raw materials,<br />
changes in the relative values of certain currencies, fluctuations in selling prices and adverse changes in general<br />
market and industry conditions. This presentation also includes price indices as well as variance and sensitivity<br />
analyses that are intended to provide the reader with a better understanding of the trends related to our business<br />
activities. These items are based on the best estimates available to the Company.<br />
The financial information included in this presentation also contains certain data that are not measures of<br />
performance under Canadian GAAP or IFRS (“non-GAAP or non-IFRS measures”). For example, the Company<br />
uses earnings before interest, taxes, depreciation and amortization (EBITDA) because it is the measure used by<br />
management to assess the operating and financial performance of the Company’s operating segments. Such<br />
information is reconciled to the most directly comparable financial measures, as set forth in the “Supplemental<br />
Information on Non-GAAP or Non-IFRS Measures” section of our most recent annual report or earnings press<br />
release.<br />
Specific items are defined as items such as charges for impairment of assets, for facility or machine closures,<br />
debt restructuring charges, gains or losses on sales of business units, unrealized gains or losses on derivative<br />
financial instruments that do not qualify for hedge accounting, foreign exchange gains or losses on long-term<br />
debt and other significant items of an unusual or non-recurring nature.<br />
All amounts in this presentation are in Canadian dollars unless otherwise indicated.<br />
2
GREEN PACKAGING AND TISSUE PRODUCT<br />
OFFERING<br />
Boxboard Containerboard Specialty products Tissue papers<br />
Exposure to less cyclical / stable / growing end-markets through “green” products<br />
3
UPSTREAM AND DOWNSTREAM INTEGRATION<br />
May be sent to<br />
recycling centers<br />
100+ business units<br />
23 units<br />
57 units<br />
Closed-loop business model that offers a variety of green products<br />
Including the 6 manufacturing/converting tissue papers units and <strong>Reno</strong> <strong>De</strong> <strong>Medici</strong>’s units.<br />
31 units<br />
•75% recycled fibre (3.2M tons)<br />
•North American integration rate<br />
(2010): 35% (700K tons)<br />
•North American integration<br />
rate (2010): 47%<br />
4
($ in millions)<br />
BALANCED PACKAGING AND TISSUE EXPOSURE<br />
Boxboard<br />
30% of Sales<br />
23% EBITDA<br />
Packaging<br />
78% of Sales<br />
76% EBITDA<br />
<strong>Cascades</strong><br />
LTM Q3 2011 Sales: $3,739<br />
LTM Q3 2011 EBITDA: $281<br />
Containerboard<br />
26% of Sales<br />
37% EBITDA<br />
Tissue Papers<br />
22% of Sales<br />
24% EBITDA<br />
Specialty Products<br />
22% of Sales<br />
16% EBITDA<br />
Leading North American packaging and tissue manufacturer with substantial recycling<br />
capabilities<br />
EBITDA excluding specific items, including discontinued operations. Breakdown of sales and EBITDA before eliminations & corporate activities.<br />
5
• 35% equity investment<br />
• Market Value: +/- $90M<br />
Boralex‟s forecast installed production capacity<br />
(MW)<br />
1 000<br />
800<br />
600<br />
400<br />
EQUITY INVESTMENTS<br />
500<br />
710<br />
• 43% equity investment<br />
• Market value: +/- $40M<br />
<strong>Reno</strong> <strong>De</strong> <strong>Medici</strong>‟s EBITDA<br />
Strong growth & turnaround stories currently worth +/- $130M<br />
Boralex`s production capacity proforma for the Seigneurie de Beaupré project.<br />
905<br />
2010 2012 2014<br />
(euro)<br />
50<br />
40<br />
30<br />
20<br />
31<br />
40<br />
37<br />
2009 2010 LTM Q3 2011<br />
6
(M CAN$)<br />
1100<br />
1000<br />
900<br />
800<br />
700<br />
600<br />
500<br />
759<br />
YTD 2011 FINANCIAL PERFORMANCE<br />
808<br />
832<br />
SALES<br />
783 774<br />
Improving results following a challenging first half of the year<br />
Full consolidation of <strong>Reno</strong> <strong>De</strong> <strong>Medici</strong> since Q2 2011. Sales excluding discontinued operations. EBITDA excluding specific items.<br />
991<br />
947<br />
Q1 2010 Q2 2010 Q3 2010 Q4 2010 Q1 2011 Q2 2011 Q3 2011<br />
(M CAN$)<br />
100<br />
80<br />
60<br />
40<br />
20<br />
0<br />
59<br />
85<br />
94<br />
EBITDA<br />
72<br />
Q1 2010 Q2 2010 Q3 2010 Q4 2010 Q1 2011 Q2 2011 Q3 2011<br />
37<br />
62<br />
79<br />
7
8%<br />
6%<br />
4%<br />
2%<br />
0%<br />
-2%<br />
-4%<br />
-6%<br />
RELATIVELY STABLE DEMAND & BALANCED<br />
MARKETS<br />
Year-to-date 2011 demand change<br />
Jan 11 Feb 11 Mar 11 Apr 11 May 11 June 11 July 11 Aug 11 Sept 11<br />
European coated boxboard industry shipments<br />
Canadian corrugated box industry shipments<br />
U.S. coated recycled boxboard industry production<br />
U.S. industry converted tissue product shipments<br />
Sources: RISI, CEPI Cartonboard, Paper Packaging Canada.<br />
100%<br />
Year-to-date 2011 industry operating rates<br />
<strong>Cascades</strong>‟ demand has been relatively healthy so far in 2011<br />
98%<br />
96%<br />
94%<br />
92%<br />
90%<br />
Jan 11 Feb 11 Mar 11 Apr 11 May 11 June<br />
11<br />
U.S. containerboard industry<br />
U.S. coated recycled boxboard industry<br />
U.S. tissue industry<br />
July 11 Aug 11 Sept<br />
11<br />
8
120<br />
110<br />
100<br />
90<br />
80<br />
70<br />
104<br />
100<br />
Source: Bloomberg.<br />
YTD 2011 INPUT COST INFLATION<br />
North American selling price/raw material cost spread<br />
(manufacturing)<br />
117<br />
114<br />
(17)%<br />
99<br />
97<br />
Q1 10 Q2 10 Q3 10 Q4 10 Q1 11 Q2 11 Q3 11<br />
Spread in US$/s.t. Spread in Can$/s.t.<br />
(US$/<br />
bushel)<br />
8<br />
Main drivers for <strong>Cascades</strong>' chemical input costs<br />
+90%<br />
YTD 2011 financial results impacted by signification variable cost inflation<br />
7<br />
6<br />
5<br />
4<br />
3<br />
Jan<br />
10<br />
Mar<br />
10<br />
May<br />
10<br />
3.41<br />
July Sept Nov Jan Mar May July<br />
10 10 10 11 11 11 11<br />
Corn (left axis) Oil (right axis)<br />
Sept<br />
11<br />
(US$/<br />
barrel)<br />
120<br />
6.47<br />
93<br />
9<br />
110<br />
100<br />
90<br />
80<br />
70<br />
60
(M CAN$)<br />
1,600<br />
1,500<br />
1,400<br />
1,300<br />
1,200<br />
YTD 2011 DEBT REDUCTION<br />
1,454<br />
1,508<br />
1,462<br />
NET DEBT<br />
1,397<br />
1,445<br />
1,288<br />
Net debt down 10% since Q2 2010 through the sale of Dopaco<br />
1,360<br />
Q1 2010 Q2 2010 Q3 2010 Q4 2010 Q1 2011 Q2 2011 Q3 2011<br />
Including net debt of <strong>Reno</strong> <strong>De</strong> <strong>Medici</strong> since Q2 2011 ($148M as of September 30, 2011).<br />
10
Q1 Q2 Q3<br />
Sale of<br />
Avot-Vallée mill<br />
YTD 2011 STRATEGIC HIGHLIGHTS<br />
Sale of Dopaco<br />
($400M)<br />
Increased<br />
ownership in<br />
<strong>Reno</strong> de <strong>Medici</strong><br />
Consolidation of<br />
N. England<br />
operations<br />
(closure of<br />
Leominster plant)<br />
Sale of<br />
Versailles &<br />
Hebron facilities;<br />
•Construction kick-off of the new, state-of-art, Greenpac containerboard mill.<br />
•Acquisition of the remaining 50% of Papersource shares, a leading tissue paper converter<br />
(effective November 2011).<br />
Greenpac<br />
announcement<br />
•Closure of Burnaby (BC) containerboard and divestiture of land and building mill for $20 million<br />
(effective October 2011).<br />
•Closure of Le Gardeur (QC) sheet plant (will be effective in Q4 2011).<br />
Challenging Market Evolution = Proactive measures = Improve profitability<br />
11
1,740<br />
1,720<br />
1,700<br />
1,680<br />
1,660<br />
1,640<br />
1,620<br />
1,600<br />
Source: RISI.<br />
STABLE/UPWARD PRICING MOMENTUM<br />
<strong>Cascades</strong> tissue papers price index (1999=1,000)<br />
1,617<br />
1,718<br />
Q1 10 Q2 10 Q3 10 Q4 10 Q1 11 Q2 11 Q3 11<br />
Packaging average market selling prices<br />
Pricing environment remains favorable and should positively impact Q4 2011 results<br />
950<br />
850<br />
750<br />
650<br />
550<br />
790<br />
976<br />
580<br />
Q1 10 Q2 10 Q3 10 Q4 10 Q1 11 Q2 11 Q3 11<br />
Recycled boxboard - 20pt. Clay coated news (transaction)<br />
Recycled white-lined chipboard (GD2) index<br />
Linerboard 42-lb. unbleached kraft, East US (transaction)<br />
Virgin coated duplex boxboard (GC2) index<br />
1,200<br />
920<br />
1,152<br />
716<br />
1,000<br />
640<br />
1,100<br />
,900 900<br />
12
(US$/s.t. or<br />
€/m.t. )<br />
300<br />
250<br />
200<br />
150<br />
100<br />
50<br />
0<br />
Sources: RISI, Bloomberg.<br />
RAW MATERIAL COSTS AND CURRENCY COMING<br />
DOWN<br />
MAIN RECYCLED FIBRE COSTS<br />
SOP (U.S.) OCC (U.S.)<br />
EBITDA sensitivity<br />
to 15$U.S. or €/s.t.<br />
change in recycled fibre costs = 52 M$<br />
296<br />
168<br />
Jan 07<br />
Apr 07<br />
July 07<br />
Oct 07<br />
Jan 08<br />
Apr 08<br />
July 08<br />
Oct 08<br />
Jan 09<br />
Apr 09<br />
July 09<br />
Oct 09<br />
Jan 10<br />
Apr 10<br />
July 10<br />
Oct 10<br />
Jan 11<br />
Apr 11<br />
July 11<br />
Oct 11<br />
150<br />
121<br />
1.10<br />
1.05<br />
1.00<br />
0.95<br />
0.90<br />
0.85<br />
0.80<br />
0.75<br />
Headwinds are subsiding.<br />
US$/CAN$<br />
EBITDA sensitivity<br />
to 10 CAN¢ change = 50 M$+<br />
1.05<br />
Current value<br />
0.95<br />
Jan 07<br />
Apr 07<br />
July 07<br />
Oct 07<br />
Jan 08<br />
Apr 08<br />
July 08<br />
Oct 08<br />
Jan 09<br />
Apr 09<br />
July 09<br />
Oct 09<br />
Jan 10<br />
Apr 10<br />
July 10<br />
Oct 10<br />
Jan 11<br />
Apr 11<br />
July 11<br />
Oct 11<br />
13
STRATEGIC PRIORITIES CASCADES<br />
Restructuring of<br />
under-performing units<br />
EBITDA excluding specific items.<br />
1<br />
Focused investing for<br />
modernization<br />
of core operations (and IT)<br />
2<br />
ROCE: objective = WACC<br />
Net debt/EBITDA: objective = 3x<br />
Optimizing capital allocation<br />
between sectors & investments,<br />
reducing working capital<br />
<strong>Cascades</strong>‟ 3 pillar strategy: Restructuration, Modernization, Optimization.<br />
3<br />
SHORT/MID-TERM<br />
MID-TERM<br />
14
• Strong Partnership<br />
– Norampac (<strong>Cascades</strong>) 59.7%<br />
– Caisse de dépôt et placement<br />
du Québec 20.2%<br />
– Two industry converters 20.1%<br />
• Financial flexibility not affected<br />
– $99M total investment ($84M in equity,<br />
$15M in bridge loan)<br />
– Only $50M increase in total debt 1<br />
– <strong>De</strong>bt non-recourse to <strong>Cascades</strong><br />
• Competitive advantage – Recycled liner<br />
– Largest in N. America (540,000 s.t.<br />
capacity)<br />
– Most technologically advanced equipment<br />
– Well-aligned with current market trends<br />
Through Greenpac, Norampac positions itself amongst sector leaders in terms of product offering,<br />
productivity and profitability; <strong>Cascades</strong> maintains its financial flexibility.<br />
1 Compared to June 30, 2011.<br />
TOWARDS MODERNIZATION : GREENPAC<br />
15
TOWARDS MODERNIZATION : ATMOS &<br />
PAPERSOURCE<br />
• “TAD equivalent technology”<br />
• Full machine rebuilt<br />
• $30M investment<br />
– First North American machine<br />
• High-end tissue paper offering<br />
• Up to 100% recycled fibre tissue paper<br />
• Lower energy costs<br />
ATMOS (Voith) PAPERSOURCE<br />
• Aquisition of the remaining 50% shares for $60M<br />
(+28M in debt to be assumed)<br />
• Increased tissue group integration level to 70%<br />
• Reinforces positionning in the away-from-home sector<br />
• One of the most modern converting plants in North<br />
America<br />
• 10 converting lines<br />
Improved product offering and optimized operations<br />
16
• 2010<br />
• 2011<br />
ERP IMPLEMENTATION & W/C REDUCTION<br />
ERP W/C Reduction<br />
– <strong>De</strong>tailed analysis of its requirement<br />
– Pilot project launch<br />
– $10M investment<br />
– <strong>De</strong>tailed blueprint manufacturing operations<br />
– Implementation in one of our tissue mills<br />
– $20M investment<br />
• 2012-2014<br />
– <strong>De</strong>tailed blueprint converting<br />
– Full implementation<br />
– $20M investment<br />
18.0%<br />
16.0%<br />
14.0%<br />
12.0%<br />
10.0%<br />
16.5%<br />
Working capital (% of sales)<br />
14.2%<br />
13.6%<br />
15.0%<br />
2 key strategic initiatives to improve efficiency, flexibility and competiveness<br />
12.0%<br />
2008 2009 2010 Q3 2011 T+2<br />
17
(M $)<br />
140<br />
130<br />
120<br />
110<br />
100<br />
90<br />
80<br />
70<br />
60<br />
50<br />
40<br />
Q1 2007<br />
86<br />
Q2 2007<br />
87<br />
CONCLUSION<br />
95<br />
82<br />
59<br />
EBITDA excluding specific items. CAN GAAP.<br />
Q3 2007<br />
Q4 2007<br />
Q1 2008<br />
EBITDA<br />
Q2 2008<br />
63<br />
Q3 2008<br />
88<br />
Q4 2008<br />
96<br />
Q1 2009<br />
107<br />
Q2 2009<br />
121<br />
Q3 2009<br />
127<br />
Q4 2009<br />
110<br />
<strong>Cascades</strong> will:<br />
1. Improve financial flexibility through:<br />
• Proactive measures on under-performing<br />
assets;<br />
• Improved working capital management.<br />
2. Invest diligently in core businesses to<br />
optimize and modernize.<br />
Strong performance during the recent economic downturn<br />
and clear, committed and unified strategy.<br />
18
APPENDICES<br />
19
MARKET PRICES AND COSTS SUMMARY<br />
Q32011<br />
Q32011<br />
2009 2010 2011 Q32010<br />
Q22011<br />
These indices should only be used as indicators of trends and they Average Average Average Average Average Average Average Average Average Average<br />
might be different than our actual selling prices or purchasing<br />
Q1 Q2 Q3 Q4<br />
Q1 Q2 Q3<br />
costs.<br />
Selling prices<br />
(unit) (%) (unit) (%)<br />
<strong>Cascades</strong> North American US$ index (index 2005 = 1,000)<br />
PACKAGING<br />
Boxboard<br />
North America (US$/ton)<br />
1,109 1,106 1,180 1,223 1,234 1,186 1,238 1,250 1,264 1,251 41 3% 14 1%<br />
Recycled boxboard - 20pt. Clay coated news (transaction)<br />
Europe (Euro/tonne)<br />
754 790 825 843 855 828 880 917 920 906 77 9% 3 0%<br />
Recycled white-lined chipboard (GD2) index 592 580 631 656 690 639 690 716 716 707 60 9% 0 0%<br />
Virgin coated duplex boxboard (GC2) index<br />
Containerboard (US$/ton)<br />
985 976 1,025 1,063 1,155 1,055 1,155 1,151 1,152 1,153 89 8% 1 0%<br />
Linerboard 42-lb. unbleached kraft, East US (transaction) 547 580 640 640 640 625 640 640 640 640 0 0% 0 0%<br />
Corrugating medium 26-lb. Semichemical, East U.S. (transaction)<br />
Specialty products<br />
(US$/ton, tonne for deinked pulp)<br />
517 550 610 610 610 595 610 610 610 610 0 0% 0 0%<br />
Recycled boxboard - 20pt. Bending chip (transaction) 565 575 625 625 650 619 667 675 670 671 45 7% -5 -1%<br />
<strong>De</strong>inked pulp (f.o.b; U.S. air-dried & wet-lap, post-consumer) 601 708 752 755 755 743 748 768 812 776 57 8% 44 6%<br />
Unbleached kraft paper, Grocery bag 30-lb. 926 960 1,020 1,047 1,060 1,022 1,025 1,093 1,110 1,076 63 6% 17 2%<br />
Uncoated white 50-lb. offset, rolls<br />
TISSUE PAPERS<br />
855 868 917 938 933 914 930 955 947 944 9 1% -8 -1%<br />
<strong>Cascades</strong> Tissue papers (index 1999 = 1,000)<br />
Raw materials<br />
1,617 1,617 1,623 1,615 1,620 1,619 1,631 1,662 1,718 1,685 103 6% 56 3%<br />
<strong>Cascades</strong> North American US$ index (index 2005 = 300)<br />
RECYCLED PAPER<br />
North America (US$/ton)<br />
258 426 409 397 452 421 470 492 512 491 115 29% 20 4%<br />
Corrugated containers, no. 11 (New England) 68 149 146 131 170 149 182 178 179 180 48 37% 1 1%<br />
Special news, no. 8 (ONP - Chicago & NY average) 56 90 92 78 95 88 128 139 135 134 57 73% -4 -3%<br />
Sorted office papers, no. 37 (SOP - Chicago & NY average)<br />
Europe (Euro/tonne)<br />
120 225 198 218 216 214 223 263 283 256 65 30% 20 8%<br />
Recovered paper index<br />
VIRGIN PULP (US$/tonne)<br />
53 100 120 126 132 120 146 158 147 151 21 17% -11 -7%<br />
Bleached softwood kraft Northern, East U.S. 718 880 993 1 000 967 960 970 1 027 993 997 -7 -1% -34 -3%<br />
Bleached hardwood kraft Northern mixed, East U.S. 609 776 908 900 840 856 820 850 823 831 -77 -9% -27 -3%<br />
WOODCHIPS – Conifer eastern Canada (US$/odmt) 121 125 121 120 124 123 123 125 125 124 5 4% 0 0%<br />
Sources: RISI, Dow Jones, Random Lengths and <strong>Cascades</strong>.<br />
Change<br />
20
SENSITIVITY TABLE<br />
SELLING PRICES (MANUFACTURING)<br />
Boxboard<br />
Containerboard<br />
Specialty Products (paper only)<br />
Tissue<br />
RAW MATERIAL COSTS<br />
Recycled papers<br />
Brown grades (OCC & others)<br />
Groundwood grades (ONP & others)<br />
White grades (SOP & others)<br />
Commercial pulp<br />
Natural gas<br />
FOREIGN EXCHANGE<br />
Change of US$ 0.01 vs CAN$<br />
CAPACITY / CONSUMPTION<br />
(„000 s.t. and „000 mmBtu<br />
for natural gas)<br />
1,393<br />
1,026<br />
475<br />
511<br />
1,895<br />
359<br />
908<br />
272<br />
13,303<br />
Sensitivity table adjusted for all recent initiatives (transactions, closure) with the exception of the Burnaby mill and Le Gardeur plant.<br />
CHANGE EBITDA IMPACT<br />
25 US$ or € / ton<br />
25 US$ / ton<br />
25 US$ / ton<br />
25 US$ / ton<br />
15 US$ or € / ton<br />
15 US$ or € / ton<br />
15 US$ or € / ton<br />
30 US$ or € / ton<br />
1.00 US$ or € / mmBtu<br />
(In million of CAN$)<br />
44<br />
26<br />
12<br />
13<br />
(32)<br />
(6)<br />
(14)<br />
(9)<br />
(15)<br />
(5)<br />
21
Boxboard N.<br />
America<br />
Boxboard<br />
Europe<br />
Specialty<br />
products<br />
Tissue papers<br />
POTENTIAL MARKET CHANGE SENSITIVITY<br />
Segment Announced eff.<br />
date<br />
Announced Increase<br />
Recycled board April/May 40 US$/s.t.<br />
Recycled board April 30 €/m.t.<br />
Consumer prod.<br />
pack.<br />
March-June 4 to 8%<br />
Kraft papers April/Sept 50 US$/s.t.<br />
<strong>De</strong>inked pulp May/June 5%<br />
Uncoated b. June 30 US$/s.t.<br />
Parent rolls March/April 50 US$/s.t.<br />
AfH Canada May Up to 6%<br />
AfH U.S. June Up to 9%<br />
Retail Canada July/August 6.5%<br />
Retail U.S. August Up to 7.5%<br />
Total potential EBITDA<br />
annual change = approx. 70 M$<br />
22
RENEWAL OF CREDIT AGREEMENT<br />
Structure $750 M revolving credit facility<br />
Before After (February 2011)<br />
$100 M term loan<br />
Maturity Credit facility: <strong>De</strong>cember 2011<br />
Term loan: February 2012<br />
Interest rate Credit facility: LIBOR + 275 bps<br />
Term loan: LIBOR + 287.5 bps<br />
$750 M revolving credit facility<br />
February 2015<br />
LIBOR + 212.5 bps<br />
Standby fees 70 bps 22.5% x (spread over LIBOR) = 48 bps<br />
Covenants Funded <strong>De</strong>bt to Capitalization Ratio ≤ 65%<br />
Interest Coverage Ratio ≥ 2.25x<br />
Funded <strong>De</strong>bt to Capitalization Ratio ≤ 65%<br />
Interest Coverage Ratio ≥ 2.25x<br />
Addressing upcoming maturities while reducing costs of borrowing and improving flexibility.<br />
23
DEBT SCHEDULE<br />
(M CAN$)<br />
600<br />
500<br />
400<br />
300<br />
200<br />
100<br />
0<br />
Long-term debt repayment schedule (Sept. 30, 2011)<br />
Senior unsecured<br />
notes (US$ 18M)<br />
6.75% / 7.25%<br />
7.75%<br />
L + 212.5 bps<br />
Revolver<br />
(CAN$ 750M)<br />
7.75%<br />
Senior unsecured<br />
notes (CAN$ 200M)<br />
Senior unsecured<br />
notes (US$ 500M)<br />
Senior unsecured notes<br />
(US$ 250M)<br />
With refinancing of revolver, all short term maturities are now addressed.<br />
7.875%<br />
2011 2012 2013 2014 2015 2016 2017 2018 2019 2020<br />
24
HEDGING PORTFOLIO Q4 2011-2012<br />
1. Cash flow USD:<br />
• Q4 2011: 31 to 36% (with options) of exposure hedged at an average rate of 1.124<br />
CAN$/US$ to 1.135 CAN$/US$<br />
• 2012: 29 to 44% (with options) of exposure hedged at an average rate of 1.032<br />
CAN$/US$ to 1.070 CAN$/US$<br />
2. Natural gas:<br />
• Canada:<br />
• Q4 2011: 70% at 6.13 CAN$/GJ<br />
• 2012: 65% at 6.05 CAN$/GJ<br />
• U.S.:<br />
• Q4 2011: 63% at 6.47 US$/mmBtu<br />
• 2012: 57% at 6.44 US$/mmBtu<br />
25
RENO DE MEDICI: FULL CONSOLIDATION SINCE Q2<br />
<strong>Reno</strong> <strong>De</strong> <strong>Medici</strong> (RdM)<br />
1. <strong>Cascades</strong> owned 42.2% of outstanding shares at the end of Q3 2011<br />
2. <strong>Cascades</strong> can acquire up to 5% per year on the open market<br />
3. <strong>Cascades</strong> has the option to acquire 9.07% from one shareholder « Industria Innovatione»<br />
• <strong>Cascades</strong> has a call option to buy for €0.43 per share until <strong>De</strong>c. 31, 2012<br />
• Industria has a put option to sell for €0.41 per share from Jan 2013 to March 31, 2014<br />
• Total potential investment of €14-15 M<br />
4. Put / Call option for <strong>Cascades</strong> virgin assets in effect<br />
• 2011 is reference year<br />
• Paid in cash or in additional shares of RdM<br />
• May represent 10%-20% of outstanding shares of RdM (depending on acquisition structure)<br />
Due to the option in place (9.07%) and the size of its ownership, <strong>Cascades</strong> began to fully<br />
consolidate RdM‟s results in its financial statements in Q2 2011<br />
26
NORTH AMERICAN COATED BOXBOARD<br />
North American capacity share CRB<br />
W. Pigeon;<br />
Strathcona; 3%<br />
4%<br />
Fusion<br />
Paperboard;<br />
6%<br />
<strong>Cascades</strong>;<br />
10%<br />
PaperWorks;<br />
13%<br />
Source: CEPI Cartonboard, company filings, <strong>Cascades</strong>.<br />
Caraustar;<br />
2% Newark;<br />
2%<br />
Graphic<br />
Packaging;<br />
35%<br />
Rock-Tenn;<br />
25%<br />
North American capacity share coated boxboard<br />
<strong>Cascades</strong>;<br />
3%<br />
PaperWorks<br />
; 4%<br />
Clearwater;<br />
6%<br />
RockTenn;<br />
10%<br />
G-P; 3%<br />
IP; 15%<br />
Others; 6%<br />
Graphic<br />
Packaging;<br />
30%<br />
Meadwest;<br />
23%<br />
27
Mayr-Melnhof;<br />
30%<br />
EUROPEAN COATED BOXBOARD<br />
European capacity WLC Share<br />
<strong>Reno</strong> <strong>De</strong><br />
<strong>Medici</strong>; 21%<br />
Smurfit Kappa;<br />
6%<br />
Source: CEPI Cartonboard, company filings, <strong>Cascades</strong>.<br />
Others; 33%<br />
Knauf; 5%<br />
Weig; 5%<br />
Others; 31%<br />
Holmen; 4%<br />
<strong>Cascades</strong>; 9%<br />
Holmen; 10%<br />
European capacity FBB+WLC share<br />
Smurfit Kappa;<br />
3%<br />
M-real; 11%<br />
Stora Enso;<br />
12%<br />
European capacity FBB share<br />
Others; 9%<br />
IP; 8%<br />
Mayr-Melnhof;<br />
23%<br />
<strong>Reno</strong> de<br />
<strong>Medici</strong><br />
<strong>Cascades</strong>;<br />
17%<br />
Mayr-Melnhof;<br />
10%<br />
M-real; 30%<br />
Stora Enso;<br />
24%<br />
28
Pratt; 3%<br />
NORTH AMERICAN CONTAINERBOARD<br />
North American capacity share containerboard<br />
Longview; 2%<br />
Boise; 2%<br />
KapStone<br />
(with US<br />
Corr.); 3%<br />
Norampac;<br />
3%<br />
PCA; 6%<br />
Green Bay<br />
Pack.; 2% Others; 12%<br />
GP; 11%<br />
IP (with TIN);<br />
36%<br />
Rock Tenn<br />
(with SSCC);<br />
20%<br />
Canadian capacity breakdown containerboard<br />
Minas Basin<br />
Pulp & Power;<br />
5%<br />
Kruger; 9%<br />
Lake Utopia<br />
Paper; 10%<br />
Atlantic; 11%<br />
New Forest<br />
Paper Mills ;<br />
13%<br />
Norampac;<br />
26%<br />
Smurfit/<br />
RockTenn; 26%<br />
29
TISSUE AWAY-FROM-HOME<br />
Papersource;<br />
4%<br />
SCA; 7%<br />
Wausau; 7%<br />
GP; 6%<br />
Other; 2%<br />
Kruger; 29%<br />
Source: Company filings, <strong>Cascades</strong>.<br />
Canada<br />
<strong>Cascades</strong>;<br />
18%<br />
Other; 16,9%<br />
KC; 27%<br />
<strong>Cascades</strong>;<br />
Papersource; 4,4%<br />
2,7%<br />
Best diamond;<br />
0,5%<br />
Kruger; 2,7%<br />
GP; 27,8%<br />
North America<br />
Wausau; 6,5%<br />
Papersource;<br />
3%<br />
<strong>Cascades</strong>; 3%<br />
Best diamond;<br />
1%<br />
Other; 18%<br />
GP; 30%<br />
SCA; 17,9%<br />
KC; 20,6%<br />
USA<br />
Wausau; 6%<br />
SCA; 19%<br />
KC; 20%<br />
30
TISSUE RETAIL<br />
<strong>Cascades</strong>; 5%<br />
Private Label;<br />
28%<br />
Source: AC Nielsen.<br />
P&G; 11%<br />
KC; 4%<br />
Canada = 1.1b$<br />
Irving; 18%<br />
Kruger; 34%<br />
Other; 11%<br />
Private Label;<br />
25%<br />
North America = 12b$<br />
P&G; 24%<br />
Private Label;<br />
24%<br />
Other; 5%<br />
P&G; 26%<br />
GP; 22%<br />
KC; 18%<br />
USA = 11b$<br />
GP; 25%<br />
KC; 20%<br />
31
32<br />
For more information:<br />
www.cascades.com/investors<br />
Didier Filion<br />
Director, Investor Relations<br />
didier_filion@cascades.com<br />
514-282-2697<br />
CREDIT: IMAGE ECOterre<br />
32


