Deconstructing bathymetric body size patterns in deep-sea gastropods
Deconstructing bathymetric body size patterns in deep-sea gastropods
Deconstructing bathymetric body size patterns in deep-sea gastropods

You also want an ePaper? Increase the reach of your titles
YUMPU automatically turns print PDFs into web optimized ePapers that Google loves.
MARINE ECOLOGY PROGRESS SERIES<br />
Vol. 297: 181–187, 2005 Published August 1<br />
Mar Ecol Prog Ser<br />
<strong>Deconstruct<strong>in</strong>g</strong> <strong>bathymetric</strong> <strong>body</strong> <strong>size</strong> <strong>patterns</strong> <strong>in</strong><br />
<strong>deep</strong>-<strong>sea</strong> <strong>gastropods</strong><br />
INTRODUCTION<br />
No potentially adaptive property of <strong>deep</strong>-<strong>sea</strong> organisms<br />
has received more attention than <strong>body</strong> <strong>size</strong>. S<strong>in</strong>ce<br />
many physiological and life-history features scale with<br />
<strong>body</strong> <strong>size</strong> (Peters 1983, Brown 1995, Gillooly et al.<br />
2001, 2002, Savage et al. 2004), comparative studies of<br />
<strong>size</strong> may help reveal the connection between the biodiversity<br />
of communities and the evolved characteristics<br />
of their constituent species. S<strong>in</strong>ce Thiel (1975,<br />
1979) first demonstrated that the average <strong>size</strong> of organisms<br />
decreases with depth <strong>in</strong> the <strong>deep</strong> <strong>sea</strong>, a large<br />
literature on <strong>bathymetric</strong> <strong>patterns</strong> of <strong>body</strong> <strong>size</strong> has<br />
developed (reviewed <strong>in</strong> Rex & Etter 1998). Nearly all of<br />
*Email: mccla<strong>in</strong>c@unm.edu<br />
Craig R. McCla<strong>in</strong> 1, *, Michael A. Rex 2 , Randa Jabbour 3<br />
1 Biocomplexity Work<strong>in</strong>g Group, Biology Department, University of New Mexico, Albuquerque, New Mexico 87131, USA<br />
2 Biology Department, University of Massachusetts Boston, Boston, Massachusetts 02125, USA<br />
3 Intercollege Graduate Degree Program <strong>in</strong> Ecology, Pennsylvania State University, University Park, Pennsylvania 16802, USA<br />
ABSTRACT: Attempts to understand <strong>body</strong> <strong>size</strong> as an adaptation to the <strong>deep</strong> <strong>sea</strong> have relied primarily<br />
on measur<strong>in</strong>g and <strong>in</strong>terpret<strong>in</strong>g <strong>size</strong>-depth relationships. The numerous studies document<strong>in</strong>g<br />
<strong>bathymetric</strong> <strong>size</strong> trends dur<strong>in</strong>g the last 30 yr report widely divergent results. Body <strong>size</strong> has been<br />
found to significantly <strong>in</strong>crease or decrease with depth <strong>in</strong> different taxa, but often shows no statistical<br />
pattern. Some of this variation is attributable to methodological <strong>in</strong>consistencies and/or differences <strong>in</strong><br />
how taxa or functional groups respond to environmental gradients associated with depth. Here, we<br />
show that the shape of the <strong>size</strong>-depth relationship also depends on the depth zone <strong>in</strong>habited. We<br />
measured shell <strong>size</strong> for <strong>gastropods</strong> (81 species, 3423 <strong>in</strong>dividuals) collected <strong>in</strong> the western North<br />
Atlantic from depths of 200 to 5000 m. This database makes it possible to assess <strong>size</strong> with<strong>in</strong> species<br />
and among taxa, and to document how <strong>body</strong> <strong>size</strong> changes across the cont<strong>in</strong>ental marg<strong>in</strong> and abyssal<br />
pla<strong>in</strong>. Quantile regression shows that maximum <strong>size</strong> atta<strong>in</strong>ed among all <strong>gastropods</strong> <strong>in</strong>creases with<br />
depth <strong>in</strong> the bathyal zone, and then decreases <strong>in</strong> the abyss. This overall unimodal pattern appears to<br />
be generated partly by with<strong>in</strong>-species cl<strong>in</strong>es. Size tends to <strong>in</strong>crease with depth <strong>in</strong> species with upperto<br />
mid-bathyal distributions, and to decrease with depth <strong>in</strong> species with lower-bathyal to abyssal distributions,<br />
<strong>in</strong>dependent of feed<strong>in</strong>g type and mode of larval development. The shift from predom<strong>in</strong>antly<br />
positive to negative specific <strong>size</strong>-depth cl<strong>in</strong>es at the bathyal-abyssal transition and the prevalence<br />
of smaller <strong>in</strong>dividuals <strong>in</strong> the abyss may reflect a fundamental change <strong>in</strong> ecological opportunity.<br />
KEY WORDS: Benthic · Productivity · Source-s<strong>in</strong>k dynamics · Quantile regression · Western North<br />
Atlantic · Deep <strong>sea</strong> · Body <strong>size</strong><br />
Resale or republication not permitted without written consent of the publisher<br />
these studies exam<strong>in</strong>e depth trends <strong>in</strong> the average <strong>size</strong><br />
of whole functional groups or higher taxa. The results<br />
are highly disparate, ow<strong>in</strong>g <strong>in</strong> part to methodological<br />
differences, and presumably to real biological differences<br />
<strong>in</strong> how faunal groups respond to depth gradients<br />
(Rex & Etter 1998).<br />
The relationship between average <strong>size</strong> and depth<br />
depends on either variation with<strong>in</strong> species or depthrelated<br />
replacement of species that differ <strong>in</strong> <strong>size</strong>. S<strong>in</strong>ce<br />
adaptation is a property of species, not communities,<br />
the explanation of depth trends <strong>in</strong> average <strong>size</strong> ultimately<br />
must be sought at the species level. There have<br />
been very few measurements of <strong>size</strong>-depth <strong>patterns</strong><br />
with<strong>in</strong> <strong>deep</strong>-<strong>sea</strong> macrofaunal species. Among gastro-<br />
© Inter-Re<strong>sea</strong>rch 2005 · www.<strong>in</strong>t-res.com
182<br />
pod species, the <strong>size</strong>-depth cl<strong>in</strong>es that have been<br />
exam<strong>in</strong>ed are mostly positive (Rex & Etter 1998, Rex et<br />
al. 1999, Cla<strong>in</strong> & Rex 2000, McCla<strong>in</strong> & Rex 2001) or <strong>in</strong>significant,<br />
but negative <strong>patterns</strong> are known (Olabarria<br />
& Thurston 2003, this study). Roy (2002) found a<br />
variety of <strong>size</strong>-depth trends <strong>in</strong> gastropod families on<br />
the cont<strong>in</strong>ental shelf of the eastern North Pacific.<br />
In the present study, we document <strong>size</strong>-depth <strong>patterns</strong><br />
with<strong>in</strong> and among gastropod species us<strong>in</strong>g a<br />
greatly expanded database of <strong>in</strong>dividuals and species,<br />
and more equable depth coverage. Size-depth trends<br />
change gradually from positive to negative with<br />
<strong>in</strong>creas<strong>in</strong>g depth. This shift appears to be related to<br />
processes that also regulate biodiversity <strong>in</strong> bathyal and<br />
abyssal regions.<br />
MATERIALS AND METHODS<br />
To obta<strong>in</strong> a more comprehensive picture of <strong>size</strong>depth<br />
trends, we comb<strong>in</strong>ed 2 exist<strong>in</strong>g databases on turrid<br />
neo<strong>gastropods</strong> (Rex et al. 1999, Cla<strong>in</strong> & Rex 2000)<br />
with new measurements of shell dimensions on 2809<br />
Mar Ecol Prog Ser 297: 181–187, 2005<br />
additional <strong>in</strong>dividuals from 70 caenogastropod and<br />
vetigastropod species. If samples for <strong>in</strong>dividual species<br />
at a site exceeded 100, we selected 50 <strong>in</strong>dividuals at<br />
random to measure. In total, the material analyzed represents<br />
3423 <strong>in</strong>dividuals distributed among 81 species.<br />
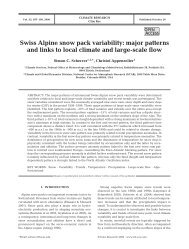
The samples were collected us<strong>in</strong>g epibenthic sleds<br />
(Hessler & Sanders 1967) and anchor dredges (Sanders<br />
et al. 1965) from depths of 196 to 5042 m south of New<br />
England (Fig. 1) as part of the Woods Hole Oceanographic<br />
Institution’s Benthic Sampl<strong>in</strong>g Program<br />
(Sanders 1977). Analyses of trophic roles and modes of<br />
larval development <strong>in</strong> the assemblage can be found <strong>in</strong><br />
Rex (1976) and Rex & Warén (1982).<br />
Images of all prosobranch shells were obta<strong>in</strong>ed from<br />
a Spot TR digital camera mounted to a Nikon SMZ1000<br />
dissection scope. Digital images were analyzed and<br />
imaged on a Mac<strong>in</strong>tosh G4 us<strong>in</strong>g Spot Advanced software.<br />
Shell <strong>size</strong> was measured as maximum height<br />
plus maximum width, with the shell <strong>in</strong> standard orientation<br />
as described by Rex et al. (1999). The relationship<br />
between <strong>size</strong> and depth was exam<strong>in</strong>ed with quantile<br />
regression (Scharf et al. 1998, Cade et al. 1999,<br />
Cade & Noon 2003) us<strong>in</strong>g the statistical software pack-<br />
Fig. 1. Map of sampl<strong>in</strong>g localities <strong>in</strong> the Northwest Atlantic Ocean used to assess <strong>bathymetric</strong> <strong>patterns</strong> of shell <strong>size</strong>
age BLOSSOM TM , developed by the Midcont<strong>in</strong>ental<br />
Ecological Science Center. Most theories of optimal<br />
<strong>size</strong> predict the <strong>size</strong> at which animals stop grow<strong>in</strong>g<br />
(Sebens 1987, Chapelle & Peck 1999), and quantile<br />
regression provides a way to detect trends <strong>in</strong> f<strong>in</strong>al <strong>size</strong><br />
without sacrific<strong>in</strong>g other <strong>in</strong>formation on the distribution<br />
of <strong>size</strong> (McCla<strong>in</strong> & Rex 2001). Throughout the<br />
paper, we refer to the largest <strong>size</strong> atta<strong>in</strong>ed per depth as<br />
maximum <strong>size</strong>. We explored 99, 95, 90 and 85% quantile<br />
regressions for relationships of <strong>size</strong> to depth. We<br />
report the 99, 95 and 90% quantiles for the relationship<br />
of <strong>in</strong>dividual <strong>size</strong> to depth us<strong>in</strong>g all <strong>gastropods</strong><br />
measured. For <strong>size</strong>-depth cl<strong>in</strong>es <strong>in</strong> <strong>in</strong>dividual species,<br />
we report the 85% quantile, which showed the<br />
greatest number of significant relationships.<br />
RESULTS AND DISCUSSION<br />
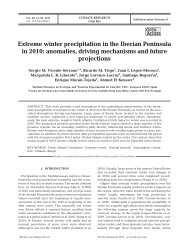
The <strong>in</strong>terspecific analysis of all gastropod <strong>in</strong>dividuals<br />
shows a unimodal pattern of <strong>size</strong> with depth (Fig. 2).<br />
Size <strong>in</strong>creases to around 3000 m <strong>in</strong> the bathyal zone,<br />
and then decreases toward the abyss. We used parabolic<br />
quantile regressions to describe this pattern<br />
because they expla<strong>in</strong> considerably more variance<br />
(about 20%) than l<strong>in</strong>ear regressions (about 2 to 5%).<br />
The <strong>in</strong>crease <strong>in</strong> <strong>size</strong> across the bathyal region essentially<br />
corroborates earlier f<strong>in</strong>d<strong>in</strong>gs (Rex & Etter 1998,<br />
Rex et al. 1999, Cla<strong>in</strong> & Rex 2000, McCla<strong>in</strong> & Rex<br />
Fig. 2. Quantile regression plots of the<br />
relationship between maximum <strong>size</strong><br />
and depth for all <strong>in</strong>dividuals (N =<br />
3423, S = 81). R 1 = 0.1982, 0.2052, and<br />
0.2022 for 99, 95, and 90% quantiles,<br />
respectively; p = 0.0002 for all quantiles.<br />
Regression equations for 99%:<br />
y = 1.831 + 0.019x – 0.000003x 2 , 95%:<br />
y = 2.178 + 0.012x – 0.000002x 2 ; 90%:<br />
y = 2.045 + 0.009x – 0.000002x 2<br />
McCla<strong>in</strong> et al.: Body <strong>size</strong> <strong>patterns</strong> <strong>in</strong> <strong>deep</strong>-<strong>sea</strong> <strong>gastropods</strong><br />
183<br />
2001). The reduction of <strong>size</strong> <strong>in</strong> the abyss had not been<br />
observed because of the paucity of abyssal data <strong>in</strong> the<br />
North Atlantic, although Harasewych & Kantor (2004)<br />
recently showed that the average <strong>size</strong> of bucc<strong>in</strong>oidean<br />
snails decreases from bathyal to abyssal depths <strong>in</strong> the<br />
Scotia Sea off Antarctica. Interest<strong>in</strong>gly, there is, <strong>in</strong><br />
h<strong>in</strong>dsight, a clear suggestion <strong>in</strong> our earlier published<br />
data that the maximum <strong>size</strong>s of abyssal populations are<br />
lower (see Rex et al. 1999, Fig. 2 bottom, and McCla<strong>in</strong><br />
& Rex 2001, Fig. 1a); but it was not statistically supported<br />
and was dismissed as an artifact. A similar trend<br />
is observed <strong>in</strong> some megafaunal elements of the <strong>deep</strong><br />
western North Atlantic (Polloni et al. 1979).<br />
A more <strong>in</strong>tuitive way of visualiz<strong>in</strong>g the pattern is<br />
shown <strong>in</strong> Fig. 3. The relative abundance distributions<br />
of <strong>in</strong>dividuals <strong>in</strong> <strong>size</strong> classes are plotted for successive<br />
1000 m depth <strong>in</strong>tervals. Normal curves are fitted to<br />
the distributions and the vertical dashed l<strong>in</strong>es approximate<br />
the 95% quantile for the data <strong>in</strong> each depth b<strong>in</strong>.<br />
Both the central tendency of <strong>size</strong> and maximum <strong>size</strong><br />
<strong>in</strong>crease to a peak <strong>in</strong> the 2000–3000 m <strong>in</strong>terval and<br />
then decl<strong>in</strong>e toward the abyss. The changes <strong>in</strong> average<br />
<strong>size</strong> among the <strong>size</strong> distributions are significant<br />
(Kolmogorov-Smirnov test at the α = 0.05 level)<br />
except between the shallowest (0–1000 m) and <strong>deep</strong>est<br />
(5000–6000 m); and between 4000–5000 and<br />
5000–6000 m, the latter of which is a <strong>sea</strong>ward<br />
extension <strong>in</strong> the abyssal pla<strong>in</strong> represent<strong>in</strong>g few<br />
data (Fig. 2).
184<br />
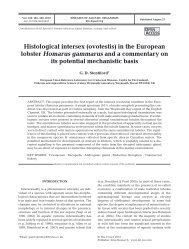
In Fig. 4, we plot <strong>size</strong>-depth cl<strong>in</strong>es for 17 species that<br />
have significant relationships at the 85% level, the<br />
quantile with the greatest number of significant<br />
regressions. The general pattern is that slopes of the<br />
regressions are primarily positive <strong>in</strong> the bathyal zone<br />
and tend to become negative <strong>in</strong> the lower bathyal and<br />
abyssal regions, although positive and negative slopes<br />
are found <strong>in</strong> all areas. When the species are divided<br />
Fig. 3. Percentage of <strong>in</strong>dividuals <strong>in</strong> 5 mm <strong>size</strong> classes for<br />
1000 m depth <strong>in</strong>tervals. Black l<strong>in</strong>es are normal curves fitted to<br />
the data and dashed l<strong>in</strong>es <strong>in</strong>dicate the <strong>size</strong> class correspond<strong>in</strong>g<br />
to the upper 95% quantile<br />
Mar Ecol Prog Ser 297: 181–187, 2005<br />
<strong>in</strong>to 2 depth groups — those with ranges that are<br />
mostly bathyal (Op, Mp, Tm, Ph, Ac, Ce, Cb, Ba, Ta<br />
and Ps <strong>in</strong> Fig. 4) and those that are mostly lower<br />
bathyal and abyssal (Tl, By, Gy, Pl, Dp, Bt, Se <strong>in</strong><br />
Fig. 4) — there is a significant shift <strong>in</strong> the sign of the<br />
<strong>size</strong>-depth slopes from more positive to more negative<br />
(χ 2 = 5.130, df = 1, p = 0.0235; the more conservative<br />
Fisher-Yates exact probability = 0.0498). The sign is<br />
unrelated to feed<strong>in</strong>g type (predator vs. deposit feeder,<br />
χ 2 = 1.431, df = 1, p = 0.2316) and to mode of larval<br />
development (dispers<strong>in</strong>g vs. nondispers<strong>in</strong>g, χ 2 = 2.837,<br />
df = 1, p = 0.0921). Information on feed<strong>in</strong>g types, larval<br />
dispersal, and def<strong>in</strong>itions of species abbreviations are<br />
provided <strong>in</strong> Table 1.<br />
Variation <strong>in</strong> maximum <strong>size</strong> as a function of depth<br />
with<strong>in</strong> species generally agrees with earlier analyses<br />
based on fewer species that were primarily bathyal <strong>in</strong><br />
distribution and used different measures of <strong>size</strong> (Rex &<br />
Etter 1998). Earlier analyses (e.g. Etter & Rex 1990, Rex<br />
& Etter 1990) were directed at document<strong>in</strong>g <strong>patterns</strong> of<br />
geographic variation <strong>in</strong> shell phenotypic traits (<strong>size</strong>,<br />
shape, sculpture) that required us<strong>in</strong>g measurements<br />
standardized to common growth stages <strong>in</strong> order to<br />
avoid the potentially confound<strong>in</strong>g effects of differences<br />
<strong>in</strong> allometry. These studies attempted to identify<br />
regions of evolutionary population differentiation.<br />
Later studies, <strong>in</strong>clud<strong>in</strong>g this one, are concerned with<br />
assess<strong>in</strong>g maximum <strong>size</strong> atta<strong>in</strong>ed because this is the<br />
variable predicted by ecological models of optimal <strong>size</strong><br />
(Sebens 1982, 1987). The lower-bathyal and abyssal<br />
Benthonella tenella, which previously showed no significant<br />
<strong>bathymetric</strong> trend for <strong>size</strong> standardized to a<br />
common growth stage (end of first adult whorl), reveals<br />
a significant negative pattern with depth for maximum<br />
<strong>size</strong> when considerably larger sample <strong>size</strong>s are <strong>in</strong>cluded<br />
(Fig. 4). Mitrella pura formerly showed a positive<br />
trend for standardized <strong>size</strong>, and now shows a negative<br />
trend for maximum <strong>size</strong>. Frigidoalvania brychia<br />
showed a positive relationship for standardized <strong>size</strong>,<br />
but no significant trend for maximum <strong>size</strong> despite the<br />
fact that standardized <strong>size</strong> and maximum <strong>size</strong> are correlated<br />
(Rex & Etter 1998). Clearly the measure of <strong>size</strong><br />
used and sample <strong>size</strong> can matter, and the addition of<br />
more lower-bathyal and abyssal material here shows<br />
that <strong>size</strong>-depth relationships change from positive to<br />
negative at the base of the cont<strong>in</strong>ental marg<strong>in</strong> both<br />
with<strong>in</strong> and among species (Fig. 4).<br />
The much expanded data and analyses presented<br />
here modify our view of <strong>size</strong>-depth trends <strong>in</strong> North<br />
Atlantic <strong>deep</strong>-<strong>sea</strong> <strong>gastropods</strong>. Initial studies, based<br />
largely on bathyal data and many fewer species (Rex &<br />
Etter 1998, Rex et al. 1999, Cla<strong>in</strong> & Rex 2000, McCla<strong>in</strong><br />
& Rex 2001), gave the impression that <strong>size</strong> <strong>in</strong>creased<br />
consistently with depth both with<strong>in</strong> and among species.<br />
Apart from the upper bathyal species Troschelia
erniciensis <strong>in</strong> the eastern Atlantic (Olabarria &<br />
Thurston 2003), there was previously no <strong>in</strong>dication that<br />
<strong>size</strong> decreases with depth. It is now apparent that the<br />
predom<strong>in</strong>ant pattern seems to be an <strong>in</strong>crease across<br />
the bathyal zone and then a decl<strong>in</strong>e at abyssal depths.<br />
The with<strong>in</strong>-species trends (Fig. 4) are reflected <strong>in</strong><br />
the overall pattern for all <strong>gastropods</strong> (Figs. 2 & 3),<br />
suggest<strong>in</strong>g that <strong>in</strong>traspecific cl<strong>in</strong>al variation exerts<br />
an important <strong>in</strong>fluence on <strong>size</strong>-depth<br />
trends. This does not deny the possibility<br />
that changes <strong>in</strong> average <strong>size</strong><br />
(Fig. 3) reflect species replacement<br />
with depth as proposed by Lampitt et<br />
al. (1986) and Jumars & Wheatcroft<br />
(1989). Gastropods do have a high rate<br />
of species replacement with depth<br />
(Rex 1977). To test for a speciesreplacement<br />
component, we regressed<br />
the average <strong>size</strong> of <strong>in</strong>dividual species<br />
aga<strong>in</strong>st the mid-po<strong>in</strong>ts of their<br />
depth ranges for all species that did<br />
not show significant cl<strong>in</strong>al effects<br />
(64 species). We detected no significant<br />
<strong>size</strong>-depth relationships us<strong>in</strong>g<br />
either least-square l<strong>in</strong>ear and quadratic<br />
methods or quantile (90, 95,<br />
99%) l<strong>in</strong>ear and quadratic methods<br />
(p = 0.11–0.89).<br />
McCla<strong>in</strong> et al.: Body <strong>size</strong> <strong>patterns</strong> <strong>in</strong> <strong>deep</strong>-<strong>sea</strong> <strong>gastropods</strong><br />
Fig. 4. Eighty five percent quantile regression plot of the relationship between<br />
maximum <strong>size</strong> and depth for abundant species of prosobranch <strong>gastropods</strong> <strong>in</strong> the<br />
Northwest Atlantic Ocean. Only significant regression l<strong>in</strong>es are shown. Information<br />
on feed<strong>in</strong>g types, larval dispersal, and def<strong>in</strong>itions of species abbreviations<br />
are provided <strong>in</strong> Table 1<br />
185<br />
The general agreement of cl<strong>in</strong>al <strong>patterns</strong><br />
(Fig. 4) with the overall <strong>size</strong>-depth<br />
distribution (Figs. 2 & 3) suggests that<br />
<strong>size</strong> is an evolutionary adaptive response<br />
to an environmental gradient <strong>in</strong><br />
the <strong>deep</strong> <strong>sea</strong>. This po<strong>in</strong>t may seem<br />
implicit and obvious, but most studies<br />
of <strong>size</strong>-depth relationships <strong>in</strong> <strong>deep</strong>-<strong>sea</strong><br />
organisms are either <strong>in</strong>terpreted <strong>in</strong><br />
terms of ecological energetics, or simply<br />
assume that <strong>size</strong> is adaptive without<br />
provid<strong>in</strong>g with<strong>in</strong>-species evidence for<br />
geographic variation. Of course, it is<br />
important to recognize that not all geographic<br />
variation <strong>in</strong> <strong>size</strong> need be adaptive<br />
— it could also be a phenotypic<br />
plastic response (Van Voorhies 1996).<br />
Deep-<strong>sea</strong> mollusks show strong depthrelated<br />
cl<strong>in</strong>al variation <strong>in</strong> shell architecture<br />
(Etter & Rex 1990) and genetic<br />
population structure (Chase et al. 1998,<br />
Etter et al. 2005), but the genetic basis<br />
of <strong>size</strong> is not known.<br />
The <strong>in</strong>crease <strong>in</strong> maximum <strong>size</strong> atta<strong>in</strong>ed<br />
with depth <strong>in</strong> bathyal snails has<br />
been attributed to <strong>in</strong>creas<strong>in</strong>g metabolic<br />
and competitive advantages of larger<br />
<strong>size</strong> as food resources dim<strong>in</strong>ish (Rex & Etter 1998, Rex<br />
et al. 1999). Larger organisms have a more efficient<br />
metabolic rate per unit weight that can maximize<br />
stand<strong>in</strong>g stock, although metabolic advantages can be<br />
offset by <strong>in</strong>verse density dependence at low density <strong>in</strong><br />
a food-limited environment like the <strong>deep</strong> <strong>sea</strong> (Thiel<br />
1975). Optimality models of <strong>body</strong> <strong>size</strong> <strong>in</strong> mar<strong>in</strong>e <strong>in</strong>vertebrates<br />
(Sebens 1982, 1987) predict that <strong>size</strong> should<br />
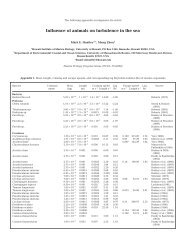
Table 1. Feed<strong>in</strong>g and larval types for species <strong>in</strong>cluded <strong>in</strong> Fig. 4<br />
Species Abbreviation Feed<strong>in</strong>g type Larval type<br />
Onoba pelagica Op Deposit feeder Nondispers<strong>in</strong>g<br />
Mitrella pura Mp Predator Nondispers<strong>in</strong>g<br />
Taranis morchii Tm Predator Nondispers<strong>in</strong>g<br />
Pusil<strong>in</strong>a harpa Ph Deposit feeder Nondispers<strong>in</strong>g<br />
Admete contabulata Ac Predator Nondispers<strong>in</strong>g<br />
Cerithiella sp. Ce Deposit feeder Nondispers<strong>in</strong>g<br />
Benthomangelia antonia Ba Predator Dispers<strong>in</strong>g<br />
Gymnobela sp. Gy Predator Dispers<strong>in</strong>g<br />
Pleurotomella lottae Pl Predator Dispers<strong>in</strong>g<br />
Cylclostrema basistriatum Cb Deposit feeder Dispers<strong>in</strong>g<br />
Theta lyronuclea Tl Predator Dispers<strong>in</strong>g<br />
Trophon abyssorum Ta Predator Nondispers<strong>in</strong>g<br />
Pleurotomella sandersoni Ps Predator Dispers<strong>in</strong>g<br />
Drilliola pru<strong>in</strong>a Dp Predator Dispers<strong>in</strong>g<br />
Benthobia tyroni By Predator Dispers<strong>in</strong>g<br />
Benthonella tenella Bt Deposit feeder Dispers<strong>in</strong>g<br />
Sequenzia eritima Se Deposit feeder Dispers<strong>in</strong>g
186<br />
decrease along gradients of decreas<strong>in</strong>g food availability<br />
because lower rates of nutrient <strong>in</strong>put depress<br />
energy <strong>in</strong>take and elevate the cost of forag<strong>in</strong>g (Rex &<br />
Etter 1998). This may account for the decrease <strong>in</strong> average<br />
<strong>size</strong> of benthic animals with depth (Thiel 1979,<br />
McCla<strong>in</strong> et al. 2005). However, with<strong>in</strong> species, adaptive<br />
tradeoffs are complex, and compet<strong>in</strong>g selective<br />
factors can shift populations away from an optimal <strong>size</strong><br />
predicted solely on the basis of energy allocation to<br />
reproduction. For example, larger <strong>size</strong> may enhance<br />
competitive ability, reduce mortality from predation<br />
and <strong>in</strong>crease the ability to exploit a broader range of<br />
food items as resources become scarcer (Lev<strong>in</strong>ton<br />
1987, Sebens 1987). Larval <strong>size</strong> also <strong>in</strong>creases with<br />
depth, and the relationship is especially strong <strong>in</strong><br />
bathyal populations (Rex & Etter 1998). Larger <strong>size</strong> at<br />
hatch<strong>in</strong>g or settlement confers several advantages <strong>in</strong><br />
mar<strong>in</strong>e snails (Spight 1976), <strong>in</strong>clud<strong>in</strong>g escape from<br />
predators, less susceptibility to starvation, greater<br />
locomotion for forag<strong>in</strong>g, and a larger range of potential<br />
food items.<br />
Clearly the simple explanations for how metabolic<br />
and competitive advantages of larger <strong>size</strong> account for<br />
positive <strong>size</strong>-depth trends <strong>in</strong> bathyal snails cannot be<br />
extended to the abyss, where <strong>size</strong> and depth are negatively<br />
related. So, why does <strong>size</strong> decrease <strong>in</strong> the abyss?<br />
One obvious concern is that the pattern could reflect<br />
sampl<strong>in</strong>g bias. Densities of the macrobenthos as a<br />
whole (Rex 1981), and <strong>gastropods</strong> (Rex et al. 1990,<br />
2005), decrease exponentially with depth and reach<br />
very low levels <strong>in</strong> the abyss. This raises the possibility<br />
that larger snails were encountered less often at<br />
abyssal depths because of undersampl<strong>in</strong>g. However,<br />
several l<strong>in</strong>es of evidence suggest that undersampl<strong>in</strong>g is<br />
not the ma<strong>in</strong> underly<strong>in</strong>g cause. First, there are considerably<br />
more samples collected <strong>in</strong> the abyss (17) than for<br />
any other major physiographic feature (cont<strong>in</strong>ental<br />
shelf, upper and lower cont<strong>in</strong>ental slope, and upper<br />
and lower cont<strong>in</strong>ental rise, 2 to 7 samples). The total<br />
sample <strong>size</strong> of the abyss (N = 1104) exceeds that of the<br />
entire lower bathyal region between 2000 and 4000 m<br />
(N = 626), where average <strong>size</strong> is conspicuously higher<br />
(Fig. 2). In addition, some of the largest <strong>in</strong>dividuals<br />
have been recovered from abyssal depths (Fig. 2). Second,<br />
abyssal assemblages show very uneven relative<br />
abundance distributions that are numerically dom<strong>in</strong>ated<br />
by 2 species, Benthonella tenella and Xyloskenea<br />
naticiformis, which have both abyssal and lower bathyal<br />
distributions, but nowhere reach large <strong>size</strong> (maximum<br />
height plus width values are about 7 and 4 mm<br />
respectively; Rex & Etter 1990, Rex et al. 2002, McCla<strong>in</strong><br />
et al. 2004). In other words, common abyssal species are<br />
characteristically small. Third, to determ<strong>in</strong>e whether<br />
collect<strong>in</strong>g larger <strong>in</strong>dividuals is biased by depth of sampl<strong>in</strong>g<br />
we regressed the partial residuals of the maxi-<br />
Mar Ecol Prog Ser 297: 181–187, 2005<br />
mum <strong>size</strong> recorded for each species (with the effect of<br />
its depth range midpo<strong>in</strong>t statistically removed) aga<strong>in</strong>st<br />
the number of <strong>in</strong>dividuals collected for each species.<br />
This relationship is not significant (r 2 = 0.007, p =<br />
0.4450, df = 79), suggest<strong>in</strong>g that the likelihood of captur<strong>in</strong>g<br />
larger <strong>in</strong>dividuals is similar across the entire<br />
depth range sampled. Still, we caution that there is considerable<br />
variation <strong>in</strong> <strong>size</strong> trends with<strong>in</strong> and among<br />
species (Figs. 2, 3 & 4), and that only more <strong>in</strong>tensive<br />
sampl<strong>in</strong>g can establish <strong>size</strong>-depth trends <strong>in</strong> a def<strong>in</strong>itive<br />
way.<br />
One possible explanation for smaller <strong>size</strong> <strong>in</strong> abyssal<br />
snails is that bathyal and abyssal zones may function as<br />
a source-s<strong>in</strong>k system for populations of some species<br />
(Rex et al. 2005). The rate of nutrient <strong>in</strong>put to the <strong>deep</strong><strong>sea</strong><br />
benthos from surface production decreases exponentially<br />
with depth across the cont<strong>in</strong>ental marg<strong>in</strong> and<br />
reaches extremely low levels <strong>in</strong> the abyss far from<br />
sources of coastal production and terrestrial runoff.<br />
This results <strong>in</strong> the well known decl<strong>in</strong>e <strong>in</strong> animal density<br />
with depth mentioned above (Gage & Tyler 1991).<br />
Species diversity also decreases from the lower bathyal<br />
region to the abyss, where stand<strong>in</strong>g stock becomes<br />
extremely low (Rex 1981, McCla<strong>in</strong> et al. 2004). The<br />
abyssal molluscan fauna consists ma<strong>in</strong>ly of <strong>deep</strong>er<br />
range extensions for a subset of bathyal species with<br />
larval dispersal. Most abyssal populations live at densities<br />
that seem too low for successful reproduction. The<br />
abyss may be an unfavorable s<strong>in</strong>k environment where<br />
many molluscan populations are reproductively unsusta<strong>in</strong>able<br />
and are ma<strong>in</strong>ta<strong>in</strong>ed by immigration from<br />
bathyal sources (Rex et al. 2005). Even the few common,<br />
and presumably more successful, abyssal species<br />
like Benthonella tenella and Xyloskenea naticiformis<br />
are small, suggest<strong>in</strong>g that the extremely low productivity<br />
of this region acts as a biogeographic filter favor<strong>in</strong>g<br />
small <strong>size</strong>. If this scenario is correct, then reduced<br />
<strong>body</strong> <strong>size</strong> at abyssal depths likely reflects unfavorable<br />
circumstances for growth. In other words, a greater<br />
proportion of abyssal <strong>in</strong>dividuals rema<strong>in</strong> relatively<br />
small either because they are immature or belong to<br />
<strong>in</strong>herently small taxa. Many species simply run out of<br />
energy for growth and reproduction as Thiel (1975,<br />
1979) suggested. The severe energy constra<strong>in</strong>ts on<br />
population growth and reproductive success of some<br />
species ultimately depress abyssal species diversity.<br />
Or, as Hutch<strong>in</strong>son (1959, p. 150) said for a different<br />
environment, ‘the rarer species <strong>in</strong> a community may be<br />
so rare that they do not exist’.<br />
Acknowledgements. We thank B. Boyle, R. Etter, J. Brown, C.<br />
Stuart, and 3 anonymous reviewers for read<strong>in</strong>g the manuscript<br />
and for their helpful comments. R. Etter also provided<br />
advice on the statistical analysis and <strong>in</strong>terpretation. R.<br />
Costello assisted with imag<strong>in</strong>g systems and software, and A.<br />
Warén with gastropod taxonomy. Maria Mahoney helped
prepare the manuscript. This re<strong>sea</strong>rch is funded by National<br />
Science Foundation grants GER-9552836 and OCE-0135949<br />
to M.A.R.<br />
LITERATURE CITED<br />
Brown JH (1995) Macroecology. University of Chicago Press,<br />
Chicago, IL<br />
Cade BS, Noon BR (2003) A gentle <strong>in</strong>troduction to quantile<br />
regression for ecologists. Front Ecol Environ 1:412–420<br />
Cade BS, Terrel JW, Schroeder RL (1999) Estimat<strong>in</strong>g effects of<br />
limit<strong>in</strong>g factors with regression quantiles. Ecology 80:<br />
311–322<br />
Chapelle G, Peck LS (1999) Polar gigantism dictated by oxygen<br />
availability. Nature 399:114–115<br />
Chase MR, Etter RJ, Rex MA, Quattro JM (1998) Bathymetric<br />
<strong>patterns</strong> of genetic variation <strong>in</strong> a <strong>deep</strong>-<strong>sea</strong> protobranch<br />
bivalve, Dem<strong>in</strong>ucula atacellana. Mar Biol 131:301–308<br />
Cla<strong>in</strong> AJ, Rex MA (2000) Size-depth <strong>patterns</strong> <strong>in</strong> two bathyal<br />
turrid <strong>gastropods</strong>: Benthomangelia antonia (Dall) and<br />
Oenopota ovalis (Friele). Nautilus 114:93–98<br />
Etter RJ, Rex MA (1990) Population differentiation decreases<br />
with depth <strong>in</strong> <strong>deep</strong>-<strong>sea</strong> <strong>gastropods</strong>. Deep-Sea Res 37:<br />
1251–1261<br />
Etter RJ, Rex MA, Chase MR, Quattro JM (2005) Population<br />
differentiation decreases with depth <strong>in</strong> <strong>deep</strong>-<strong>sea</strong> bivalves.<br />
Evolution 59 (<strong>in</strong> press)<br />
Gage JD, Tyler PA (1991) Deep-<strong>sea</strong> biology: a natural history<br />
of organisms at the <strong>deep</strong>-<strong>sea</strong> floor. Cambridge University<br />
Press, Cambridge<br />
Gillooly JF, Brown JH, West GB, Savage VM, Charnov EL<br />
(2001) Effects of <strong>size</strong> and temperature on metabolic rate.<br />
Science 293:2248–2251<br />
Gillooly JF, Charnov EL, West GB, Savage VM, Brown JH<br />
(2002) Effects of <strong>size</strong> and temperature on developmental<br />
time. Nature 417:70–73<br />
Harasewych MG, Kantor YI (2004) The <strong>deep</strong>-<strong>sea</strong> Bucc<strong>in</strong>oidea<br />
(Gastropoda: Neogastropoda) of the Scotia Sea and adjacent<br />
abyssal pla<strong>in</strong>s and trenches. Nautilus 118:1–42<br />
Hessler RR, Sanders HL (1967) Faunal diversity <strong>in</strong> the <strong>deep</strong><br />
<strong>sea</strong>. Deep-Sea Res 14:65–78<br />
Hutch<strong>in</strong>son GE (1959) Homage to Santa Rosalia, or why are<br />
there so many k<strong>in</strong>ds of animals. Am Nat 93:145–159<br />
Jumars PA, Wheatcroft RA (1989) Responses of benthos to<br />
chang<strong>in</strong>g food qualtity and quantity, with a focus on deposit<br />
feed<strong>in</strong>g and bioturbation. In: Berger WH, Smetacek<br />
VS, Wefer G (eds) Productivity of the ocean: past and<br />
present. Wiley, New York, p 235–253<br />
Lampitt RS, Billet DSM, Rice AL (1986) Biomass of the <strong>in</strong>vertebrate<br />
megabenthos from 500–4100 m <strong>in</strong> the northeast<br />
Atlantic Ocean. Mar Biol 93:69–81<br />
Lev<strong>in</strong>ton JS (1987) The <strong>body</strong> <strong>size</strong>-prey <strong>size</strong> hypothesis and<br />
Hydrobia. Ecology 68:229–231<br />
McCla<strong>in</strong> CR, Rex MA (2001) The relationship between dissolved<br />
oxygen concentration and maximum <strong>size</strong> <strong>in</strong> <strong>deep</strong><strong>sea</strong><br />
turrid <strong>gastropods</strong>: an application of quantile regression.<br />
Mar Biol 139:681–685<br />
McCla<strong>in</strong> CR, Rex MA, Johnson N (2004) Morphological disparity<br />
as a biodiversity metric <strong>in</strong> lower bathyal and abyssal<br />
gastropod assemblages. Evolution 58:338–348<br />
McCla<strong>in</strong> CR, Rex MA, Etter RJ (2005) Deep-<strong>sea</strong> macroecology.<br />
In: Witman JD, Roy K (eds) Mar<strong>in</strong>e macroecology.<br />
University of Chicago Press, Chicago, IL (<strong>in</strong> press)<br />
Olabarria C, Thurston MH (2003) Latitud<strong>in</strong>al and <strong>bathymetric</strong><br />
Editorial responsibility: Lisa Lev<strong>in</strong> (Contribut<strong>in</strong>g Editor),<br />
La Jolla, California, USA<br />
McCla<strong>in</strong> et al.: Body <strong>size</strong> <strong>patterns</strong> <strong>in</strong> <strong>deep</strong>-<strong>sea</strong> <strong>gastropods</strong><br />
187<br />
trends <strong>in</strong> <strong>body</strong> <strong>size</strong> of the <strong>deep</strong>-<strong>sea</strong> gastropod Troshelia<br />
berniciensis (K<strong>in</strong>g). Mar Biol 143:723–730<br />
Peters RH (1983) The ecological implications of <strong>body</strong> <strong>size</strong>.<br />
Cambridge University Press, Cambridge<br />
Polloni P, Haedrich R, Rowe G, Clifford CH (1979) Size-depth<br />
relationship <strong>in</strong> <strong>deep</strong> ocean animals. Int Rev Gesamten<br />
Hydrobiol 64:39–46<br />
Rex MA (1976) Biological accommodation <strong>in</strong> the <strong>deep</strong>-<strong>sea</strong><br />
benthos: comparative evidence on the importance of predation<br />
and productivity. Deep-Sea Res 23:957–987<br />
Rex MA (1977) Zonation <strong>in</strong> <strong>deep</strong>-<strong>sea</strong> <strong>gastropods</strong>: the importance<br />
of biological <strong>in</strong>teractions to rates of zonation. Eur<br />
Symp Mar Biol 11:521–530<br />
Rex MA (1981) Community structure <strong>in</strong> the <strong>deep</strong>-<strong>sea</strong> benthos.<br />
Annu Rev Ecol Syst 12:331–353<br />
Rex MA, Etter RJ (1990) Geographic variation <strong>in</strong> two <strong>deep</strong><strong>sea</strong><br />
<strong>gastropods</strong>, Benthonella tenella (Jeffreys) and Benthomangelia<br />
antonia (Dall). Deep-Sea Res 37:1229–1249<br />
Rex MA, Etter RJ (1998) Bathymetric <strong>patterns</strong> of <strong>body</strong> <strong>size</strong>:<br />
implications for <strong>deep</strong>-<strong>sea</strong> biodiversity. Deep-Sea Res II 45:<br />
103–127<br />
Rex MA, Warén A (1982) Planktotrophic development <strong>in</strong><br />
<strong>deep</strong>-<strong>sea</strong> prosobranch snails from the western North<br />
Atlantic. Deep-Sea Res 29:171–184<br />
Rex MA, Etter RJ, Nimeskern PW Jr (1990) Density estimates<br />
for <strong>deep</strong>-<strong>sea</strong> gastropod assemblages. Deep-Sea Res 37:<br />
555–569<br />
Rex MA, Etter RJ, Cla<strong>in</strong> AJ, Hill MS (1999) Bathymetric <strong>patterns</strong><br />
of <strong>body</strong> <strong>size</strong> <strong>in</strong> <strong>deep</strong>-<strong>sea</strong> <strong>gastropods</strong>. Evolution 53:<br />
1298–1301<br />
Rex MA, Bond A, Etter RJ, Rex AC, Stuart CT (2002) Geographic<br />
variation of shell geometry <strong>in</strong> the abyssal snail Xyloskenea<br />
naticiformis (Jeffreys, 1883). Veliger 45:218–223<br />
Rex MA, McCla<strong>in</strong> CR, Johnson NA, Etter RJ, Allen JA,<br />
Bouchet P, Warén A (2005) A source-s<strong>in</strong>k hypothesis for<br />
abyssal biodiversity. Am Nat 162:163–178<br />
Roy K (2002) Bathymetry and <strong>body</strong> <strong>size</strong> <strong>in</strong> mar<strong>in</strong>e <strong>gastropods</strong>: a<br />
shallow water perspective. Mar Ecol Prog Ser 237:143–149<br />
Sanders HL (1977) Evolutionary ecology of the <strong>deep</strong>-<strong>sea</strong> benthos.<br />
In: Goulden CE (ed) The chang<strong>in</strong>g scenes <strong>in</strong> natural<br />
sciences: 1776–1976. Special Publication, Academy of<br />
Natural Sciences, Pennsylvania, PA, p 223–243<br />
Sanders HL, Hessler RR, Hampson GR (1965) An <strong>in</strong>troduction to<br />
the study of the <strong>deep</strong>-<strong>sea</strong> benthic faunal assemblages along<br />
the Gay Head-Bermuda transect. Deep-Sea Res 12:845–867<br />
Savage VM, Gillooly JF, Woodruff WH, West GB, Allen AP,<br />
Enquist BJ, Brown JH (2004) The predom<strong>in</strong>ance of quarter-power<br />
scal<strong>in</strong>g <strong>in</strong> biology. Funct Ecol 18:257–282<br />
Scharf FS, Juanes F, Sutherland M (1998) Inferr<strong>in</strong>g ecological<br />
relationships from the edges of scatter diagrams: comparison<br />
of regression techniques. Ecology 79:448–460<br />
Sebens KP (1982) The limits to <strong>in</strong>determ<strong>in</strong>ate growth: an optimal<br />
<strong>size</strong> model applied to passive suspension feeders.<br />
Ecology 63:209–222<br />
Sebens KP (1987) The ecology of <strong>in</strong>determ<strong>in</strong>ate growth <strong>in</strong><br />
animals. Annu Rev Ecol Syst 18:371–407<br />
Spight TM (1976) Ecology of hatch<strong>in</strong>g <strong>size</strong> for mar<strong>in</strong>e snails.<br />
Oecologia 24:283–294<br />
Thiel H (1975) The <strong>size</strong> structure of the <strong>deep</strong>-<strong>sea</strong> benthos.<br />
Int Rev Ges Hyrdobiol 60:575–606<br />
Thiel H (1979) Structural aspects of the <strong>deep</strong>-<strong>sea</strong> benthos.<br />
Ambio Spec Rep 6:25–31<br />
Van Voorhies WA (1996) Bergmann <strong>size</strong> cl<strong>in</strong>es: a s<strong>in</strong>gle<br />
explanation for their occurrence <strong>in</strong> ectotherms. Evolution<br />
50:1259–1264<br />
Submitted: November 10, 2004; Accepted: March 31, 2005<br />
Proofs received from author(s): July 7, 2005