1997 Ornamentals Research Report - AUrora - Auburn University
1997 Ornamentals Research Report - AUrora - Auburn University
1997 Ornamentals Research Report - AUrora - Auburn University

Create successful ePaper yourself
Turn your PDF publications into a flip-book with our unique Google optimized e-Paper software.
22<br />
22<br />
ALABAMA AGRICULTURAL ExPERIMENT STATION<br />
ALABAMA AGRICULTURAL EXPERIMENT STATION<br />
of flower shoots was only reduced when plants were grown in<br />
All three poinsettia cultivars grew well and attained<br />
25:75 or 0:100 peat:slag fiber. Poinsettia 'Freedom Pink' and an acceptable market quality when grown in media containing<br />
'Freedom White' grown in Fafard 3B, Cornell peat-lite mix B, 50% or less slag fiber. Higher slag fiber percentages in the<br />
and 100:0, 75:25, or 50:50% peat:slag fiber were similar in media resulted in reduced growth and quality. This result may,<br />
growth index, flower shoot number, and quality rating. Those in part, be due to the increase in media pH and its adverse<br />
grown in 25:75 or 0:100 peat:slag fiber were smaller and of<br />
poorer quality. Only 100% slag fiber reduced plant height in<br />
effect on nutrient availability.<br />
both cultivars.<br />
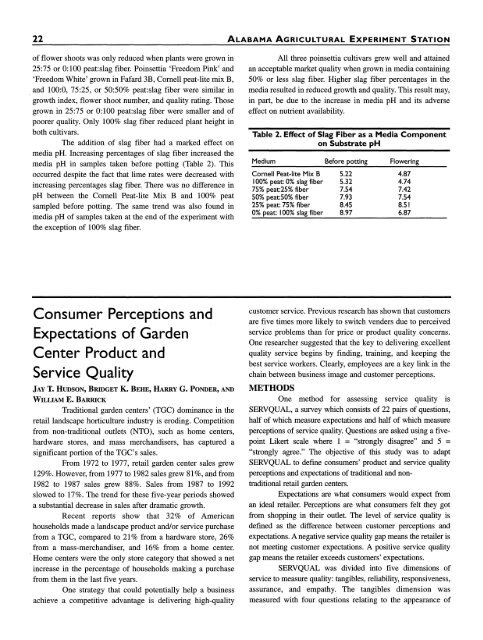
Table 2. Effect of Slag Fiber as a Media Component<br />
The addition of slag fiber had a marked effect on<br />
on Substrate pH<br />
media pH. Increasing percentages of slag fiber increased the<br />
media pH in samples taken before potting (Table 2). This Medium Before potting Flowering<br />
occurred despite the fact that lime rates were decreased with<br />
increasing percentages slag fiber. There was no difference in<br />
pH between the Cornell Peat-lite Mix B and 100% peat<br />
sampled before potting. The same trend was also found in<br />
media pH of samples taken at the end of the experiment with<br />
the exception of 100% slag fiber.<br />
Cornell Peat-lite Mix B<br />
100% peat: 0% slag fiber<br />
75% peat:25% fiber<br />
50% peat:50% fiber<br />
25% peat: 75% fiber<br />
0% peat: 100% slag fiber<br />
5.22<br />
5.32<br />
7.54<br />
7.93<br />
8.45<br />
8.97<br />
4.87<br />
4.74<br />
7.42<br />
7.54<br />
8.51<br />
6.87<br />
I./11 U~CVVVVII WI~ LVLLI~LI I ~UL-~IIL~ lrIIA Y UIIU IVV/V V~UC 'Il~n nP;1T 'll~n TIT<br />
Consumer Perceptions and<br />
Expectations of Garden<br />
Center Product and<br />
Service Quality<br />
JAY T. HUDSON, BRIDGET K. BEHE, HARRY G. PONDER, AND<br />
WILLIAM E. BARRICK<br />
Traditional garden centers' (TGC) dominance in the<br />
retail landscape horticulture industry is eroding. Competition<br />
from non-traditional outlets (NTO), such as home centers,<br />
hardware stores, and mass merchandisers, has captured a<br />
significant portion of the TGC's sales.<br />
From 1972 to 1977, retail garden center sales grew<br />
129%. However, from 1977 to 1982 sales grew 81%, and from<br />
1982 to 1987 sales grew 88%. Sales from 1987 to 1992<br />
slowed to 17%. The trend for these five-year periods showed<br />
a substantial decrease in sales after dramatic growth.<br />
Recent reports show that 32% of American<br />
households made a landscape product and/or service purchase<br />
from a TGC, compared to 21% from a hardware store, 26%<br />
from a mass-merchandiser, and 16% from a home center.<br />
Home centers were the only store category that showed a net<br />
increase in the percentage of households making a purchase<br />
from them in the last five years.<br />
One strategy that could potentially help a business<br />
achieve a competitive advantage is delivering high-quality<br />
customer service. Previous research has shown that customers<br />
are five times more likely to switch venders due to perceived<br />
service problems than for price or product quality concerns.<br />
One researcher suggested that the key to delivering excellent<br />
quality service begins by finding, training, and keeping the<br />
best service workers. Clearly, employees are a key link in the<br />
chain between business image and customer perceptions.<br />
METHODS<br />
One method for assessing service quality is<br />
SERVQUAL, a survey which consists of 22 pairs of questions,<br />
half of which measure expectations and half of which measure<br />
perceptions of service quality. Questions are asked using a fivepoint<br />
Likert scale where 1 = "strongly disagree" and 5 =<br />
"strongly agree." The objective of this study was to adapt<br />
SERVQUAL to define consumers' product and service quality<br />
perceptions and expectations of traditional and nontraditional<br />
retail garden centers.<br />
Expectations are what consumers would expect from<br />
an ideal retailer. Perceptions are what consumers felt they got<br />
from shopping in their outlet. The level of service quality is<br />
defined as the difference between customer perceptions and<br />
expectations. A negative service quality gap means the retailer is<br />
not meeting customer expectations. A positive service quality<br />
gap means the retailer exceeds customers' expectations.<br />
SERVQUAL was divided into five dimensions of<br />
service to measure quality: tangibles, reliability, responsiveness,<br />
assurance, and empathy. The tangibles dimension was<br />
measured with four questions relating to the appearance of