Revenues - Deutsche Bahn AG
Revenues - Deutsche Bahn AG
Revenues - Deutsche Bahn AG

Create successful ePaper yourself
Turn your PDF publications into a flip-book with our unique Google optimized e-Paper software.
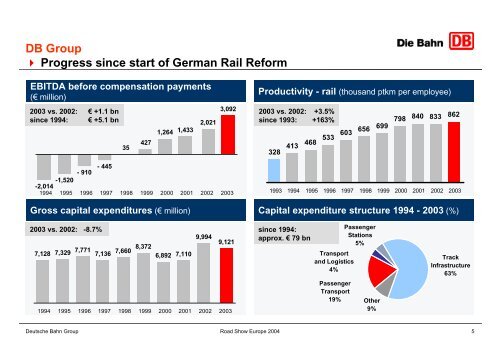
DB Group<br />
Progress since start of German Rail Reform<br />
EBITDA before compensation payments<br />
(€ million)<br />
2003 vs. 2002: € +1.1 bn<br />
since 1994: € +5.1 bn<br />
Gross capital expenditures (€ million)<br />
35<br />
427<br />
1,264<br />
1,433<br />
- 445<br />
- 910<br />
-1,520<br />
-2,014<br />
1994 1995 1996 1997 1998 1999 2000 2001 2002 2003<br />
2003 vs. 2002: -8.7%<br />
7,128<br />
7,329<br />
7,771<br />
7,136<br />
7,660<br />
8,372<br />
6,892<br />
7,110<br />
2,021<br />
9,994<br />
3,092<br />
9,121<br />
1994 1995 1996 1997 1998 1999 2000 2001 2002 2003<br />
<strong>Deutsche</strong> <strong>Bahn</strong> Group Road Show Europe 2004<br />
Productivity - rail (thousand ptkm per employee)<br />
2003 vs. 2002: +3.5%<br />
since 1993: +163%<br />
328<br />
413 468 533 603 656 699<br />
Transport<br />
and Logistics<br />
4%<br />
Passenger<br />
Transport<br />
19%<br />
Passenger<br />
Stations<br />
5%<br />
Other<br />
9%<br />
798<br />
840 833 862<br />
1993 1994 1995 1996 1997 1998 1999 2000 2001 2002 2003<br />
Capital expenditure structure 1994 - 2003 (%)<br />
since 1994:<br />
approx. € 79 bn<br />
Track<br />
Infrastructure<br />
63%<br />
5