Journal of Colloid and Interface Science - Western Engineering ...
Journal of Colloid and Interface Science - Western Engineering ...
Journal of Colloid and Interface Science - Western Engineering ...

You also want an ePaper? Increase the reach of your titles
YUMPU automatically turns print PDFs into web optimized ePapers that Google loves.
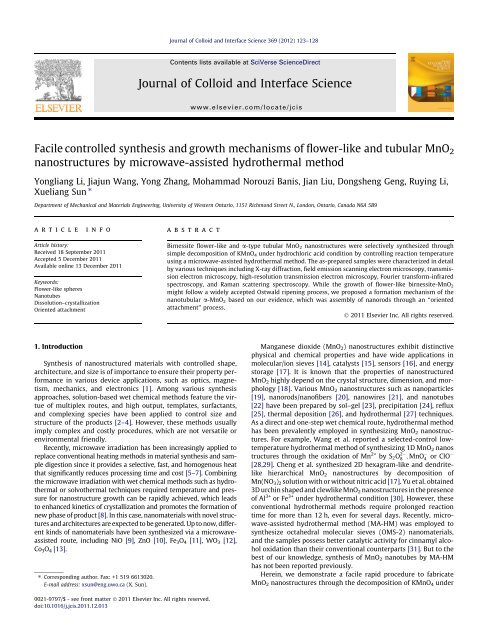
Facile controlled synthesis <strong>and</strong> growth mechanisms <strong>of</strong> flower-like <strong>and</strong> tubular MnO 2<br />
nanostructures by microwave-assisted hydrothermal method<br />
Yongliang Li, Jiajun Wang, Yong Zhang, Mohammad Norouzi Banis, Jian Liu, Dongsheng Geng, Ruying Li,<br />
Xueliang Sun ⇑<br />
Department <strong>of</strong> Mechanical <strong>and</strong> Materials <strong>Engineering</strong>, University <strong>of</strong> <strong>Western</strong> Ontario, 1151 Richmond Street N., London, Ontario, Canada N6A 5B9<br />
article info<br />
Article history:<br />
Received 18 September 2011<br />
Accepted 5 December 2011<br />
Available online 13 December 2011<br />
Keywords:<br />
Flower-like spheres<br />
Nanotubes<br />
Dissolution–crystallization<br />
Oriented attachment<br />
1. Introduction<br />
abstract<br />
Synthesis <strong>of</strong> nanostructured materials with controlled shape,<br />
architecture, <strong>and</strong> size is <strong>of</strong> importance to ensure their property performance<br />
in various device applications, such as optics, magnetism,<br />
mechanics, <strong>and</strong> electronics [1]. Among various synthesis<br />
approaches, solution-based wet chemical methods feature the virtue<br />
<strong>of</strong> multiplex routes, <strong>and</strong> high output, templates, surfactants,<br />
<strong>and</strong> complexing species have been applied to control size <strong>and</strong><br />
structure <strong>of</strong> the products [2–4]. However, these methods usually<br />
imply complex <strong>and</strong> costly procedures, which are not versatile or<br />
environmental friendly.<br />
Recently, microwave irradiation has been increasingly applied to<br />
replace conventional heating methods in material synthesis <strong>and</strong> sample<br />
digestion since it provides a selective, fast, <strong>and</strong> homogenous heat<br />
that significantly reduces processing time <strong>and</strong> cost [5–7]. Combining<br />
the microwave irradiation with wet chemical methods such as hydrothermal<br />
or solvothermal techniques required temperature <strong>and</strong> pressure<br />
for nanostructure growth can be rapidly achieved, which leads<br />
to enhanced kinetics <strong>of</strong> crystallization <strong>and</strong> promotes the formation <strong>of</strong><br />
new phase <strong>of</strong> product [8]. In this case, nanomaterials with novel structures<br />
<strong>and</strong> architectures are expected to be generated. Up to now, different<br />
kinds <strong>of</strong> nanomaterials have been synthesized via a microwaveassisted<br />
route, including NiO [9], ZnO[10], Fe 3O 4 [11], WO 3 [12],<br />
Co3O4 [13].<br />
⇑ Corresponding author. Fax: +1 519 6613020.<br />
E-mail address: xsun@eng.uwo.ca (X. Sun).<br />
0021-9797/$ - see front matter Ó 2011 Elsevier Inc. All rights reserved.<br />
doi:10.1016/j.jcis.2011.12.013<br />
<strong>Journal</strong> <strong>of</strong> <strong>Colloid</strong> <strong>and</strong> <strong>Interface</strong> <strong>Science</strong> 369 (2012) 123–128<br />
Contents lists available at SciVerse <strong>Science</strong>Direct<br />
<strong>Journal</strong> <strong>of</strong> <strong>Colloid</strong> <strong>and</strong> <strong>Interface</strong> <strong>Science</strong><br />
www.elsevier.com/locate/jcis<br />
Birnessite flower-like <strong>and</strong> a-type tubular MnO2 nanostructures were selectively synthesized through<br />
simple decomposition <strong>of</strong> KMnO4 under hydrochloric acid condition by controlling reaction temperature<br />
using a microwave-assisted hydrothermal method. The as-prepared samples were characterized in detail<br />
by various techniques including X-ray diffraction, field emission scanning electron microscopy, transmission<br />
electron microscopy, high-resolution transmission electron microscopy, Fourier transform-infrared<br />
spectroscopy, <strong>and</strong> Raman scattering spectroscopy. While the growth <strong>of</strong> flower-like birnessite-MnO2<br />
might follow a widely accepted Ostwald ripening process, we proposed a formation mechanism <strong>of</strong> the<br />
nanotubular a-MnO2 based on our evidence, which was assembly <strong>of</strong> nanorods through an ‘‘oriented<br />
attachment’’ process.<br />
Ó 2011 Elsevier Inc. All rights reserved.<br />
Manganese dioxide (MnO2) nanostructures exhibit distinctive<br />
physical <strong>and</strong> chemical properties <strong>and</strong> have wide applications in<br />
molecular/ion sieves [14], catalysts [15], sensors [16], <strong>and</strong> energy<br />
storage [17]. It is known that the properties <strong>of</strong> nanostructured<br />
MnO2 highly depend on the crystal structure, dimension, <strong>and</strong> morphology<br />
[18]. Various MnO2 nanostructures such as nanoparticles<br />
[19], nanorods/nan<strong>of</strong>ibers [20], nanowires [21], <strong>and</strong> nanotubes<br />
[22] have been prepared by sol–gel [23], precipitation [24], reflux<br />
[25], thermal deposition [26], <strong>and</strong> hydrothermal [27] techniques.<br />
As a direct <strong>and</strong> one-step wet chemical route, hydrothermal method<br />
has been prevalently employed in synthesizing MnO2 nanostructures.<br />
For example, Wang et al. reported a selected-control lowtemperature<br />
hydrothermal method <strong>of</strong> synthesizing 1D MnO2 nanos<br />
tructures through the oxidation <strong>of</strong> Mn 2+ by S2O 2<br />
8 ; MnO4 or ClO<br />
[28,29]. Cheng et al. synthesized 2D hexagram-like <strong>and</strong> dendritelike<br />
hierarchical MnO2 nanostructures by decomposition <strong>of</strong><br />
Mn(NO3)2 solution with or without nitric acid [17]. Yu et al. obtained<br />
3D urchin shaped <strong>and</strong> clewlike MnO2 nanostructures in the presence<br />
<strong>of</strong> Al 3+ or Fe 3+ under hydrothermal condition [30]. However, these<br />
conventional hydrothermal methods require prolonged reaction<br />
time for more than 12 h, even for several days. Recently, microwave-assisted<br />
hydrothermal method (MA-HM) was employed to<br />
synthesize octahedral molecular sieves (OMS-2) nanomaterials,<br />
<strong>and</strong> the samples possess better catalytic activity for cinnamyl alcohol<br />
oxidation than their conventional counterparts [31]. But to the<br />
best <strong>of</strong> our knowledge, synthesis <strong>of</strong> MnO2 nanotubes by MA-HM<br />
has not been reported previously.<br />
Herein, we demonstrate a facile rapid procedure to fabricate<br />
MnO2 nanostructures through the decomposition <strong>of</strong> KMnO4 under
124 Y. Li et al. / <strong>Journal</strong> <strong>of</strong> <strong>Colloid</strong> <strong>and</strong> <strong>Interface</strong> <strong>Science</strong> 369 (2012) 123–128<br />
hydrochloric acid condition by MA-HM. 3D hierarchical nanostructures<br />
<strong>and</strong> 1D nanotubes <strong>of</strong> MnO 2 with different crystallographic<br />
forms were selectively obtained by controlling the reaction parameters.<br />
The growth mechanism was studied <strong>and</strong> discussed in detail<br />
based on detailed observations in different growth stages. This<br />
synthetic route requires no templates, catalysts, or organic<br />
reagents, which promises large-scale production <strong>of</strong> nanostructured<br />
MnO 2 with controlled structure <strong>and</strong> size.<br />
2. Experimental procedure<br />
All the chemicals used in this experiment were <strong>of</strong> analytical<br />
grade from Sigma–Aldrich Company <strong>and</strong> used without further<br />
purification. In a typical synthesis, 1.5 mmol <strong>of</strong> KMnO4 was added<br />
to 20 ml deionized water to form a homogeneous solution. 0.5 ml<br />
<strong>of</strong> HCl (37 wt.%) was then added dropwise into the solution under<br />
magnetic stirring. After stirring for 20 min, the obtained solution<br />
was transferred to a 100 ml Teflon-lined ceramic-walled vessel.<br />
The autoclave was sealed <strong>and</strong> heated to different reaction temperatures<br />
(100, 140, <strong>and</strong> 180 °C) with the same holding time <strong>of</strong> 25 min<br />
in an Anton Paar Synthos 3000 microwave synthesis system. After<br />
the autoclave was cooled down to room temperature, the sample<br />
was collected by centrifugation <strong>and</strong> washed with deionized water<br />
<strong>and</strong> absolute ethanol several times to remove the impurities, <strong>and</strong><br />
dried in air at 80 °C for 12 h.<br />
The powder X-ray diffraction (XRD) patterns were recorded by a<br />
Inel multipurpose diffractometer (MPD) system with CuKa radiation<br />
(k = 1.54060 Å) operated at 30 kV <strong>and</strong> 20 mA. The morphology<br />
<strong>of</strong> the synthesized samples was determined by a Hitachi S-4800<br />
field emission scanning electron microscope (FESEM) operated at<br />
5 kV. Transmission electron microscopy (TEM) images were taken<br />
by a Philips CM 10 microscope operated at 80 kV. High-resolution<br />
transmission electron microscopy (HRTEM) <strong>and</strong> selected area electron<br />
diffraction (SAED) were characterized by a JEOL 2010 FEG<br />
microscope operated at 200 kV. Fourier transform-infrared<br />
(FT-IR) measurements were carried out by the KBr method using<br />
a Nicolet 6700 FT-IR spectrometer. FT-IR spectra were recorded<br />
in the transmittance mode over the range <strong>of</strong> 400–4000 cm 1 by<br />
averaging 16 scans at a resolution <strong>of</strong> 4 cm 1 . Raman scattering<br />
(RS) spectra were collected on a HORIBA Scientific LabRAM HR Raman<br />
spectrometer system equipped with a 532 nm laser. A laser<br />
energy filter value <strong>of</strong> 2 was applied, which prevents decomposition<br />
<strong>of</strong> the samples. The spectra were taken between 100 <strong>and</strong><br />
1000 cm 1 in a backscattering configuration at room temperature.<br />
3. Results <strong>and</strong> discussion<br />
3.1. Structure <strong>and</strong> morphology characterization<br />
The phase purity <strong>and</strong> crystal structure <strong>of</strong> MnO2 were examined<br />
by XRD. Different crystal structures can be achieved by controlling<br />
the reaction temperatures. As shown in Fig. 1a, all the diffraction<br />
peaks <strong>of</strong> the XRD pattern for the sample prepared at 100 °C can<br />
be indexed to the birnessite-type MnO2 (JCPDS No. 80-1098),<br />
which has a lamellar structure <strong>and</strong> the interlayer distance <strong>of</strong><br />
MnO6 octahedra layers is 0.73 nm. The broaden peaks with low<br />
intensity observed in XRD pattern suggest that the sample is in<br />
poor crystalline state with a short-range crystal form. In particular,<br />
the relative intensities <strong>of</strong> the (001) planes are lower than those in<br />
the st<strong>and</strong>ard JCPDS data, which suggests that the layers <strong>of</strong> MnO6<br />
octahedra are not perfectly oriented [32]. In contrast, the sample<br />
prepared at 140 °C (Fig. 1b) can be attributed to the tetragonal<br />
phase a-MnO 2 (JCPDS No. 44-0141), <strong>and</strong> the XRD pattern with<br />
sharp <strong>and</strong> intense peaks indicates a good crystallinity for the a-<br />
MnO 2.<br />
Fig. 1. XRD patterns <strong>of</strong> the products prepared at (a) 100 °C <strong>and</strong> (b) 140 °C in 25 min.<br />
MnO2 with different crystal structures exhibited significantly<br />
different morphologies. Fig. 2 shows the SEM images <strong>of</strong> birnessite-type<br />
<strong>and</strong> a-MnO2. As shown in Fig. 2a, the birnessite-type<br />
MnO 2 sample is composed <strong>of</strong> uniform flower-like microsphere<br />
nanostructures with a diameter <strong>of</strong> 200–400 nm. The high-magnification<br />
images reveal that the microsphere consists <strong>of</strong> crumpled<br />
nanosheets about 10 nm in thickness (Fig. 2b). By comparison,<br />
the a-MnO 2 shows typical fibrous shape nanostructures with a<br />
length <strong>of</strong> 2–6 lm (Fig. 2c). The images at higher magnification<br />
(Fig. 2d) reveal that they have tubular structures <strong>and</strong> the diameter<br />
is about 100 nm.<br />
The interior structure <strong>of</strong> the flower-like microsphere nanostructures<br />
was further characterized by TEM <strong>and</strong> HRTEM. Fig. 3a shows<br />
core-corona architecture <strong>of</strong> the birnessite-type MnO2, which is<br />
similar to the previous report [33]. From the TEM image, it can<br />
be seen clearly that the nanosheets in the corona are grown perpendicularly/parallel<br />
from the core. The selected area electron diffraction<br />
(SAED) pattern (inset in Fig. 3a) <strong>of</strong> a typical microsphere<br />
indicates that it is polycrystalline. The HRTEM image (Fig. 3b) indicates<br />
that the corona is composed <strong>of</strong> thin sheets crystallized in the<br />
birnessite structure with a d-spacing about 0.6 nm. The distance is<br />
lower than the d-spacing between the (001) planes (0.73 nm),<br />
which is due to the dehydrating under the electron beam. It is noticed<br />
that the distance between nanosheets is not even <strong>and</strong> there<br />
are some dislocations along the nanosheet direction (red 1 dash circle<br />
in Fig. 3b), indicating the poor orientation <strong>of</strong> the (001) planes,<br />
which agrees with the XRD result.<br />
Fig. 3c <strong>and</strong> d show the TEM <strong>and</strong> HRTEM images <strong>of</strong> the a-MnO2<br />
nanotube structures. As shown in Fig. 3c, the a-MnO 2 nanotubes<br />
have relatively uniform outer diameters ranging between 80 <strong>and</strong><br />
100 nm, <strong>and</strong> the wall thickness is about 20 nm. The SAED pattern<br />
(inset in Fig. 3c) reveals the single-crystalline nature <strong>of</strong> the<br />
a-MnO 2 nanotubes. The lattice fringes in Fig. 3d show that the<br />
interplanar distance perpendicularly to the rod axis is 0.29 nm,<br />
which agrees with the d value <strong>of</strong> (001) planes <strong>of</strong> a-MnO 2. Therefore,<br />
the nanotubes grow along the [001] direction. The TEM <strong>and</strong><br />
HRTEM results are consistent with XRD data, confirming the<br />
mono-phase <strong>and</strong> good crystallinity <strong>of</strong> the a-MnO2 nanotubes.<br />
Fourier transform-infrared (FT-IR) <strong>and</strong> Raman scattering (RS)<br />
spectroscopy have been proved to be useful alternatives <strong>and</strong>/or<br />
supplements to X-ray diffraction for structural characterizations<br />
<strong>of</strong> materials [34]. Because they are sensitive to crystalline disorders<br />
as well as different local structural properties, FT-IR <strong>and</strong> RS<br />
1<br />
For interpretation <strong>of</strong> color in Figs. 1, 4–6, the reader is referred to the web version<br />
<strong>of</strong> this article.
spectroscopy can yield more complete <strong>and</strong> reliable description <strong>of</strong><br />
materials, <strong>and</strong> further confirm our samples.<br />
The FT-IR spectra <strong>of</strong> the samples are shown in Fig. 4A. From the<br />
spectra results <strong>of</strong> as-prepared samples, it can be observed that a<br />
Y. Li et al. / <strong>Journal</strong> <strong>of</strong> <strong>Colloid</strong> <strong>and</strong> <strong>Interface</strong> <strong>Science</strong> 369 (2012) 123–128 125<br />
Fig. 2. SEM images <strong>of</strong> the products prepared at (a <strong>and</strong> b) 100 °C <strong>and</strong> (c <strong>and</strong> d) 140 °C in 25 min. The insets <strong>of</strong> a <strong>and</strong> c are the lower magnification images.<br />
Fig. 3. TEM (a <strong>and</strong> c) <strong>and</strong> HRTEM (b <strong>and</strong> d) images <strong>of</strong> the products prepared at (a <strong>and</strong> b) 100 °C <strong>and</strong> (c <strong>and</strong> d) 140 °C in 25 min. The insets <strong>of</strong> a <strong>and</strong> c show the corresponding<br />
SAED patterns.<br />
broadb<strong>and</strong> appears at around 3442 cm 1 for both samples, which<br />
is caused by the absorbent <strong>of</strong> interlayer hydrates <strong>and</strong> some hydroxyl<br />
groups not from hydrates but those directly bound to the interlayer<br />
metal ions. And the b<strong>and</strong>s at 1635 <strong>and</strong> 1385 cm 1 represent
126 Y. Li et al. / <strong>Journal</strong> <strong>of</strong> <strong>Colloid</strong> <strong>and</strong> <strong>Interface</strong> <strong>Science</strong> 369 (2012) 123–128<br />
Fig. 4. FT-IR spectra (A) <strong>and</strong> Raman scattering spectra (B) <strong>of</strong> the products prepared at (a) 100 °C <strong>and</strong> (b) 140 °C in 25 min.<br />
the vibration due to the interaction <strong>of</strong> Mn with surrounding species,<br />
such as OH, O, H + , <strong>and</strong> K + . The water molecules or cations<br />
intercalated into the MnO 2 interlayer or tunnels were introduced<br />
during the synthesis to build/maintain the structures [35]. It has<br />
been reported that in hydrous MnO 2 samples, the peaks appear<br />
at 1620 <strong>and</strong> 1280 cm 1 [36]. The high frequency shift in our case<br />
reveals the strongly bonded nature [37]. The FT-IR spectra results<br />
in the region <strong>of</strong> 800–400 cm 1 reveal information about MnO6<br />
octahedra (inset in Fig. 4A). A major difference between the two<br />
kinds <strong>of</strong> samples has been witnessed in this region. For birnessite-type<br />
MnO 2, a broadb<strong>and</strong> is present at 514 cm 1 while four<br />
weak b<strong>and</strong>s are recorded at 668, 456, 434 <strong>and</strong> 416 cm 1 , respectively.<br />
The results are different from that <strong>of</strong> literatures, viz. the<br />
b<strong>and</strong> at 635, 583, 513, 477, <strong>and</strong> 423 cm 1 , respectively [38]. Especially,<br />
the b<strong>and</strong> at 423 cm 1 indicates the crystalline order <strong>of</strong> the<br />
birnessite compound [34]. The distortion <strong>of</strong> MnO6 octahedra is<br />
due to the constitutional water in the sample [37]. Obvious differences<br />
can be observed for a-MnO2. Two dominant b<strong>and</strong>s at 524<br />
<strong>and</strong> 466 cm 1 <strong>and</strong> five weak b<strong>and</strong>s at 720, 668, 636, 431, <strong>and</strong><br />
416 cm 1 are recorded, which are similar to those previously<br />
reported for a-MnO 2 materials [39].<br />
Fig. 4B shows the Raman spectra <strong>of</strong> birnessite-type <strong>and</strong><br />
a-MnO 2. Three main contributions at 506, 565, <strong>and</strong> 648 cm 1 are<br />
detected for the birnessite-type MnO2. The Raman b<strong>and</strong> at<br />
648 cm 1 can be viewed as the symmetric m2(Mn–O) stretching<br />
vibration <strong>of</strong> MnO6 groups, <strong>and</strong> the b<strong>and</strong> at 565 cm 1 is attributed<br />
to the m3(Mn–O) stretching vibration in the basal plane <strong>of</strong> MnO6<br />
sheets [40]. The m3(Mn–O) stretching frequency presents a shift<br />
<strong>of</strong> 10 cm 1 toward the low-frequency side, which is attributed to<br />
the defect chemistry <strong>and</strong> the local disorder <strong>of</strong> the as-prepared<br />
birnessite structure [34]. The Raman spectrum <strong>of</strong> a-MnO2 nanotubes<br />
has several contributions at 180, 380, 483, 570, <strong>and</strong><br />
635 cm 1 . The low-frequency Raman b<strong>and</strong> at 180 cm 1 is assigned<br />
to an external vibration that due to the translational motion <strong>of</strong> the<br />
MnO6 octahedra, while the Raman b<strong>and</strong> at 380 cm 1 is caused by<br />
the Mn–O bending vibrations. It is emphasized that the relative<br />
intensities <strong>of</strong> two high-frequency Raman b<strong>and</strong>s at 570 <strong>and</strong><br />
635 cm 1 are correlated to the nature <strong>of</strong> the tunnel species [39].<br />
Hence, the spectrum reflects the good crystallinity <strong>of</strong> the<br />
a-MnO 2, which is in agreement with the structural studies reported<br />
above.<br />
3.2. Growth mechanisms <strong>of</strong> MnO2 nanostructures<br />
The formation mechanism <strong>of</strong> the flower-like MnO2 microspheres<br />
has been widely accepted in the previous report for hydro-<br />
thermal method [41]. We believe that the microwave-assisted<br />
hydrothermal method has a similar mechanism. In brief, firstly,<br />
large amount <strong>of</strong> nuclei form rapidly in a short time <strong>and</strong> then<br />
self-assembly to form amorphous spheres. During the hydrothermal<br />
process, an Ostwald ripening process is carried out, in which<br />
smaller particles dissolve while the bigger ones grow into sheetlike<br />
particles with a lamellar structure. Finally, the sheet-like particles<br />
tend to curl <strong>and</strong> assembly to form a core-corona hierarchical<br />
structure.<br />
By contrast, several models have been suggested in terms <strong>of</strong> the<br />
formation <strong>of</strong> metal or metal oxide nanotubes in a solution-based<br />
process. Ye et al. proposed a curving followed by seaming <strong>of</strong><br />
molecular layers mechanism for the tube-formation process <strong>of</strong><br />
materials with layered structure [42]. Mo et al. suggested a template-roll-growth<br />
<strong>and</strong> template-twist-join-growth mechanism for<br />
the formation <strong>of</strong> Te nanotubes [43]. Wang <strong>and</strong> Li proposed a rolling<br />
mechanism for the conversion from MnO 2 nanosheets to nanotubes<br />
[28]. Luo et al. proposed a tip-/end-etching process for the formation<br />
<strong>of</strong> MnO 2 nanotubes [44]. However, no evidence is shown to support<br />
these hypotheses in our system.<br />
The reaction in our process could be described as follows:<br />
Half reaction:<br />
2Cl ! Cl2 þ 2e ðE 0 ¼ 1:3595 VÞ<br />
MnO 4 þ 4H þ þ 3e ! MnO2 þ 2H2O ðE 0 ¼þ1:695 VÞ<br />
Overall reaction:<br />
2MnO 4 þ 8H þ þ 6Cl () 2MnO2 þ 3Cl2 þ 4H2O<br />
To underst<strong>and</strong> the formation <strong>of</strong> the a-MnO2 nanotubes, the<br />
reaction under different periods <strong>of</strong> time was investigated. Fig. 5<br />
shows the TEM images <strong>of</strong> three samples taken at different stages<br />
<strong>of</strong> the reaction. When the reaction proceeded for 5 min, some<br />
microspheres with core-corona architecture were produced with<br />
a diameter about 1 lm, <strong>and</strong> the thickness <strong>of</strong> nanosheets is about<br />
10 nm (Fig. 5a). After 10 min, the microspheres tended to collapse<br />
<strong>and</strong> some fibrous structures formed. From Fig. 5b, it can be seen<br />
that three different types <strong>of</strong> fibrous structures formed: nanorod<br />
with a diameter about 20 nm (Fig. 5d); bundle-like tube with a<br />
diameter about 50 nm (Fig. 5e); <strong>and</strong> nanotube with a diameter<br />
about 80 nm (Fig. 5f). As shown in Fig. 5e, the bundle-like tube consists<br />
<strong>of</strong> nanorods about 16 nm in diameter, which is consistent to<br />
the diameter <strong>of</strong> the single nanorod in Fig. 5d. Fig. 5f shows that<br />
the nanotube has smooth surface but an uneven end, <strong>and</strong> the wall
thickness is about 20 nm. When the reaction time was prolonged<br />
to 25 min, the nanotubes with a diameter <strong>of</strong> 80–100 nm formed<br />
in majority (>85%) (Fig. 5c).<br />
It has been reported that a-MnO 2 nanowires/nanorods tended to<br />
assemble along lateral surface <strong>and</strong> form thick nanorods through an<br />
‘‘oriented attachment’’ mechanism under the hydrothermal condition<br />
since the formation <strong>of</strong> bundles could reduce the surface-to-volume<br />
ratio <strong>and</strong> the surface energy [45–48]. The exact mechanism for<br />
the formation <strong>of</strong> tubular nanostructures in our case is still under<br />
investigation. But we believe that two mechanisms, as shown in<br />
Fig. 6, are responsible for the formation <strong>of</strong> the nanotubes: (a) a dissolution–crystallization<br />
process that converts less ordered precursors<br />
into nanorods (from nanosheets to nanorods); (b) an ‘‘oriented<br />
attachment’’ process that aggregates nanorods along the lateral<br />
faces to form tubular products. The formation process <strong>of</strong> the MnO 2<br />
nanotubes can be described as follows: At the initial stage, the 3D<br />
hierarchical architectures formed as described above; then, nanorods<br />
were produced because at higher temperatures (140 °C) thermal<br />
energy is enough to overcome the activation energy required<br />
for the conversion from nanosheets to nanorods [49]. Meanwhile,<br />
some nanorods tended to assemble along their side surfaces to reduce<br />
the surface energy. The small gaps between nanorods were<br />
filled rapidly due to coarsening during aging, which led to reconstruction<br />
<strong>of</strong> boundaries <strong>and</strong> smoothing <strong>of</strong> the surfaces. That is the<br />
reason why the nanotubes show a single-crystalline nature. Since<br />
the growth along the length direction ([001] direction) was very fast<br />
that the mass transport to the growing regions would lead to under-<br />
Y. Li et al. / <strong>Journal</strong> <strong>of</strong> <strong>Colloid</strong> <strong>and</strong> <strong>Interface</strong> <strong>Science</strong> 369 (2012) 123–128 127<br />
Fig. 5. TEM images <strong>of</strong> the products prepared in 5 min (a), 15 min (b, d, e, <strong>and</strong> f), <strong>and</strong> 25 min (c) at a reaction temperature <strong>of</strong> 140 °C.<br />
Fig. 6. Schematic illustration <strong>of</strong> the formation stages <strong>of</strong> different shapes <strong>of</strong> the<br />
MnO 2 nanostructures.<br />
saturation <strong>of</strong> reaction species in the central portions <strong>of</strong> the growing<br />
faces, {001} planes, <strong>and</strong> eventually resulted in the formation <strong>of</strong><br />
tubular structure having hollow interiors. Similar process has been<br />
observed in the formation <strong>of</strong> Te nanotubes [50]. It is necessary to
128 Y. Li et al. / <strong>Journal</strong> <strong>of</strong> <strong>Colloid</strong> <strong>and</strong> <strong>Interface</strong> <strong>Science</strong> 369 (2012) 123–128<br />
note that the dissolution–crystallization <strong>and</strong> ‘‘oriented attachment’’<br />
are two simultaneous processes in the crystal growth [51], the separated<br />
stages in Fig. 6c <strong>and</strong> d are illustrated just for the convenience<br />
<strong>of</strong> explanation. In our experiments, it was found that morphology <strong>of</strong><br />
the product prepared at 180 °C was different from that prepared at<br />
140 °C, showing a hollow needle-like structure, which was due to<br />
the fast growth rate <strong>of</strong> the nanorods at the external wall <strong>of</strong> the nanotubes<br />
(Fig. 7). This further confirms the proposed growth<br />
mechanism.<br />
4. Conclusions<br />
In summary, we report a facile microwave-assisted hydrothermal<br />
route for the synthesis <strong>of</strong> 3D hierarchical <strong>and</strong> 1D tubular<br />
MnO2 nanostructures. The crystal phase <strong>and</strong> morphology can be<br />
easily tailed by adjusting reaction temperature. The formation <strong>of</strong><br />
MnO2 nanotubes follows the dissolution–crystallization <strong>and</strong> ‘‘oriented<br />
attachment’’ process. Compared to conventional heating<br />
methods, the microwave-assisted hydrothermal approach features<br />
rapid growth <strong>of</strong> nanostructured MnO 2 with controlled structure,<br />
which is ideal for large-scale production. We believe that this study<br />
not only provides a new growth scheme <strong>of</strong> MnO 2 nanotube formation<br />
but also gives a rational strategy in synthesis <strong>and</strong> design <strong>of</strong><br />
nanomaterials with complex architecture <strong>and</strong> novel properties.<br />
Acknowledgments<br />
This research was supported by Natural <strong>Science</strong>s <strong>and</strong> <strong>Engineering</strong><br />
Research Council <strong>of</strong> Canada, Canada Research Chair Program,<br />
Canada Foundation for Innovation, Ontario Early Researcher Award<br />
<strong>and</strong> the University <strong>of</strong> <strong>Western</strong> Ontario. The authors would like to<br />
appreciate Mr. Fred Pearson at McMaster University for the fruitful<br />
discussion.<br />
References<br />
[1] Z. Li, Y. Ding, Y. Xiong, Y. Xie, Cryst. Growth Des. 5 (2005) 1953.<br />
[2] G. Ji, S. Tang, B. Xu, B. Gu, Y. Du, Chem. Phys. Lett. 379 (2003) 484.<br />
[3] S. Chou, C. Zhu, S. Neeleshwar, C. Chen, Y. Chen, C. Chen, Chem. Mater. 21<br />
(2009) 4955.<br />
[4] T. Almeida, M. Fay, Y. Zhu, P. Brown, J. Phys. Chem. C 113 (2009) 18689.<br />
[5] J. Menéndez, A. Domínguez, M. Inguanzo, J. Pis, J. Anal. Appl. Pyrol. 71 (2004) 657.<br />
[6] J. Liu, K. Li, H. Wang, M. Zhu, H. Yan, Chem. Phys. Lett. 396 (2004) 429.<br />
[7] M. Nüchter, B. Ondruschka, W. Bonrath, A. Gum, Green. Chem. 6 (2004) 128.<br />
[8] S.D. Naik, T.C. Jagadale, S.K. Apte, R.S. Sonawane, M.V. Kulkarni, S.I. Patil, S.B.<br />
Ogale, B.B. Kale, Chem. Phys. Lett. 452 (2008) 301.<br />
Fig. 7. SEM images <strong>of</strong> the product prepared at 180 °C in 25 min.<br />
[9] T. Lai, Y. Lai, J. Yu, Y. Shu, C. Wang, Mater. Res. Bull. 44 (2009) 2040.<br />
[10] A. Phuruangrat, T. Thongtem, S. Thongtem, Mater. Lett. 63 (2009) 1224.<br />
[11] H. Zhou, R. Yi, J. Li, Y. Su, X. Liu, Solid State Sci. 12 (2010) 99.<br />
[12] Y. Ma, L. Zhang, X. Cao, X. Chen, Z. Xue, Cryst. Eng. Commun. 12 (2010) 1153.<br />
[13] W. Li, Mater. Lett. 62 (2008) 4149.<br />
[14] L. Wang, C. Meng, M. Han, W. Ma, J. <strong>Colloid</strong> <strong>Interface</strong> Sci. 325 (2008) 31.<br />
[15] R. Kumar, S. Sithambaram, S. Suib, J. Catal. 262 (2009) 304.<br />
[16] A. Lima, N. Bocchi, H. Gomes, M. Teixeira, Sensors 9 (2009) 6613.<br />
[17] F. Cheng, J. Zhao, W. Song, C. Li, H. Ma, J. Chen, P. Shen, Inorg. Chem. 45 (2006)<br />
2038.<br />
[18] S. Devaraj, N. Munich<strong>and</strong>raiah, J. Phys. Chem. C 112 (2008) 4406.<br />
[19] D. Zheng, Z. Yin, W. Zhang, X. Tan, S. Sun, Cryst. Growth Des. 8 (2006) 1733.<br />
[20] G. Xi, Y. Peng, Y. Zhu, L. Xu, W. Zhang, W. Yu, Y. Qian, Mater. Res. Bull. 39<br />
(2004) 1641.<br />
[21] S. Zhu, H. Zhou, M. Hibino, I. Honma, M. Ichihara, Adv. Funct. Mater. 15 (2005)<br />
381.<br />
[22] D. Zheng, S. Sun, W. Fan, H. Yu, C. Fan, G. Cao, Z. Yin, X. Song, J. Phys. Chem. B<br />
109 (2005) 16439.<br />
[23] J. Liu, Y. Son, J. Cai, X. Shen, S. Suib, M. Aindow, Chem. Mater. 16 (2004) 276.<br />
[24] V. Subramanian, H. Zhu, B. Wei, Chem. Phys. Lett. 453 (2008) 242.<br />
[25] X. Liu, S. Fu, C. Huang, Powder Technol. 154 (2005) 120.<br />
[26] S. Kim, S. Kim, S. Oh, Chem. Mater. 11 (1999) 557.<br />
[27] R. Chen, P. Zavalij, M. Whittingham, Chem. Mater. 8 (1996) 1275.<br />
[28] X. Wang, Y. Li, Chem. Eur. J. 9 (2003) 300.<br />
[29] Y. Li, X. Li, R. He, J. Zhu, Z. Deng, J. Am. Chem. Soc. 124 (2002) 1411.<br />
[30] P. Yu, X. Zhang, D. Wang, L. Wang, Y. Ma, Cryst. Growth Des. 9 (2009) 528.<br />
[31] H. Huang, S. Sithambaram, C. Chen, C. Kithongo, L. Xu, A. Iyer, H. Garces, S. Suib,<br />
Chem. Mater. 22 (2010) 3664.<br />
[32] D. Portehault, S. Cassaignon, E. Baudrin, J.-P. Jolivet, J. Mater. Chem. 19 (2009)<br />
2407.<br />
[33] D. Portehault, S. Cassaignon, N. Nassif, E. Baudrin, J.-P. Jolivet, Adv. Mater. 47<br />
(2008) 6441.<br />
[34] C. Julien, M. Massot, C. Poinsignon, Spectrochim. Acta Part A 60 (2004) 689.<br />
[35] W. Xiao, D. Wang, X. Lou, J. Phys. Chem. C 114 (2010) 1694.<br />
[36] J. Fern<strong>and</strong>es, B. Desai, D. Kamat, Electrochim. Acta 28 (1983) 309.<br />
[37] M. Ananth, S. Pethkar, K. Dakshinamurthi, J. Power Sour. 75 (1998) 278.<br />
[38] L. Kang, M. Zhang, Z. Liu, K. Ooi, Spectrochim. Acta Part A 67 (2007) 864.<br />
[39] T. Gao, H. Fjellvåg, P. Norby, Anal. Chim. Acta 648 (2009) 235.<br />
[40] C. Julien, M. Massot, R. Baddour-Hadjean, S. Franger, S. Bach, J. Pereira-Ramos,<br />
Solid State Ionics 159 (2003) 345.<br />
[41] N. Xu, Z. Liu, X. Ma, S. Qiao, J. Yuan, J Nanopart. Res. 11 (2009) 1107.<br />
[42] C. Ye, G. Meng, Z. Jiang, Y. Wang, G. Wang, L. Zhang, J. Am. Chem. Soc. 124<br />
(2002) 15180.<br />
[43] M. Mo, J. Zeng, X. Liu, W. Yu, S. Zhang, Y. Qian, Adv. Mater. 14 (2002) 1658.<br />
[44] J. Luo, H. Zhu, H. Fan, J. Liang, H. Shi, G. Rao, J. Li, Z. Du, Z. Shen, J. Phys. Chem. C<br />
112 (2008) 12594.<br />
[45] S. Chen, J. Zhu, Q. Han, Z. Zheng, Y. Yang, X. Wang, Cryst. Growth Des. 9 (2009)<br />
4356.<br />
[46] D. Portehault, S. Cassaignon, E. Baudrin, J.-P. Jolivet, Chem. Mater. 19 (2007)<br />
5410.<br />
[47] T. Gao, M. Glerup, F. Krumeich, R. Nesper, H. Fjellvåg, P. Norby, J. Phys. Chem. C<br />
112 (2008) 13134.<br />
[48] X. Zhang, W. Yang, J. Yang, D. Evans, J. Cryst. Growth 310 (2008) 716.<br />
[49] D. Wal<strong>and</strong>a, G. Laurance, S. Donne, J. Power Sour. 139 (2005) 325.<br />
[50] B. Mayers, Y. Xia, Adv. Mater. 14 (2002) 279.<br />
[51] Y. Li, H. Tan, O. Lebedev, J. Verbeeck, E. Biermans, G. Tendeloo, B. Su, Cryst.<br />
Growth Des. 10 (2010) 2969.