Physical Modelling of the Upheaval Resistance of Buried Offshore ...
Physical Modelling of the Upheaval Resistance of Buried Offshore ...
Physical Modelling of the Upheaval Resistance of Buried Offshore ...

Create successful ePaper yourself
Turn your PDF publications into a flip-book with our unique Google optimized e-Paper software.
<strong>Physical</strong> <strong>Modelling</strong> <strong>of</strong> <strong>the</strong> <strong>Upheaval</strong> <strong>Resistance</strong> <strong>of</strong> <strong>Buried</strong> <strong>Offshore</strong><br />
Pipelines<br />
M.F.Bransby, T.A.Newson, M.C.R.Davies<br />
Department <strong>of</strong> Civil Engineering. University <strong>of</strong> Dundee, Dundee, Scotland.<br />
P.Brunning<br />
Stolt <strong>Offshore</strong>, Aberdeen, Scotland.<br />
ABSTRACT: This paper describes a programme <strong>of</strong> scaled physical model tests investigating <strong>the</strong> uplift<br />
behaviour <strong>of</strong> buried <strong>of</strong>fshore pipelines. Model tests were conducted using sand and gravel in <strong>the</strong> laboratory<br />
and in a large geotechnical centrifuge. During <strong>the</strong> tests, <strong>the</strong> resistance forces for vertical pipe pullout and <strong>the</strong><br />
mobilisation distance for peak resistance were investigated for varying model geometries and soil properties.<br />
Of particular interest were <strong>the</strong> soil deformation mechanisms observed for different soil states. Dense and loose<br />
sand samples were seen to undergo different deformation mechanisms after peak uplift load was mobilised<br />
due to volumetric response and this was reflected in <strong>the</strong> uplift forces. The effect <strong>of</strong> scaling was also<br />
investigated: results were compared for models conducted at 1g and in <strong>the</strong> centrifuge.<br />
1 INTRODUCTION<br />
<strong>Offshore</strong> oil and gas pipelines are commonly buried<br />
to provide environmental stability, <strong>the</strong>rmal<br />
insulation and mechanical protection from fishing<br />
activities. More high temperature and pressure<br />
reserves are now being transported through small<br />
diameter insulated pipes, particularly on <strong>the</strong> North<br />
Sea Continental Shelf. These pipes are frequently<br />
relatively light compared to <strong>the</strong> surrounding backfill<br />
soil and are prone to "snap" upheaval buckling on<br />
start-up due to axial forces caused by pipe heating.<br />
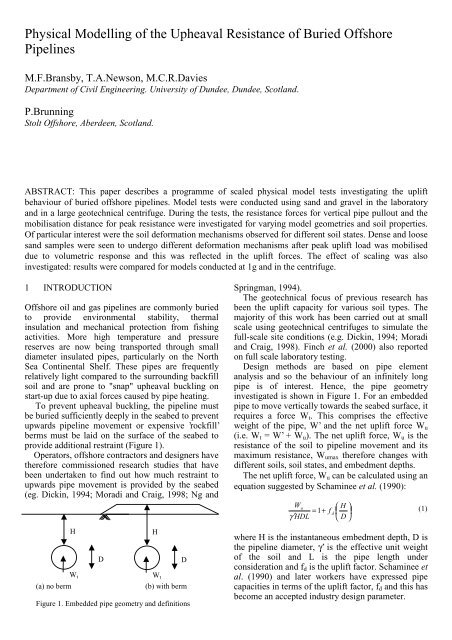
To prevent upheaval buckling, <strong>the</strong> pipeline must<br />
be buried sufficiently deeply in <strong>the</strong> seabed to prevent<br />
upwards pipeline movement or expensive ’rockfill’<br />
berms must be laid on <strong>the</strong> surface <strong>of</strong> <strong>the</strong> seabed to<br />
provide additional restraint (Figure 1).<br />
Operators, <strong>of</strong>fshore contractors and designers have<br />
<strong>the</strong>refore commissioned research studies that have<br />
been undertaken to find out how much restraint to<br />
upwards pipe movement is provided by <strong>the</strong> seabed<br />
(eg. Dickin, 1994; Moradi and Craig, 1998; Ng and<br />
Pipe<br />
H<br />
Wt<br />
Soil surface<br />
D<br />
Pipe<br />
Wt<br />
(a) no berm (b) with berm<br />
Figure 1. Embedded pipe geometry and definitions<br />
H<br />
D<br />
Springman, 1994).<br />
The geotechnical focus <strong>of</strong> previous research has<br />
been <strong>the</strong> uplift capacity for various soil types. The<br />
majority <strong>of</strong> this work has been carried out at small<br />
scale using geotechnical centrifuges to simulate <strong>the</strong><br />
full-scale site conditions (e.g. Dickin, 1994; Moradi<br />
and Craig, 1998). Finch et al. (2000) also reported<br />
on full scale laboratory testing.<br />
Design methods are based on pipe element<br />
analysis and so <strong>the</strong> behaviour <strong>of</strong> an infinitely long<br />
pipe is <strong>of</strong> interest. Hence, <strong>the</strong> pipe geometry<br />
investigated is shown in Figure 1. For an embedded<br />
pipe to move vertically towards <strong>the</strong> seabed surface, it<br />
requires a force Wt. This comprises <strong>the</strong> effective<br />
weight <strong>of</strong> <strong>the</strong> pipe, W’ and <strong>the</strong> net uplift force Wu<br />
(i.e. Wt = W’ + Wu). The net uplift force, Wu is <strong>the</strong><br />
resistance <strong>of</strong> <strong>the</strong> soil to pipeline movement and its<br />
maximum resistance, Wumax <strong>the</strong>refore changes with<br />
different soils, soil states, and embedment depths.<br />
The net uplift force, Wu can be calculated using an<br />
equation suggested by Schaminee et al. (1990):<br />
Wu<br />
⎛ H ⎞<br />
= 1+<br />
f d ⎜ ⎟<br />
γ ′ HDL ⎝ D ⎠<br />
where H is <strong>the</strong> instantaneous embedment depth, D is<br />
<strong>the</strong> pipeline diameter, γ’ is <strong>the</strong> effective unit weight<br />
<strong>of</strong> <strong>the</strong> soil and L is <strong>the</strong> pipe length under<br />
consideration and fd is <strong>the</strong> uplift factor. Schaminee et<br />
al. (1990) and later workers have expressed pipe<br />
capacities in terms <strong>of</strong> <strong>the</strong> uplift factor, fd and this has<br />
become an accepted industry design parameter.<br />
(1)
Stolt <strong>Offshore</strong> sponsored <strong>the</strong> University <strong>of</strong><br />
Dundee to undertake a research project to improve<br />
understanding <strong>of</strong> <strong>the</strong> failure mechanisms associated<br />
with pipeline uplift and <strong>the</strong> monotonic uplift<br />
resistance. This paper reports some <strong>of</strong> <strong>the</strong> model<br />
tests carried out for drained loading conditions.<br />
2 EXPERIMENTAL METHOD<br />
2.1 Test geometry<br />
Model testing was carried out both in <strong>the</strong> laboratory<br />
(at 1g) and in a 5g acceleration field in <strong>the</strong> Dundee<br />
Geotechnical centrifuge. Both series <strong>of</strong> tests<br />
consisted <strong>of</strong> <strong>the</strong> extraction <strong>of</strong> a 500 mm length <strong>of</strong><br />
pipe from a box <strong>of</strong> soil with continuous<br />
measurement <strong>of</strong> force and pipe displacement.<br />
Because both geometries modelled plane strain<br />
conditions and both pipes were rigid; results are<br />
presented later per unit length <strong>of</strong> pipe. The front face<br />
<strong>of</strong> <strong>the</strong> soil boxes were perspex and <strong>the</strong> pipe was<br />
positioned perpendicular to <strong>the</strong> perspex front face,<br />
allowing <strong>the</strong> soil (and pipe) to be observed as pullout<br />
progressed.<br />
Pipes <strong>of</strong> 32 mm and 48 mm outside diameter and<br />
length <strong>of</strong> 495 mm were tested in <strong>the</strong> laboratory,<br />
whilst pipes <strong>of</strong> diameter 48 mm and length 498 mm<br />
were tested at 5g (and 5.2g) in <strong>the</strong> geotechnical<br />
centrifuge. Scaling laws (as reported by Sch<strong>of</strong>ield,<br />
1980) ensured that <strong>the</strong> 48 mm pipe at 5g would<br />
behave as a prototype 5 times larger (i.e.<br />
D=5x48mm= 240 mm).<br />
2.2 Laboratory and centrifuge testing<br />
methodology<br />
The preparation procedures were <strong>the</strong> same for both<br />
types <strong>of</strong> tests. Sand was placed to a depth <strong>of</strong> 30-50<br />
mm in <strong>the</strong> base <strong>of</strong> <strong>the</strong> box and <strong>the</strong> pipe was<br />
positioned on <strong>the</strong> surface <strong>of</strong> <strong>the</strong> soil. The pipe was<br />
located with its ends almost in contact with <strong>the</strong> front<br />
and back perspex faces <strong>of</strong> <strong>the</strong> box (Figure 2a) and<br />
grease was pushed into <strong>the</strong> gap to prevent soil<br />
entering <strong>the</strong> gap between <strong>the</strong> pipe and <strong>the</strong> front face.<br />
Additional sand was <strong>the</strong>n added until <strong>the</strong> required<br />
pipe embedment depth was achieved. Whilst <strong>the</strong><br />
sand sample was being placed above <strong>the</strong> pipe, it was<br />
important that <strong>the</strong> pipe was free to settle vertically so<br />
that a net vertical load was not applied to <strong>the</strong> pipe<br />
before <strong>the</strong> pull-out test commenced. If this were not<br />
done, <strong>the</strong> mobilisation distance to peak load would<br />
be underestimated. During a number <strong>of</strong> <strong>the</strong> tests, a<br />
grid <strong>of</strong> black markers at approximately 50 mm<br />
centres were placed in <strong>the</strong> soil touching <strong>the</strong> perspex<br />
front face while <strong>the</strong> soil was being prepared. This<br />
allowed later photographic measurement <strong>of</strong> soil<br />
movements through <strong>the</strong> perspex front face (Figure<br />
2a).<br />
Figure 2. Testing apparatus - (a) <strong>the</strong> laboratory test<br />
apparatus (b) centrifuge model package<br />
The pipe was <strong>the</strong>n pulled out <strong>of</strong> <strong>the</strong> soil using a<br />
rigid hanger arrangement to ensure that <strong>the</strong> pipe<br />
moved with uniform displacement and vertically<br />
(Figure 2a, b). Load was measured using a load cell<br />
and displacement using a potentiometer or LVDT.<br />
This was done using an Instron device in <strong>the</strong><br />
laboratory or a specially designed actuator in <strong>the</strong><br />
centrifuge. For tests with <strong>the</strong> soil marker grids, a<br />
series <strong>of</strong> digital photographs or analogue video was<br />
taken <strong>of</strong> <strong>the</strong> front face <strong>of</strong> <strong>the</strong> box as <strong>the</strong> pipe moved<br />
towards <strong>the</strong> soil surface.<br />
Soil preparation varied depending on <strong>the</strong> required<br />
density and whe<strong>the</strong>r <strong>the</strong> soil was dry or saturated.<br />
High sand and gravel dry densities (close to ρmax)<br />
were achieved by layered compaction. Loose, dry<br />
sand was prepared by quick sand pouring. Loose,<br />
saturated sand samples were prepared by pluviating<br />
sand through air into 200 mm <strong>of</strong> water. A sand or<br />
gravel berm was constructed once <strong>the</strong> strongbox was<br />
placed on <strong>the</strong> centrifuge arm by pouring through a<br />
funnel onto <strong>the</strong> soil surface. This would have created<br />
an intermediate density berm.<br />
2.3 Programme <strong>of</strong> tests<br />
The tests reported in this paper were conducted on<br />
ei<strong>the</strong>r silica sand or gravel. The sand was uniformly<br />
graded with d50 = 0.3 mm, Gs = 2.65 and <strong>the</strong><br />
particles were subrounded. The angle <strong>of</strong> repose <strong>of</strong><br />
<strong>the</strong> loose soil was measured to be 32 o and this is<br />
believed to be close to <strong>the</strong> critical state angle <strong>of</strong><br />
friction, φcrit. The gravel was subangular with d50 = 5<br />
mm and had an angle <strong>of</strong> repose <strong>of</strong> 35 o .<br />
Model tests were conducted in loose sand in <strong>the</strong><br />
centrifuge and <strong>the</strong> laboratory. O<strong>the</strong>r variables<br />
investigated were <strong>the</strong> diameter <strong>of</strong> <strong>the</strong> pipe, its<br />
embedment ratio (H/D), whe<strong>the</strong>r <strong>the</strong> soil was dry or<br />
saturated and <strong>the</strong> presence <strong>of</strong> a berm. The series <strong>of</strong><br />
tests is summarised in Table 1.
Table 1. The series <strong>of</strong> physical model tests.<br />
Test<br />
number<br />
Test type Density<br />
(Effective soil<br />
unit weight, γ’ ,<br />
kN/m 3 )<br />
Pipe<br />
diameter<br />
D (mm)<br />
Initial<br />
embed.<br />
ratio,<br />
H/D<br />
L5 Dry sand Loose (14.5) 32 3.3<br />
L6 Dry sand Loose (14.5) 48 3.0<br />
L8 Dry sand Dense (15.5) 48 3.3<br />
L9 Dry sand Dense (15.5) 48 3.1<br />
L11 Dry sand Dense (15.5) 32 3.0<br />
L12 Dry gravel Loose (14.7) 48 3.04<br />
L13 Dry gravel Dense (15.5) 48 3.04<br />
C1 Dry sand Loose (14.5) 240* 3.1<br />
C2 Dry sand Loose (14.5) 240* 2.1<br />
C3 Dry sand Loose (14.5) 250 +<br />
3.5<br />
C4 Saturated Sand Loose (9) 250 +<br />
3.5<br />
C5 Saturated Sand Dense (10) 250 +<br />
2.3<br />
C7 Saturated sand Loose (9) 250 +<br />
2.7<br />
C8 Saturated sand +<br />
gravel berm<br />
Loose (9) 250 +<br />
2.8 + 1<br />
C9 Saturated sand +<br />
sand berm<br />
Loose (9) 250 +<br />
2.8 + 1<br />
* Pipe diameter at prototype scale (5 g centrifuge test, D = 48 mm at<br />
model scale)<br />
+<br />
Pipe diameter at prototype scale (5.2 g centrifuge test, D = 48 mm at<br />
model scale)<br />
3 EXPERIMENTAL RESULTS<br />
3.1 Typical data<br />
Typical resistance force against pipe displacement<br />
data are shown for a centrifuge test (C1) and a<br />
laboratory test (L6) in dry, loose sand in Figure 3.<br />
The centrifuge test is shown using units for <strong>the</strong><br />
equivalent full-scale prototype (pipe <strong>of</strong> prototype<br />
diameter, D = 240 mm; initial embedment ratio, H/D<br />
= 3.1; Soil density, γ = 14.2 kN/m 3 ). The results <strong>of</strong><br />
<strong>the</strong> laboratory test <strong>of</strong> a pipe <strong>of</strong> diameter 48 mm and<br />
embedment ratio, H/D = 3.0 are scaled as if <strong>the</strong> 1g<br />
test was a 1/5 th scale model.<br />
Peak uplift load is mobilised very quickly for each<br />
test and uplift resistance <strong>the</strong>n reduces as <strong>the</strong> pipe<br />
approaches <strong>the</strong> soil surface and <strong>the</strong> cover reduces.<br />
The scaled-up laboratory tests results do not agree<br />
well with <strong>the</strong> centrifuge test results suggesting that<br />
pipe diameter affects uplift capacity even for loose<br />
sand.<br />
Load, kN/m.<br />
9<br />
8<br />
7<br />
6<br />
5<br />
4<br />
3<br />
2<br />
1<br />
Centrifuge test: D = 240 mm<br />
Centrifuge test: D = 240 mm<br />
1g test: D = 48 mm<br />
1g test: D = 48 mm<br />
0<br />
0 100 200 300 400 500 600 700 800<br />
Displacement, mm<br />
Figure 3. Load-displacement data: centrifuge model test C1<br />
(H/D = 3.1) and scaled 1g test L6 (H/D = 3)<br />
Uplift factor, fd<br />
Uplift factor, fd<br />
1.4<br />
1.2<br />
1<br />
0.8<br />
0.6<br />
0.4<br />
0.2<br />
0<br />
1 1.5 2 2.5 3 3.5 4<br />
Embedment ratio, H/D<br />
Figure 4. Uplift factors for loose sand samples (laboratory<br />
and centrifuge model tests)<br />
3.2 Uplift forces<br />
3.2.1 Loose sand<br />
Figure 4 shows <strong>the</strong> results <strong>of</strong> <strong>the</strong> tests on loose sand<br />
as a plot <strong>of</strong> fd against H/D. A single data set starts<br />
on <strong>the</strong> right <strong>of</strong> <strong>the</strong> graph (at H/D ≈ 3) and <strong>the</strong>n<br />
reflects changes in fd as <strong>the</strong> pipe is pulled out and<br />
H/D reduces. There is good agreement between <strong>the</strong><br />
1g tests on 48 mm and 32 mm diameter pipes where<br />
fd ≈ 0.5 for 2 < H/D < 3. There is no peak <strong>of</strong> fd at <strong>the</strong><br />
start <strong>of</strong> movement, and so <strong>the</strong> results for a single<br />
continuous test may be representative <strong>of</strong> <strong>the</strong> peak<br />
resistance for a range <strong>of</strong> H/D. The results from<br />
centrifuge test C1 (loose sand with H/D = 3.1; D =<br />
240 mm; γ = 14.2 kN/m 3 ) gives an uplift factor, fd =<br />
0.67 at initial failure and a residual uplift factor, fd ≈<br />
0.6 for 1.5 < H/D < 3.<br />
The uplift force for loose sand may be predicted<br />
using <strong>the</strong> vertical slip surface model (Majer, 1955)<br />
and using τ = Ko γ ] WDQ φ crit on <strong>the</strong> slip surface,<br />
where Ko = 1 – sin(φ crit) is <strong>the</strong> at rest lateral earth<br />
pressure coefficient. The results using this<br />
relationship are shown in Figure 4 using φ crit = 32 o .<br />
The vertical slip surface model appears to give a<br />
slightly conservative prediction <strong>of</strong> uplift capacity for<br />
loose sand when <strong>the</strong> initial horizontal stress<br />
conditions are used.<br />
Vertical load, N/m<br />
600<br />
500<br />
400<br />
300<br />
200<br />
100<br />
Dense gravel<br />
Dense gravel sand<br />
Cover ratio, H/D<br />
‘<br />
L5 (D = 32 mm)<br />
L4 (D = 48 mm)<br />
L6 (D = 48 mm)<br />
Vertical slip model<br />
C1 (D = 240 mm)<br />
C3 (D = 250 mm)<br />
C4 (D = 250 mm)<br />
C7 (D = 250 mm)<br />
0<br />
0 20 40 60 80 100 120 140<br />
Upwards displacement, mm<br />
L9: dense sand<br />
L13: dense gravel<br />
L6: loose sand<br />
Figure 5. Load-displacement response <strong>of</strong> 48 mm pipes in<br />
dense sand and gravel.
Uplift factor, fd<br />
Uplift factor, fd<br />
Uplift factor, fd<br />
2<br />
1.8<br />
1.6<br />
1.4<br />
1.2<br />
1<br />
0.8<br />
0.6<br />
0.4<br />
0.2<br />
C5 (dense sand)<br />
L5 (D = 32 mm) L6 (D = 48 mm)<br />
C3 (D = 250 mm) C5 (D = 250 mm)<br />
L8 (D = 48 mm) L13 (D = 48 mm)<br />
L12 (D = 48 mm)<br />
L13 (dense gravel)<br />
L8 (dense<br />
sand)<br />
0<br />
1 1.5 2 2.5 3<br />
Embedment Cover ratio, ratio, H/D H/D<br />
3.5 4<br />
Figure 6. Uplift factors for 1g tests in dense sand and gravel.<br />
3.2.2 Dense sand and gravel<br />
Load-displacement plots are shown for <strong>the</strong><br />
laboratory tests in dense and loose sand and dense<br />
gravel in Figure 5. Tests were conducted with a pipe<br />
<strong>of</strong> diameter, D = 48 mm and an initial embedment<br />
ratio, H/D ≈ 3. There is a clear difference compared<br />
to <strong>the</strong> loose sand tests, with a peak uplift resistance,<br />
which drops quickly by half to a residual pull-out<br />
force. This residual force <strong>the</strong>n reduces as <strong>the</strong> pipe<br />
moves towards <strong>the</strong> surface. The pattern is reflected<br />
in <strong>the</strong> uplift factors (Figure 6). A peak uplift factor<br />
(fd ≥ 1) on initial movement <strong>the</strong>n reduces to values<br />
similar to <strong>the</strong> loose sample after a small pipe<br />
displacement. For <strong>the</strong> sand, <strong>the</strong> distance required to<br />
reach <strong>the</strong> residual value <strong>of</strong> fd is 5 mm, for gravel, it<br />
is 15 mm (see Figure 5). Fur<strong>the</strong>r experiments are<br />
needed to examine this behaviour for a wider range<br />
<strong>of</strong> H/D and soil types.<br />
3.2.3 Sand and gravel berms<br />
Uplift factors are shown against reducing<br />
embedment ratio for <strong>the</strong> tests with and without<br />
gravel or sand berms on loose, saturated sand in<br />
Figure 7. There is a clear increase in uplift resistance<br />
with ei<strong>the</strong>r a gravel or sand berm, but this is more<br />
marked with <strong>the</strong> gravel berm. Indeed, <strong>the</strong> increase in<br />
uplift resistance due to <strong>the</strong> gravel berm compared to<br />
pure loose sand increases with <strong>the</strong> displacement <strong>of</strong><br />
<strong>the</strong> pipe. This may be due to <strong>the</strong> rising soil surface<br />
due to <strong>the</strong> dilation <strong>of</strong> <strong>the</strong> angular gravel berm during<br />
pipe displacement, which ensures that <strong>the</strong> pipe burial<br />
is greater than calculated assuming H = Hi - δ.<br />
Uplift factor, fd<br />
2<br />
1.8<br />
1.6<br />
1.4<br />
1.2<br />
1<br />
0.8<br />
0.6<br />
0.4<br />
0.2<br />
Vertical slip model<br />
C4 (sand)<br />
C7 (sand)<br />
C8 (gravel berm)<br />
C9 (sand berm)<br />
0<br />
1 1.5 2 2.5 3 3.5 4 4.5<br />
3.3 Mobilisation <strong>of</strong> peak uplift load: initial loaddisplacement<br />
response<br />
3.3.1 Loose sand<br />
The initial load-displacement data for <strong>the</strong> tests on<br />
dry loose sand are shown in Figure 8. Uplift load<br />
(Wu) is normalised by <strong>the</strong> peak uplift load (Wumax)<br />
for each model test to allow comparison <strong>of</strong><br />
mobilisation distances. For <strong>the</strong> laboratory tests<br />
(when D = 32 mm or 48 mm), 90 % <strong>of</strong> peak uplift<br />
load was mobilised when pipe displacement, δ ≈ 0.5<br />
mm and <strong>the</strong> peak capacity was reached by about 1<br />
mm. However, <strong>the</strong> prototype displacement for 90%<br />
mobilisation in <strong>the</strong> centrifuge model tests was 3 or 4<br />
mm.<br />
If <strong>the</strong> displacement is fur<strong>the</strong>r normalised by<br />
embedment depth, H, <strong>the</strong> graph shown in Figure 9 is<br />
produced. There is good agreement between results<br />
for different pipe sizes in loose sand and it appears<br />
that 90% <strong>of</strong> <strong>the</strong> maximum uplift load is mobilised<br />
when δ/H ≈ 0.4 %. This agrees well with δ/H = 0.5<br />
% recommended by Matyas and Davies (1983) in<br />
<strong>the</strong>ir laboratory tests and δ/H = 1 % recommended<br />
by Trautman et al. (1985).<br />
3.3.2 Dense sand and gravel<br />
Normalised initial load-displacement behaviour from<br />
<strong>the</strong> laboratory tests in dense sand and gravel is also<br />
shown on Figure 9. Peak uplift load is mobilised<br />
within significantly smaller displacements than for<br />
loose sand. Fur<strong>the</strong>r centrifuge tests are required to<br />
ascertain how this scales with pipe size or<br />
embedment depth.<br />
Embedment Cover ratio, ratio, H/D H/D<br />
Figure 7. Uplift factors for loose, sat. sand with/without berms. Figure 9. Normalised load-displacement data.<br />
Load, Wu/Wumax.<br />
Load, Wu/Wumax.<br />
0.6<br />
L5 (D = 32mm)<br />
0.4<br />
Centrifuge tests<br />
L6 (D = 48 mm)<br />
0.2<br />
0<br />
C1 (D=48 mm)<br />
C2 (D=240 mm)<br />
-0.2<br />
0 1 2 3 4 5<br />
1<br />
0.8<br />
0.6<br />
0.4<br />
0.2<br />
-0.4<br />
0<br />
1.2<br />
1<br />
0.8<br />
1g tests<br />
Displacement, mm<br />
Figure 8. Load-displacement behaviour <strong>of</strong> pipes in loose sand<br />
L8 (dense sand)<br />
L13 (dense gravel)<br />
L6 (loose sand)<br />
C1 (loose sand)<br />
C3 (loose sand)<br />
C4 (loose sand)<br />
C7 (loose sand)<br />
C8 (gravel berm)<br />
C9 (sand berm)<br />
0 0.002 0.004 0.006 0.008 0.01 0.012 0.014<br />
Displacement/Embedment depth.
3.3.3 Rockfill berms<br />
Normalised load-displacement graphs for <strong>the</strong> loose<br />
sand with and without berms is also shown in Figure<br />
9. There is some suggestion <strong>of</strong> a slightly s<strong>of</strong>ter<br />
normalised response for <strong>the</strong> gravel and sand berms<br />
compared to tests without berms. This is likely to be<br />
because <strong>the</strong> stiffness <strong>of</strong> <strong>the</strong> soil around <strong>the</strong> pipe for<br />
<strong>the</strong> same cover (whe<strong>the</strong>r consisting <strong>of</strong> only sand, or<br />
sand plus rockfill) will not be affected by <strong>the</strong> berm<br />
material, but <strong>the</strong> uplift capacity will be increased.<br />
3.4 Soil displacement mechanisms<br />
3.4.1 Loose sand<br />
Figure 10 shows a digital photograph <strong>of</strong> <strong>the</strong> front<br />
face <strong>of</strong> <strong>the</strong> soil model after a pipe displacement <strong>of</strong><br />
δ/D ≈ 1.3 through loose sand in <strong>the</strong> laboratory. The<br />
initial embedment ratio, H/D = 3 and <strong>the</strong> embedment<br />
ratio when <strong>the</strong> photograph was taken was H/D ≈ 1.7.<br />
There appears to be negligible surface soil<br />
movement and only <strong>the</strong> two markers above <strong>the</strong> pipe<br />
appear to have moved (about 1/10 th <strong>of</strong> <strong>the</strong> pipe<br />
displacement) from <strong>the</strong>ir initial grid position.<br />
In all tests, a gap formed between <strong>the</strong> soil and pipe<br />
with sides <strong>of</strong> angle ≈ 30 o and this remained at a<br />
constant size after initial formation. To sustain <strong>the</strong><br />
constant gap size with <strong>the</strong> upward moving pipe <strong>the</strong>re<br />
was flow <strong>of</strong> soil around <strong>the</strong> pipe as sketched in<br />
Figure 10. During centrifuge test 2 (C2) <strong>the</strong>re<br />
appeared to be some upwards movement <strong>of</strong> <strong>the</strong> soil<br />
surface as well as gapping beneath <strong>the</strong> pipe, but<br />
again <strong>the</strong>re is negligible movement <strong>of</strong> soil markers<br />
to <strong>the</strong> sides <strong>of</strong> <strong>the</strong> pipe.<br />
3.4.2 Dense sand sample<br />
Observed dense sand movements showed gapping<br />
behind <strong>the</strong> pipe <strong>of</strong> a similar size to <strong>the</strong> loose samples<br />
but <strong>the</strong>re was a larger region <strong>of</strong> soil deforming above<br />
<strong>the</strong> pipe toge<strong>the</strong>r with more surface movement<br />
(Fig.11). The top layer <strong>of</strong> marker pellets in Figure 11<br />
(which were initially in a horizontal line) show that<br />
<strong>the</strong> soil moves upwards in a region about 2D wide<br />
near <strong>the</strong> surface. In addition, soil flowed around <strong>the</strong><br />
pipe to maintain <strong>the</strong> gap at a constant size.<br />
Figure 10. Laboratory test in loose sand.<br />
Soil<br />
Gap<br />
Initial<br />
pipe<br />
position<br />
Gap<br />
Figure 11. Laboratory test in dense sand.<br />
3.4.3 Berms<br />
Soil displacements as <strong>the</strong> pipe approaches <strong>the</strong> soil<br />
surface (Figure 12) reveal that <strong>the</strong>re is more<br />
distortion <strong>of</strong> <strong>the</strong> top soil surface and <strong>the</strong> gravel/sand<br />
interface with a gravel berm than for <strong>the</strong> equivalent<br />
sand only tests (Figure 10). This suggests that <strong>the</strong><br />
berm may be dilating during initial pipe<br />
displacement and this may contribute towards <strong>the</strong><br />
higher uplift resistance. Details <strong>of</strong> this mechanism<br />
need to be confirmed by fur<strong>the</strong>r study.<br />
4 DISCUSSION<br />
Marker<br />
displacements<br />
Gap<br />
Initial<br />
pipe<br />
position<br />
Uplift load and mobilisation distance to peak are<br />
dependent on <strong>the</strong> soil properties, <strong>the</strong> pipe geometry<br />
and <strong>the</strong> soil deformation mechanism. The digital<br />
photography <strong>of</strong> <strong>the</strong> markers in <strong>the</strong> soil during pipe<br />
uplift tests has allowed determination <strong>of</strong> soil<br />
deformation mechanisms after failure. However,<br />
because full load is mobilised within a model<br />
displacement <strong>of</strong> less than 1 mm, <strong>the</strong> mechanism <strong>of</strong><br />
initial load pick-up is harder to measure visually due<br />
to <strong>the</strong> small soil displacements.<br />
Post-peak deformation mechanisms suggest that<br />
soil flow around <strong>the</strong> pipe is a large component <strong>of</strong> <strong>the</strong><br />
soil deformation because <strong>of</strong> a constant volume gap<br />
behind <strong>the</strong> pipe. This is very different from <strong>the</strong><br />
mechanism proposed by Majer (1955). For dense<br />
sand, <strong>the</strong> increasing soil volume due to dilation<br />
causes soil displacements somewhat similar to <strong>the</strong><br />
vertical slip plane model (Majer, 1955) which extend<br />
towards <strong>the</strong> soil surface.<br />
The peak uplift load, however, is mobilised while<br />
<strong>the</strong> gap is being formed (when <strong>the</strong>re are only small<br />
displacements). This appears to be a process which<br />
requires a mobilisation distance which scales with<br />
embedment depth (H) (see Figure 9) as confirmed by<br />
Bransby et al. (2001). This suggests that for <strong>the</strong> soil<br />
conditions and embedment ratios tested, <strong>the</strong> peak<br />
uplift force is not generated by <strong>the</strong> formation <strong>of</strong> a<br />
discrete slip plane because <strong>the</strong> mobilisation distance<br />
<strong>of</strong> a slip plane would depend on soil particle size
Gravel<br />
berm<br />
Loose<br />
sand<br />
Pipe<br />
(a) (b)<br />
Figure 12. Soil deformation: loose sand with gravel berm<br />
(C8) at different stages <strong>of</strong> <strong>the</strong> test.<br />
ra<strong>the</strong>r than <strong>the</strong> pipe diameter/embedment. The<br />
mobilised displacement ratios to peak load, δ/H ≈<br />
0.5 % and <strong>the</strong>se agree well with previous workers<br />
(eg. Matyas and Davis, 1983; Trautmann et al.,<br />
1985).<br />
As shown earlier, <strong>the</strong> uplift force for loose sand<br />
may be predicted conservatively using <strong>the</strong> vertical<br />
slip surface model (Majer; 1955) and using φ RQ WKH<br />
slip surface, and Ko = 1 – sin(φ WKH DW UHVW ODWHUDO<br />
earth pressure coefficient (Figure 4) despite <strong>the</strong><br />
different post-failure mechanism observed. The<br />
load-displacement response for <strong>the</strong> dense sand and<br />
gravel shows a peak uplift resistance before <strong>the</strong><br />
uplift resistance reduces to a residual value similar to<br />
<strong>the</strong> values for a loose sand. The dense soil sample is<br />
dilating, but <strong>the</strong>n post-peak strain s<strong>of</strong>tening reduces<br />
<strong>the</strong> mobilised angle <strong>of</strong> friction to φ’ as for <strong>the</strong> loose<br />
sand tests.<br />
5 SUMMARY AND CONCLUSIONS<br />
Tests have been carried out to study <strong>the</strong> uplift<br />
behaviour <strong>of</strong> pipelines in <strong>the</strong> laboratory and <strong>the</strong><br />
geotechnical centrifuge. The pipes were <strong>of</strong> prototype<br />
diameter 32 mm, 48 mm, 240 mm and 250 mm and<br />
soil conditions consisted <strong>of</strong> dry, loose or dense sand<br />
or gravel with or without a berm.<br />
Uplift factors are presented for <strong>the</strong> tests. Loose<br />
sand gave fd ≈ 0.5. Dense sand and gravel gave a<br />
peak uplift factor, fd > 1 on initial loading, but this<br />
reduced to a residual value, fd ≈ 0.6 after a<br />
displacement that may be proportional to <strong>the</strong><br />
diameter <strong>of</strong> <strong>the</strong> soil particles. For design, it is<br />
<strong>the</strong>refore important to ei<strong>the</strong>r know <strong>the</strong> density <strong>of</strong> <strong>the</strong><br />
seabed or o<strong>the</strong>rwise use a conservative uplift factor.<br />
The load-displacement behaviour <strong>of</strong> <strong>the</strong> pipes<br />
shows <strong>the</strong> displacement required to mobilise full soil<br />
resistance, δ/H ≈ 0.4 % for all loose sand tests. Peak<br />
load is mobilised more quickly in dense soil (δ/H ≈<br />
0.1 %).<br />
Soil deformation mechanisms were examined by<br />
taking digital photographs/video <strong>of</strong> <strong>the</strong> front face <strong>of</strong><br />
<strong>the</strong> test box. Photographs are presented which<br />
indicate soil displacement mechanisms after failure<br />
for <strong>the</strong> different soil types. These vary with initial<br />
soil density, but all included gap formation behind<br />
<strong>the</strong> pipe while <strong>the</strong> peak uplift force is being<br />
mobilised and soil flow around <strong>the</strong> pipe after failure.<br />
Results from centrifuge model tests with gravel<br />
berms showed a significant increase in uplift<br />
capacity (fd ≈ 0.8) but a less significant increase was<br />
found for sand berms. It is believed that dilation <strong>of</strong><br />
<strong>the</strong> berm during initial pipe displacement toge<strong>the</strong>r<br />
with <strong>the</strong> weight <strong>of</strong> <strong>the</strong> berm increases <strong>the</strong> uplift<br />
capacity.<br />
ACKNOWLEDGEMENTS<br />
The work described in this paper was supported by<br />
funds from Stolt <strong>Offshore</strong> and this support is<br />
gratefully acknowledged. The authors would like to<br />
thank Mr. Colin Fyfe and Dr. Shiping Yao for <strong>the</strong>ir<br />
hard work during <strong>the</strong> testing programme and to <strong>the</strong><br />
technical staff <strong>of</strong> <strong>the</strong> Department <strong>of</strong> Civil<br />
Engineering, University <strong>of</strong> Dundee for all <strong>of</strong> <strong>the</strong>ir<br />
help.<br />
REFERENCES<br />
Bransby, M.F., Newson, T.A., Brunning, P., Davies, M.C.R.<br />
(2001). Numerical and centrifuge modelling <strong>of</strong> <strong>the</strong> upheaval<br />
resistance <strong>of</strong> buried pipelines. Proc <strong>of</strong> OMAE pipeline<br />
symposium, Rio de Janeiro, June 2001.<br />
Dickin, E.A. (1994) Uplift <strong>Resistance</strong> <strong>of</strong> <strong>Buried</strong> Pipelines in<br />
Sand. Soils and Foundations, Vol.34, No.2, p 41-48.<br />
Finch. M, Fisher. R, Palmer A, and Baumgard. A, (2000). An<br />
Integrated Approach to Pipeline Burial in <strong>the</strong> 21 st Century,<br />
Deep <strong>Offshore</strong> Technology 2000.<br />
Majer, J. (1955) Zur berechnung von zugfundamenten.<br />
Osterreichister Bauzeitschift, 10, 5, p. 85-90.<br />
Matyas, E.L. & Davis, J.B. (1983) Prediction <strong>of</strong> vertical earth<br />
loads on rigid pipes. J. Geo. Eng. Div., ASCE, 109, GT2, p.<br />
190-201.<br />
Moradi, M. & Craig, W.H. (1998) Observation <strong>of</strong> <strong>Upheaval</strong><br />
Buckling <strong>of</strong> <strong>Buried</strong> Pipelines. Centrifuge 98, Kimura,<br />
Kusakabe & Takemura (eds), p 693-698.<br />
Ng, C.W.W. & Springman, S.M. (1994) Uplift <strong>Resistance</strong> <strong>of</strong><br />
<strong>Buried</strong> Pipelines in Granular Materials. Centrifuge 94, Leung,<br />
Lee& Tan (eds), p 753-758.<br />
Schaminee, P.E.L., Zorn, N.F. and Schotman, G.J.M. (1990)<br />
Soil Response for Pipeline <strong>Upheaval</strong> Buckling Analyses:<br />
Full-Scale Laboratory Tests and <strong>Modelling</strong>. OTC 6486, 22 nd<br />
Annual <strong>Offshore</strong> Technology Conference, Houston, Texas,<br />
May 7-10, 563-572.<br />
Sch<strong>of</strong>ield, A.N. (1980). Cambridge University Geotechnical<br />
Centrifuge Operations. Rankine lecture, Geotechnique 30,<br />
No. 3, pp. 227-268.<br />
Trautmann, C.H, O’Rourke, T.D. and Kulhaway, F.H. (1985)<br />
Uplift Force-Displacement Response <strong>of</strong> <strong>Buried</strong> Pipe. Journal<br />
<strong>of</strong> Geotechnical Engineering, Vol.111, No.9, p. 1061-1076.