a ChIP-Seq case study - Genomatix
a ChIP-Seq case study - Genomatix
a ChIP-Seq case study - Genomatix

You also want an ePaper? Increase the reach of your titles
YUMPU automatically turns print PDFs into web optimized ePapers that Google loves.
Correlation between different data sets<br />
PPARgamma binds to peroxisome proliferator response elements as a heterodimer with retinoic X receptor<br />
(RXR) and RXR binding sites have been found to be overrepresented in the TF analysis (see above).<br />
Therefore, it would be interesting to analyze the overlap between PPARgamma and RXR binding sites. The<br />
RXR-<strong>ChIP</strong> data are derived from the same publication and have been processed similar to the PPARgamma<br />
set.<br />
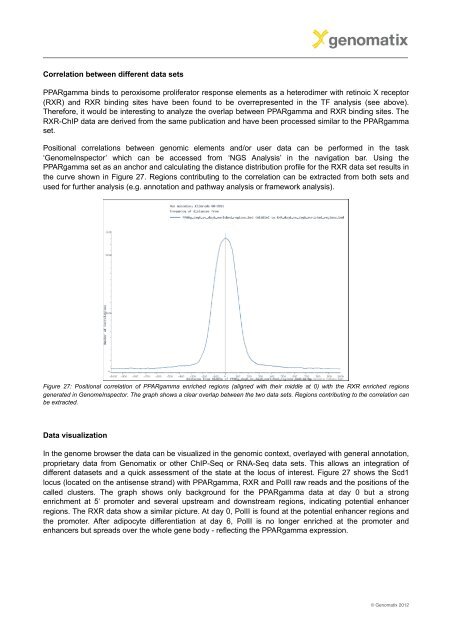
Positional correlations between genomic elements and/or user data can be performed in the task<br />
‘GenomeInspector’ which can be accessed from ‘NGS Analysis’ in the navigation bar. Using the<br />
PPARgamma set as an anchor and calculating the distance distribution profile for the RXR data set results in<br />
the curve shown in Figure 27. Regions contributing to the correlation can be extracted from both sets and<br />
used for further analysis (e.g. annotation and pathway analysis or framework analysis).<br />
Figure 27: Positional correlation of PPARgamma enriched regions (aligned with their middle at 0) with the RXR enriched regions<br />
generated in GenomeInspector. The graph shows a clear overlap between the two data sets. Regions contributing to the correlation can<br />
be extracted.<br />
Data visualization<br />
In the genome browser the data can be visualized in the genomic context, overlayed with general annotation,<br />
proprietary data from <strong>Genomatix</strong> or other <strong>ChIP</strong>-<strong>Seq</strong> or RNA-<strong>Seq</strong> data sets. This allows an integration of<br />
different datasets and a quick assessment of the state at the locus of interest. Figure 27 shows the Scd1<br />
locus (located on the antisense strand) with PPARgamma, RXR and PolII raw reads and the positions of the<br />
called clusters. The graph shows only background for the PPARgamma data at day 0 but a strong<br />
enrichment at 5‘ promoter and several upstream and downstream regions, indicating potential enhancer<br />
regions. The RXR data show a similar picture. At day 0, PolII is found at the potential enhancer regions and<br />
the promoter. After adipocyte differentiation at day 6, PolII is no longer enriched at the promoter and<br />
enhancers but spreads over the whole gene body - reflecting the PPARgamma expression.<br />
© <strong>Genomatix</strong> 2012