GfK GeoMarketing Magazine 04|2011
GfK GeoMarketing Magazine 04|2011
GfK GeoMarketing Magazine 04|2011

You also want an ePaper? Increase the reach of your titles
YUMPU automatically turns print PDFs into web optimized ePapers that Google loves.
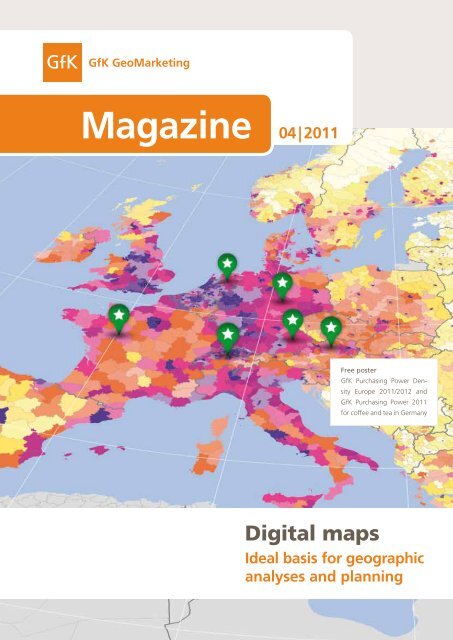
<strong>Magazine</strong><br />
04 | 2011<br />
Free poster<br />
<strong>GfK</strong> Purchasing Power Density<br />
Europe 2011/2012 and<br />
<strong>GfK</strong> Purchasing Power 2011<br />
for coffee and tea in Germany<br />
Digital maps<br />
Ideal basis for geographic<br />
analyses and planning
02 Editorial<br />
<strong>GfK</strong> <strong>GeoMarketing</strong> <strong>Magazine</strong> <strong>04|2011</strong><br />
Welcome to<br />
<strong>GfK</strong> <strong>GeoMarketing</strong> <strong>Magazine</strong>!<br />
Dear readers,<br />
2011 is rapidly drawing to a close. This is typically not<br />
a calm period for companies, as they must struggle to<br />
meet their annual turnover goals and define budgets and<br />
realistic turnover goals for the coming year. We can help<br />
you complete these tasks by showing you how to locate<br />
potential with geomarketing.<br />
We've been very busy in recent weeks and are proud to<br />
announce the completion of three important projects:<br />
<strong>GfK</strong> purchasing power data for all of Europe, maps that<br />
fits seamlessly with this data and the English-language<br />
version of RegioGraph. These tools provide everything<br />
you need to successfully position your company for 2012.<br />
This edition of the magazine explores the applications and<br />
quality requirements of our digital maps and the benefits<br />
of using postcodes for geomarketing, business and GIS<br />
analyses.<br />
I wish you a stimulating read, a successful close to 2011<br />
and a good start to 2012!<br />
Yours,<br />
Dr. Eberhard Stegner<br />
Managing director, <strong>GfK</strong> <strong>GeoMarketing</strong><br />
Contents<br />
Editorial | 02<br />
Briefly noted | 03<br />
News & dates<br />
Digital maps | 04<br />
Geomarketing: Postcodes<br />
comprise indispensable basis<br />
of planning<br />
Market data | 08<br />
Expansion planning: Data on<br />
potential provides orientation<br />
amidst unfamiliar territory<br />
Tutorial | 11<br />
Automatically updating the<br />
cartographic basis in RegioGraph<br />
Digital maps | 12<br />
Mapping the place-based<br />
component of insurance risks<br />
– interview with CRESTA<br />
User report |14<br />
CargoLine manages Europe-wide<br />
logistics network with RegioGraph<br />
User report |16<br />
RMS: Creating a wind-storm<br />
model for Europe based on<br />
<strong>GfK</strong> maps and data<br />
Webnews | 18<br />
Impressum | 18<br />
Competition | 19<br />
Briefly noted:<br />
News & dates<br />
Updated: <strong>GfK</strong> Purchasing Power<br />
Europe 2011/2012<br />
Our <strong>GfK</strong> purchasing power data for<br />
42 European countries has been updated<br />
to reflect the latest data and<br />
boundary status. The study, which<br />
also includes data on inhabitants and<br />
households down to the most detailed<br />
available regional level, reveals consumer<br />
potential at inhabitants‘ places<br />
of residence. <strong>GfK</strong> Purchasing Power is<br />
an indispensable planning basis for all<br />
internationally active companies. More<br />
information at<br />
> gfk-geomarketing.com<br />
/purchasing_power<br />
Distinguished: <strong>GfK</strong> <strong>GeoMarketing</strong><br />
named "professional service<br />
provider of the year" for the<br />
reinsurance branch<br />
<strong>GfK</strong> <strong>GeoMarketing</strong> was selected from<br />
among a range of other leading companies<br />
as the "professional service<br />
provider of the year" in the reinsurance<br />
industry at the Worldwide<br />
Reinsurance Awards in London on September<br />
7, 2011. The selection committee<br />
praised the superb quality of <strong>GfK</strong><br />
<strong>GeoMarketing</strong>‘s maps and stressed the<br />
importance of a reliable cartographic<br />
basis for the reinsurance branch. More<br />
information at<br />
> gfk-geomarketing.com/award_en<br />
New: <strong>GfK</strong> Product Catalog<br />
Information on <strong>GfK</strong> <strong>GeoMarketing</strong>‘s<br />
entire range of products can now be<br />
accessed in our new product catalog,<br />
which includes product descriptions,<br />
information on availability and prices.<br />
Access the PDF at<br />
> gfk-geomarketing.com/catalog<br />
2011<br />
<strong>GfK</strong> product catalog<br />
Digital maps | Market data | RegioGraph software<br />
Software training courses | Consultancy<br />
Meet us in person!<br />
Germany‘s Trade Convention<br />
(Deutscher Handelskongress)<br />
November 15-16, Berlin<br />
stand no. OG18<br />
DOAG 2011<br />
November 15-17,<br />
Nuremberg, Germany<br />
stand no. 222<br />
Dates of all events can be<br />
found at:<br />
> gfk-geomarketing.com/fairs
04 Digital maps<br />
Geomarketing: Postcodes comprise<br />
indispensable basis of planning<br />
Companies increasingly recognize the advantages of geographic analyses and their<br />
contributions to successful business planning. Postcode maps play a particularly<br />
important role in this regard. Good maps bring greater transparency and confidence<br />
to sales, marketing and controlling endeavors.<br />
Maps point the way to success<br />
"Geomarketing" has many names and<br />
faces including "business mapping"<br />
and "geographic market analysis" to<br />
name but a couple. Using a software<br />
application to carry out regional analyses<br />
that evaluate and visualize the<br />
place-based component of data on<br />
digital maps is now a common business<br />
practice around the world.<br />
Internationally active companies are<br />
particularly aware of the merits of a<br />
geographic analysis of their data and<br />
the resulting valuable insights. Applications<br />
of geomarketing range from<br />
the visualization of customer locations<br />
and definition of catchment areas to<br />
<strong>GfK</strong> <strong>GeoMarketing</strong> <strong>Magazine</strong> <strong>04|2011</strong><br />
5-digit postcodes for Spain<br />
the evaluation of regional turnover<br />
shares and identification and precise<br />
localization of unexploited market<br />
potential. Put simply, companies<br />
achieve greater efficiency and harness<br />
new turnover potential by carrying<br />
out regional evaluations of company<br />
activities in sales and marketing.<br />
"Maps integrated into a geomarketing<br />
software comprise one of the<br />
most important tools for meeting<br />
the needs of today's sales, marketing<br />
and controlling divisions," explains<br />
Wolfram Scholz, managing director<br />
of <strong>GfK</strong> <strong>GeoMarketing</strong>. "This is especially<br />
true of internationally active<br />
companies."<br />
Postcodes are the linchpins of most<br />
geomarketing analyses, because they<br />
link company data with maps. Addresses<br />
constitute the majority of company<br />
data, and almost every address contains<br />
a postcode.<br />
This is the reason that detailed, precise<br />
and up-to-date postcode maps<br />
are so valuable to internationally<br />
active companies. Businesses are<br />
increasingly aware of the importance<br />
of working with high-quality maps,<br />
as these are the foundation of all spatial<br />
analyses.<br />
Postcode maps serve as common<br />
international currency<br />
Postcode maps are especially important<br />
in an international business<br />
context. As almost all company data<br />
already contains postcode information,<br />
it makes sense to use postcode<br />
maps to visualize regional data trends<br />
and relationships. In contrast to place<br />
names, postcodes offer a straightforward,<br />
unambiguous means of associating<br />
data with maps. Moreover, almost<br />
all countries in the world have a postal<br />
system. Most postcodes are numberbased,<br />
although some use a combination<br />
of letters and numbers. Postcodes<br />
thus offer an unambiguous means<br />
of coding place-based information<br />
and can be directly linked with high-<br />
quality, vector-based digital maps via<br />
the (alpha-)numeric code.<br />
What makes a good postcode map?<br />
The production of precise, up-to-date<br />
and gapless postcode maps requires<br />
significant expertise and effort. To<br />
create accurate postcode maps of a<br />
given country, map producers must<br />
consult with official bureaus of statistics,<br />
post offices, government agencies,<br />
other map providers and NGOs*. <strong>GfK</strong><br />
<strong>GeoMarketing</strong>'s in-house cartography<br />
division uses this information to<br />
create detailed postcode maps. These<br />
maps are then crosschecked against<br />
satellite/aerial images.<br />
One of the greatest challenges faced<br />
by map suppliers is comprehensively<br />
digitizing all postal boundaries in a<br />
given country. Every single postcode<br />
must be precisely rendered and the<br />
boundaries of all postcodes must fit<br />
together without gaps or overlaps.<br />
Visualizing postal boundaries is particularly<br />
demanding, because only a<br />
few countries in the world have official<br />
postcode maps. As a result, cartographers<br />
must painstakingly research<br />
* non-governmental organizations<br />
<strong>GfK</strong> <strong>GeoMarketing</strong><br />
and then manually digitize these<br />
boundaries. Cartographers therefore<br />
often play the role of detectives as they<br />
piece together and compare various<br />
sources in order to accurately digitize<br />
the postal boundaries. It's also essential<br />
that these boundaries form an<br />
enclosed geography without gaps or<br />
overlaps. This applies both to boundaries<br />
within a given country as well as<br />
those in neighboring countries.<br />
Only maps that meet these quality<br />
standards are suitable for geomarketing<br />
purposes such as sales territory<br />
planning and analyzing regional turnover.<br />
Maps quickly go out-of-date due to<br />
regional forms<br />
Even maps that fulfill these standards<br />
must be regularly updated in<br />
order to ensure the accuracy of any<br />
analyses carried out with them: "An<br />
out-of-date cartographic basis leads<br />
to many problems and even outright<br />
errors," warns Klaus Dittmann, head<br />
We are the location experts!<br />
Location and real estate reports: experienced, independent, international<br />
More information at www.gfk-geomarketing.com/real_estate<br />
New 2011 map updates<br />
Europe<br />
USA/Canada<br />
Africa<br />
Mexico<br />
Australia/New Zealand<br />
Russia<br />
World<br />
Free samples available at<br />
> gfk-geomarketing.com<br />
/map_samples<br />
of cartography at <strong>GfK</strong> <strong>GeoMarketing</strong>.<br />
"For example, an accurate analysis or<br />
optimization of a transport network<br />
requires up-to-date maps. Outdated<br />
map sources – such as those that<br />
don‘t reflect the many thousands<br />
of boundary changes implemented<br />
every year in Europe by the respective<br />
national postal services – can mean<br />
that data is incorrectly associated with<br />
the maps. In some cases, data can<br />
even be lost if the regions in question<br />
no longer exist." Given these require-
06 Digital maps<br />
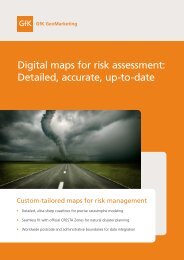
In addition to postcode and administrative maps, we<br />
also offer numerous specialty maps, including maps<br />
for the reinsurance (CRESTA) and pharmaceutical<br />
industries as well as topographic maps.<br />
Our maps are available in all common data formats<br />
and meet the highest quality standards:<br />
gapless and overlap-free<br />
vector-based for infinite zoom<br />
based on geographic coordinates (WGS 84)<br />
fully attributed with international and local place<br />
names<br />
crosschecked against the latest satellite imagery<br />
seamless fit with <strong>GfK</strong> <strong>GeoMarketing</strong>‘s market and<br />
purchasing power data<br />
informed by many years of experience and expertise<br />
regularly updated and expanded<br />
<strong>GfK</strong> <strong>GeoMarketing</strong> <strong>Magazine</strong> <strong>04|2011</strong><br />
ments, <strong>GfK</strong> <strong>GeoMarketing</strong> regularly<br />
updates all postcode and administrative<br />
maps in order to ensure that they<br />
depict the latest boundaries.<br />
Due to the expertise and effort required<br />
to carry out these regular updates,<br />
there is often a lack of good maps<br />
on the market for some countries,<br />
including – or especially – dynam-<br />
ic markets such as Asia. Companies<br />
active in these markets can benefit<br />
from <strong>GfK</strong> <strong>GeoMarketing</strong>‘s detailed<br />
postcode maps, which, in the case of<br />
Europe, are updated annually.<br />
Maps are the backbone of spatial<br />
analyses<br />
Although the production and updating<br />
of postcode maps is laborious<br />
for map suppliers, implementing<br />
these maps into company operations<br />
couldn‘t be easier. Using a good geomarketing<br />
software like RegioGraph,<br />
users can import and analyze their<br />
company data on the maps in just a<br />
few clicks.<br />
<strong>GfK</strong> <strong>GeoMarketing</strong> has a very attractive<br />
range of offerings for companies<br />
interested in taking a geomarketing<br />
approach: We offer very competitive<br />
prices and licensing models for<br />
all needs, be it for a small or large<br />
number of users, an individual country,<br />
continent or the entire world<br />
and for all standard mapping and BI<br />
systems. Irrespective of the business<br />
division or area of the world con-<br />
cerned, our maps offer a reliable basis<br />
for planning and extracting more<br />
insights from your data.<br />
We‘d be happy to assist you!<br />
Contact: Doris Steffen<br />
Tel. +49 (0)7251 9295180<br />
d.steffen@gfk-geomarketing.com<br />
We are experts in<br />
Sales territory<br />
planning<br />
Boost your sales success with <strong>GfK</strong> <strong>GeoMarketing</strong>!<br />
Increase your sales force‘s efficiency by optimizing your territory structure<br />
We support you from the planning stage to implementation<br />
Almost 20 years of worldwide experience in sales optimization<br />
www.gfk-regiograph.com/coaching_en<br />
Book a coaching session<br />
and alllow our<br />
consultants to help<br />
you define realistic<br />
goals for 2012!
08 Market data<br />
Expansion planning:<br />
Data on potential provides orientation<br />
amidst unfamiliar territory<br />
A reliable basis of planning is a prerequisite for successful expansion and the sustainable<br />
operation of branches both domestically and abroad. Regional market data comprises<br />
an indispensable basis of planning and analysis for sales and expansion endeavors. It‘s<br />
essential that this data be up-to-date and offer high-quality, gapless coverage.<br />
Location planning is one of the most<br />
expensive and risky challenges faced<br />
by companies and directly impacts<br />
future competitiveness. These decisions<br />
often entail millions of dollars of<br />
investment and determine the prospects<br />
of a company for years to come.<br />
As such, the decisions must be based<br />
on reliable data and then communicated<br />
in an objective and transparent<br />
manner.<br />
Data in <strong>GfK</strong> quality<br />
The quality of data directly influences<br />
the success of analyses and planning<br />
endeavors. All of <strong>GfK</strong> <strong>GeoMarketing</strong>‘s<br />
data has been intensively researched<br />
and validated. Thanks to the worldwide<br />
market research network of<br />
the <strong>GfK</strong> Group, we have access to an<br />
unprecedented range of international<br />
market and target group data. Our<br />
data experts use a diverse array of<br />
<strong>GfK</strong> <strong>GeoMarketing</strong> <strong>Magazine</strong> <strong>04|2011</strong><br />
rank country <strong>GfK</strong> purchasing power<br />
index per inhabitant*<br />
2 Switzerland 251.2<br />
6 Austria 158.1<br />
8 Germany 154.1<br />
*(European average = 100)<br />
techniques to model the regional distribution<br />
of this data and create an<br />
accurate portrait of the actual situation<br />
on site.<br />
The results are then examined and<br />
validated by our location experts, who<br />
have first-hand experience of locations<br />
across Europe thanks to detailed<br />
on-site studies. This expertise is taken<br />
into account in <strong>GfK</strong> <strong>GeoMarketing</strong>‘s<br />
data modeling techniques, which are<br />
continually refined to ensure the highest<br />
possible accuracy. This is essential,<br />
because on-site conditions and available<br />
data sources change from year to<br />
year - hence the importance of always<br />
working with up-to-date data. An<br />
additional advantage of working with<br />
regularly updated studies is that ever<br />
more detailed data becomes available<br />
for many locations, which can then be<br />
taken into account.<br />
Europe-wide market data<br />
<strong>GfK</strong> <strong>GeoMarketing</strong>‘s regional market<br />
data thus provides an objective<br />
decision-making basis that supports<br />
comparisons across multiple regional<br />
levels. The data offers the means of<br />
answering the following questions:<br />
How is the market potential distributed<br />
and where are the best turnover<br />
prospects for our products?<br />
Where are the intended target groups<br />
most concentrated and can they<br />
easily access the planned locations?<br />
How many locations can be successfully<br />
and sustainably operated<br />
within a given region?<br />
Which locations are most successful<br />
and offer the best future prospects?<br />
Which locations should be quickly<br />
acquired in order to ensure optimal<br />
market penetration?<br />
Detailed location comparisons<br />
<strong>GfK</strong> data on potential makes it possible<br />
to precisely gauge the quality and<br />
future prospects of locations while<br />
also facilitating comparisons between<br />
the various locations under consideration.<br />
In addition to purchasing<br />
power data, <strong>GfK</strong> <strong>GeoMarketing</strong> also<br />
offers data on the retail sector, sociodemographic<br />
characteristics, as well<br />
as information on market players and<br />
industry and business potential.<br />
The data is calculated at a detailed<br />
level (often the postcode level), which<br />
supports comparisons of locations<br />
and catchment area analyses of specific<br />
city districts.<br />
Analyzing the drawing power of<br />
potential locations<br />
The scope or drawing power of the product<br />
itself must be taken into account<br />
when evaluating prospective locations.<br />
This refers to the distance that a<br />
consumer is willing to travel to make<br />
a purchase – for example, only a few<br />
hundred meters in the case of toothbrushes.<br />
However, this could easily<br />
extend to several dozen kilometers in<br />
the case of luxury automobiles. Information<br />
from cash register surveys and<br />
customer loyalty card programs can also<br />
be useful for determining the maximum<br />
distance customers are willing to travel.<br />
The drawing power of a location is<br />
also decisive with regard to how much<br />
of the existing potential in the catchment<br />
area it can exploit. Product- and<br />
branch-specific market data are indispensable<br />
when it comes to determining<br />
the extent of this drawing power.<br />
Such analyses involve incorporating<br />
data on target groups, including their<br />
socio-demographic profile and the<br />
degree of purchasing power available<br />
for the product line in question.<br />
Macro-economic place-based factors<br />
must also be taken into account, as<br />
the success of a branch site is often<br />
strongly determined by the quality of<br />
the surrounding retail environment.<br />
Particularly important in this regard<br />
are retail turnover and centrality<br />
figures: The former reveal the region-<br />
Plan more confidently with <strong>GfK</strong> market data<br />
End-customer, retail and industry data for Germany and all of Europe<br />
Microgeographic data for precise market management<br />
All data fits seamlessly with our digital maps at every regional level<br />
www.gfk-geomarketing.com/data<br />
<strong>GfK</strong> market data available for<br />
many European countries:<br />
<strong>GfK</strong> Purchasing Power<br />
<strong>GfK</strong> Retail Purchasing Power<br />
<strong>GfK</strong> Retail Centrality<br />
<strong>GfK</strong> Retail Turnover<br />
<strong>GfK</strong> Purchasing Power<br />
for Retail Product Lines<br />
All data fits seamlessly with<br />
<strong>GfK</strong> <strong>GeoMarketing</strong>‘s digital<br />
maps. Find out more at<br />
> gfk-geomarketing.com/catalog<br />
All data is intensively researched<br />
and validated each year prior to<br />
the release of the new market<br />
studies.
Market data<br />
Market exploitation<br />
high low<br />
How far does the potential for a given location extend? Are there enough customers<br />
with sufficient purchasing power in the target catchment area or is a competitor<br />
siphoning off too much potential? An analysis of <strong>GfK</strong> market data using the gravity<br />
model in RegioGraph Strategy reveals the potential turnover reach of a given location.<br />
al turnover of the entire retail sector<br />
within a given region, while the latter<br />
measure the ability of a given retail<br />
location to draw on the purchasing<br />
power beyond its immediate borders.<br />
Agglomeration effects and competitors<br />
in the catchment area also impact<br />
the drawing power of a location. An<br />
analysis of a prospective site‘s drawing<br />
power also entails taking into account<br />
the performance data of already existing<br />
locations.<br />
<strong>GfK</strong> <strong>GeoMarketing</strong>‘s retail experts<br />
can provide companies interested in<br />
expanding with precise information<br />
on the factors that will most affect the<br />
turnover of a given location and to<br />
what degree, including the available<br />
turnover potential for each postcode<br />
and municipality under consideration.<br />
The drawing power and turnover<br />
potential of a prospective location<br />
can be modeled using detailed maps<br />
and a geomarketing solution such as<br />
RegioGraph Strategy that contains an<br />
integrated gravity model. This allows<br />
comparing the regional potential with<br />
<strong>GfK</strong> <strong>GeoMarketing</strong> <strong>Magazine</strong> <strong>04|2011</strong><br />
the competitive situation and distance<br />
to a prospective location, which<br />
reveals whether the potential available<br />
in a catchment area will lead to<br />
sustained success.<br />
A detailed analysis of the prospective<br />
locations illuminates their strengths<br />
and weaknesses, making it possible<br />
to narrow down the options under<br />
review. However, the last step of an<br />
expansion planning endeavor should<br />
always be an on-site evaluation of the<br />
locations and real estate objects under<br />
review in order to assess the quality<br />
of the micro-location and immediate<br />
surroundings. Many location-specific<br />
criteria can only be evaluated onsite<br />
by experienced professionals,<br />
including the accessibility by public<br />
transport, parking provision, visitor<br />
frequency and quality of the real<br />
estate object in question.<br />
Sales controlling: Gauging success<br />
and fine-tuning<br />
Regional data on potential and cartographic<br />
analyses also comprise the<br />
basis of measuring success after an<br />
expansion or the market launch of a<br />
product and reveal the regions and<br />
locations in need of optimization.<br />
One aspect of such analyses involves<br />
comparing the target turnover with<br />
the available market potential, which<br />
is revealed by regional market data.<br />
This makes it possible to evaluate a<br />
company‘s success and market exploitation<br />
and then make realistic plans for<br />
the subsequent phases of market development.<br />
<strong>GfK</strong> market data also helps<br />
companies answer question such as:<br />
What is the market penetration<br />
in the individual regions under<br />
review?<br />
Where are good areas for additional<br />
locations?<br />
What are realistic turnover and<br />
growth goals for the sales territories<br />
or branch sites?<br />
Summary<br />
Detailed, high-quality data on regional<br />
potential used in combination with<br />
maps and a geomarketing software<br />
such as RegioGraph allows companies<br />
to quickly and precisely determine<br />
the regions of a given country<br />
with the best turnover prospects. <strong>GfK</strong><br />
regional market data offers a reliable,<br />
Europe-wide basis of planning<br />
– from the initial planning stage and<br />
preliminary selection of suitable new<br />
locations to the detailed evaluation<br />
of economic and socio-demographic<br />
factors in selected target regions<br />
and fine-tuning of branch, sales and<br />
supply networks.<br />
We have firsthand, on-site knowledge of<br />
all European markets and can support<br />
you throughout all phases of expansion<br />
planning.<br />
We‘d be happy to assist you!<br />
Contact: Oliver Giehsel<br />
Tel. +49 (0)7251 9295165<br />
o.giehsel@gfk-geomarketing.com<br />
1<br />
2<br />
3<br />
Tutorial<br />
Automatically updating the cartographic<br />
basis in RegioGraph<br />
The previously time-consuming process of updating the cartographic basis can now be<br />
completed at the click of a button in RegioGraph 2011. It‘s therefore quick and easy to<br />
automatically update the boundary status of existing project files while preserving all<br />
settings and completed analyses. This new feature saves time and enhances productivity.<br />
Preparation<br />
After acquiring a new map update for RegioGraph, the<br />
associated layer should be imported into the map library.<br />
Next, open the project data whose maps you want to update.<br />
Execution<br />
Click the QuickStart button in the bottom left-hand corner<br />
of the project sidebar to open the Quick Start Menu. Next,<br />
select Tasks > Update Maps.<br />
3<br />
2<br />
The subsequent dialog and pull-down menus allow you<br />
to specify the layers to be updated. Go ahead and select<br />
the first layer.<br />
RegioGraph then checks whether there are maps in the<br />
map library with a more up-to-date status. Click the<br />
desired layer.<br />
Prior to beginning the update, you can specify that a<br />
backup copy be made. Start the update by clicking OK.<br />
1<br />
Results<br />
After a layer has been updated, you‘ll receive a summary that<br />
lists the changes made. Specify how you wish to proceed:<br />
You can choose to update additional layers or end the update<br />
procedure. After ending the update process, all maps contained<br />
in the project file remain unchanged, but they now<br />
contain the new postcode or municipal boundaries.<br />
Map Contents<br />
(before/after):<br />
Only the "regions"<br />
layer has been<br />
affected. All settings<br />
have been preserved.<br />
11
© <strong>GfK</strong> <strong>GeoMarketing</strong> | www.gfk-geomarketing.com | Map created with RegioGraph<br />
Purchasing power density<br />
Europe 2011/2012<br />
Purchasing power density<br />
for 2-digit postcode areas<br />
= Purchasing power in millions<br />
of € per km²<br />
>100<br />
100<br />
50<br />
20<br />
10<br />
7.5<br />
5.0<br />
4.0<br />
3.0<br />
2.0<br />
1.5<br />
1.0<br />
0.75<br />
0.50<br />
0.40<br />
0.30<br />
0.20<br />
0.15<br />
0.10<br />
0.05<br />
above average<br />
European average<br />
€ 1.23 mil. per km²<br />
below average<br />
not available
150 km<br />
<strong>GfK</strong> Purchasing Power 2011<br />
for coffee in Germany<br />
Purchasing power index<br />
per inhabitant for districts<br />
(country average = 100)<br />
up to 72<br />
72 up to 80<br />
80 up to 88<br />
88 up to 96<br />
96 up to 104<br />
104 up to 112<br />
112 up to 120<br />
120 up to 128<br />
128 and higher<br />
National border<br />
State border<br />
District border<br />
<strong>GfK</strong> Purchasing Power 2011<br />
for tea in Germany<br />
Purchasing power index<br />
per inhabitant for districts<br />
(country average = 100)<br />
up to 72<br />
72 up to 80<br />
80 up to 88<br />
88 up to 96<br />
96 up to 104<br />
104 up to 112<br />
112 up to 120<br />
120 up to 128<br />
128 and higher<br />
National border<br />
State border<br />
District border<br />
© <strong>GfK</strong> <strong>GeoMarketing</strong> | www.gfk-geomarketing.com | Map created with RegioGraph
12 Digital maps<br />
Mapping the place-based component<br />
of insurance risks<br />
CRESTA is a non-profit organization founded in 1977 by representatives of the reinsurance<br />
branch in order to establish an industry standard for the exchange of<br />
place-based information. <strong>GfK</strong> <strong>GeoMarketing</strong> has been the official map supplier of<br />
the digital maps of the worldwide CRESTA zones since 2001. Interview with Christina<br />
Schlenther (Swiss Re).<br />
CRESTA stands for „Catastrophe Risk<br />
Evaluating and Standardizing Target<br />
Accumulation“ and is the name of the<br />
organization as well as the geographic<br />
standard. The CRESTA zones provide a<br />
unified basis for the exchange of aggregated,<br />
insurance-relevant information<br />
among insurers and reinsurers.<br />
More information at www.cresta.org<br />
What are CRESTA‘s main tasks?<br />
CRESTA provides a universally recog-<br />
nized zoning standard for the insurance<br />
industry that serves as a unified<br />
geographic basis for exchanging<br />
aggregated insurance data. This promotes<br />
the accuracy and efficiency of<br />
the exchange of information among<br />
insurers and reinsurers.<br />
<strong>GfK</strong> <strong>GeoMarketing</strong> <strong>Magazine</strong> <strong>04|2011</strong><br />
There‘s a trend toward ever higher<br />
resolutions of spatial information.<br />
High-resolution postal boundaries<br />
are ideal for insurance companies,<br />
as these are typically well known in<br />
the market and accessible to all. Also,<br />
it‘s easy to aggregate postal zones if<br />
fewer zones per country are needed.<br />
Which cartographic characteristics<br />
are particularly important for these<br />
applications?<br />
Data quality plays a tremendously<br />
important role for CRESTA. The<br />
geometric data must be available<br />
worldwide and not have any gaps or<br />
overlaps. <strong>GfK</strong> <strong>GeoMarketing</strong>‘s maps<br />
offer precisely these features!<br />
The CRESTA zones are to be adjusted<br />
in 2012 – what will this entail?<br />
With this adjustment, CRESTA<br />
wants to move away from the now<br />
30-year old or even older zones that<br />
often were manually created based<br />
on risks and now had to be painstakingly<br />
re-digitized for every update.<br />
The new CRESTA zones will be<br />
based on administrative and postal<br />
boundaries, as these are generally<br />
well known and available. The future<br />
zones will be defined independently<br />
of risks. We will also offer two levels<br />
of resolution in order to best meet the<br />
needs of users: The high-resolution<br />
zones will be used as basis for the<br />
premium calculation models and the<br />
lower resolution zones will be for risk<br />
management and reporting tasks.<br />
A detailed overview of the planned<br />
changes can be accessed at<br />
> cresta.org/index.php/zone-changes<br />
We‘re proud to have been the<br />
official supplier of CRESTA maps<br />
over the past 10 years and look<br />
forward to continuing to play this<br />
role. What are the most important<br />
developments in the near feature for<br />
reinsurers?<br />
With regard to the required geographic<br />
base data, there‘s a clear trend<br />
toward high-resolution data, all the<br />
way down to coordinate-specific entries.<br />
The data quality of the underlying<br />
maps and geodata continues to<br />
play a paramount role.<br />
Christina Schlenther has been head of the CRESTA secretariat at Swiss Re since 2006.<br />
During her time in this office, the decision to revise the CRESTA zones was made as well as<br />
the preparations for the 2012 implementation. Swiss Re alternates the running of the CRESTA<br />
secretariat with Munich Re.<br />
RegioGraph 2011<br />
74 years of geomarketing expertise<br />
packed into one software<br />
1937 release of first <strong>GfK</strong> Purchasing Power dataset<br />
1957 advising of first customers in location selection<br />
1991 release of first version of RegioGraph for sales territory planning<br />
2007 complimentary data and maps added to RegioGraph<br />
RegioGraph 2011 is the crowning achievement of our expertise in<br />
sales territory planning, location selection and detailed analyses of potential.<br />
With data from<br />
With maps of Recipient of Compatible with Partner of<br />
RegioGraph – preeminent geomarketing solution for businesses. More information at www.gfk-regiograph.com.
14 User report<br />
CargoLine manages Europe-wide<br />
logistics network with RegioGraph<br />
CargoLine is a successful company group that provides standardized, systematized<br />
cargo transport and logistics services in Germany and Europe, with around<br />
70 partners throughout these regions. The company has been using RegioGraph<br />
and digital maps since 1993. Interview with Christoph Müller, head of the Europe<br />
co-ordination division.<br />
The overview map<br />
shows CargoLine‘s<br />
locations and delivery<br />
zones.<br />
<strong>GfK</strong> <strong>GeoMarketing</strong> <strong>Magazine</strong> <strong>04|2011</strong><br />
How does your business work?<br />
In the pressured time constraints of<br />
today‘s markets, companies rely upon<br />
the punctual delivery of raw materials<br />
and goods. CargoLine consequently<br />
developed a range of products to meet<br />
these needs, including numerous<br />
time-sensitive delivery methods. In<br />
association with around 70 partners<br />
in Germany and abroad, we have a<br />
stable, comprehensive network that<br />
allows us to quickly and competently<br />
make deliveries to every corner of<br />
Europe. Our expertise is not limited<br />
to conventional street- and highwaybased<br />
deliveries. Thanks to our partner<br />
network, we also offer sea and air<br />
freight services.<br />
Which challenges do our products<br />
allow you to accomplish?<br />
The most important analysis that we<br />
perform is the visualization of which<br />
partners service which territories.<br />
This ensures a fair distribution of<br />
workload within our company group.<br />
Naturally, we also visualize transport<br />
volumes and flows on the maps. One<br />
of the things we really value about<br />
RegioGraph is its ability to visualize<br />
these delivery flows according to their<br />
various assignments. Visualizing this<br />
information is essential. The logistics<br />
branch has always had an affinity for<br />
maps – wall maps that provide an<br />
overview of all locations and warehouses<br />
remain an absolute must. But<br />
just as important today is the prompt<br />
visualization of all transports, which<br />
is something that is only possible with<br />
digital maps and a software application<br />
like RegioGraph, which offers a<br />
wide range of visualization and analysis<br />
options.<br />
We also use RegioGraph for our partners‘<br />
tariff analyses. After receiving a<br />
transport query, we use the software<br />
to perform a plausibility check with<br />
regard to the distance involved and the<br />
tariff suggested by the partner. Thanks<br />
CargoLine stands for reliability and quality. The company group offers its customers<br />
a wide spectrum of services, with particular expertise in system-driven procurement<br />
and distribution logistics. A shipment tracking system that interfaces<br />
with the customer IT system and provides automatic notifications of the shipment<br />
status ensures timely service and streamlined operations. As a mid-sized company<br />
well attuned to the needs of its customers, CargoLine also develops customized<br />
logistics solutions. In 2011, 6,592 employees carried out 11.1 million shipments<br />
and achieved a turnover of €1.3 billion In the last image rankings carried out by<br />
the magazine Logistik inside, CargoLine was the only cargo and transport logistics<br />
company group that managed to place among the top 10 in the category „transport<br />
& contract logistics“. More information at www.cargoline.de<br />
to <strong>GfK</strong> <strong>GeoMarketing</strong>‘s Europe-wide<br />
maps, we can quickly determine<br />
whether, for example, the delivery<br />
tariffs of a partner in France within a<br />
specific departément are appropriate.<br />
Of course, our experience also plays a<br />
role in such evaluations, but the software<br />
and maps offer vital support and<br />
provide a reliable basis from which to<br />
make these decisions.<br />
<strong>GfK</strong> <strong>GeoMarketing</strong><br />
The data that we compile on our market,<br />
such as economic- and locationspecific<br />
information, is also very<br />
important. This allows us to always<br />
keep an eye on the economic regions<br />
in which an additional business partner<br />
or location could be beneficial in<br />
the future. In other words, we also<br />
use RegioGraph as a strategic tool for<br />
guiding our partner development.<br />
Your final word on working with<br />
digital maps and RegioGraph?<br />
To put it simply, your maps and software<br />
are essential to our daily operations.<br />
As a user of the software myself,<br />
I can tell you that I am able to work<br />
extremely well with RegioGraph.<br />
At first I had to get used to this geomarketing<br />
approach, but now I can't<br />
imagine not using it. As longstanding<br />
users of RegioGraph, we‘ve witnessed<br />
the evolution of this mapping software,<br />
which has been truly dynamic!<br />
Our partners also tremendously value<br />
the results generated by RegioGraph<br />
analyses and many of them have<br />
chosen to incorporate RegioGraph<br />
and digital maps into their own<br />
operations.<br />
Christoph Müller<br />
Tel. +49 (0)6074 850815<br />
christoph.mueller@cargoline.de<br />
Getting started with RegioGraph<br />
Master the fundamentals in just two days<br />
Numerous practice-based examples, tips and tricks<br />
Book a place on a course: www.gfk-regiograph.com/training
16<br />
User report<br />
Creating a wind-storm model for Europe<br />
based on <strong>GfK</strong> maps and data<br />
RMS is a globally leading provider of catastrophe risk management solutions. Based on<br />
<strong>GfK</strong> <strong>GeoMarketing</strong>’s maps and market data for Europa, the specialists in risk modeling<br />
developed a wind storm model for Europe. Interview with RMS´ senior risk modelers<br />
Tina Thomson and Barbara Page.<br />
You created a wind-storm model<br />
for many European countries<br />
– how does this model work?<br />
The RMS® Europe Windstorm Model<br />
helps protect households and other<br />
insured policy-holders from the risk<br />
of their insurance companies becom-<br />
ing bankrupt if a major windstorm<br />
sweeps across Europe. While some<br />
severe windstorms have been experienced<br />
in recent times, such as windstorms<br />
Daria, Vivian and Wiebke<br />
in 1990, Kyrill in 2007, and Emma<br />
in 2008, science and history show<br />
that there is a chance of even more<br />
severe storms than this occurring<br />
in the future. The model is designed<br />
to extrapolate beyond history to the<br />
worst possible storm, and capture all<br />
possible events that can happen, and<br />
how frequently these might occur.<br />
The model used scientific first principles,<br />
including meteorological forecasting<br />
models and global climate<br />
models, combined with a dense network<br />
of wind observation data, to estimate<br />
the probability of damage from a<br />
full range of possible windstorms at<br />
any location across 15 European countries.<br />
To achieve this, RMS has simulated<br />
four main model components:<br />
1) a set of around 30,000 possible<br />
windstorm events that could strike<br />
Europe; 2) a realistic meteorological<br />
model that estimates the peak winds<br />
experienced at each location through-<br />
out the duration of each of these<br />
<strong>GfK</strong> <strong>GeoMarketing</strong> <strong>Magazine</strong> <strong>04|2011</strong><br />
events, which accounts for terrain and<br />
local environmental impacts; 3) functions<br />
that relate the severity of the wind<br />
to the damage that would be sustained<br />
by building types of all different ages,<br />
shapes and sizes; 4) the financial losses<br />
that would be sustained by policy-<br />
holders and insurers.<br />
How is it set up?<br />
What is the level of detail?<br />
The key value of the model is that it<br />
provides a highly informed estimate of<br />
the damage potential across an individual<br />
insurer’s entire portfolio of risks.<br />
For very big windstorms impacting a<br />
large swath of Europe, an insurer may<br />
not have sufficient funds to pay out all<br />
its policyholders unless it knows its full<br />
exposure. The model is flexible enough<br />
to work with the information available.<br />
Where the risk is highest, and changes<br />
the most rapidly, for example around<br />
cities, or at coastlines where differences<br />
in topography and the environment<br />
can cause sudden changes<br />
in wind speeds, the model calculates<br />
each event’s peak winds for every<br />
1 km 2 grid cell. To optimize computing<br />
times, RMS uses larger cells of up to<br />
10 km 2 in areas where the risk does not<br />
change much spatially. If users know<br />
the location and physical characteristics<br />
of the individual buildings in<br />
a particular grid cell, the model can<br />
calculate expected losses for individual<br />
buildings. Conversely, the model<br />
can also use aggregated data. For<br />
example, the insurer may only know<br />
the total number of properties it<br />
insures in a particular post code, or<br />
county, along with the type of usage,<br />
for example, residential or commercial,<br />
and the total value at risk.<br />
About RMS<br />
RMS is the world’s leading provider of products, services, and expertise for<br />
catastrophe risk management. Founded in 1988, RMS offers technology and<br />
services for risks associated with natural perils such as earthquakes, hurricanes,<br />
and windstorms, as well as products for enterprise risk management<br />
and transferring insurance risk to the capital markets. RMS also leads the<br />
market in risk modeling for man-made disasters related to acts of terrorism,<br />
and infectious disease.<br />
More than 900 RMS employees serve the global financial markets from offices<br />
in the U.S., Bermuda, the U.K., France, Switzerland, China, India and Japan.<br />
More than 400 leading insurers, reinsurers, trading companies, and other<br />
financial institutions rely on RMS models to quantify, manage, and transfer risk.<br />
Which data is fed into the model?<br />
Model users – typically insurance<br />
companies (as well as reinsurers and<br />
brokers) – must input the location,<br />
value and characteristics of the buildings<br />
insured, along with the insurance<br />
policy terms, such as any excess the<br />
policyholder is liable for, before the<br />
insurance policy kicks in. To understand<br />
market-wide losses, users can<br />
input values from the RMS Industry<br />
Exposure Database.<br />
<strong>GfK</strong> <strong>GeoMarketing</strong> data was a key<br />
resource RMS used to create its Industry<br />
Exposure Database. The Industry<br />
Exposure Database is a detailed snapshot<br />
of all the insured property in<br />
every postal code in Europe. RMS<br />
uses this snapshot during the development<br />
of the windstorm model<br />
– for example to validate the model,<br />
by comparing total market losses predicted<br />
using the RMS Industry Exposure<br />
Database with the losses reported<br />
at the time of the event. The <strong>GfK</strong> data,<br />
which covers all the European countries<br />
in the RMS model, combines<br />
several key metrics of interest with<br />
consistent vintage, resolution and format<br />
geospatial reference data. RMS<br />
used demographic data on population<br />
and households, combined with consistent<br />
postal code boundary maps, to<br />
understand the location of residential<br />
properties. This is particularly useful<br />
in countries where the statistical office<br />
does not provide data with accompanying<br />
geospatial information, or to<br />
break out coarser-resolution data (for<br />
example the number of single-family<br />
dwellings by region) to a higher resolution.<br />
RMS used purchasing power to<br />
refine its valuation models – for example,<br />
in Paris purchasing power was<br />
used to differentiate between wealthy<br />
districts with high rebuild costs per<br />
square meter and poorer districts with<br />
poorer-quality, cheaper housing. In<br />
addition, the German data on number<br />
<strong>GfK</strong> Purchasing Power<br />
per inhabitant for 5-digit postcodes in €<br />
0 - 10,000<br />
10,000 - 15,000<br />
15,000 - 16,000<br />
16,000 - 17,000<br />
17,000 - 18,000<br />
highest value<br />
18,000 - 19,000<br />
19,000 - 20,000<br />
20,000 - 25,000<br />
25,000 - 30,000<br />
30,000 - 45,000<br />
lowest value<br />
In some regions of Europe, such as Paris in France, the value of insured real<br />
estate objects was found to correlate with purchasing power. The wind storm<br />
risk model uses multiple other variables to assess insured risks for a large<br />
number of storm scenarios across all of Europe, e.g., the regionalized data sets<br />
“<strong>GfK</strong> Demographics” as well as “<strong>GfK</strong> Businesses” in Germany.<br />
of businesses was helpful in understanding<br />
the geospatial distribution<br />
of insured non-residential property in<br />
Germany.<br />
How do RMS and its customers use<br />
the wind storm model?<br />
Model users only need to know the<br />
location and characteristics of property<br />
at risk, as well as the sums insured.<br />
Once this information is entered, the<br />
model can conduct analyses. Users<br />
with additional information – for<br />
example about the type of construction,<br />
policy limits and deductibles<br />
– can also input this data to assess the<br />
impact of these characteristics. Users<br />
can choose from a range of analysis<br />
types, including scenario events, such<br />
Dr. Barbara Page<br />
Dr. Marie-Kristina Thomson<br />
Risk Management Solutions, London<br />
info@rms.com | www.rms.com<br />
as “worst-case” analysis, or “what-if ”<br />
analysis – e.g., “what if windstorm<br />
XX happened tomorrow”? The real<br />
value of the model, however, stems<br />
from probabilistic analyses. Though<br />
these take more time, they give a full<br />
distribution of potential losses and<br />
the probability across an insurance<br />
company’s entire book of business.<br />
This allows an insurer to determine<br />
the probability of sustaining losses of<br />
particular amounts in any given year<br />
– for example, by calculating that<br />
while there is a 5% chance of losses<br />
totaling €300m, there is a 1% chance<br />
of a loss totaling €700m – which<br />
allows it to manage the amount of<br />
funds it keeps available for paying<br />
potential losses.
18 Webnews Competition 19<br />
Downloads & suggestions<br />
for further reading<br />
White paper:<br />
Postcode maps for Oracle<br />
What‘s the value of using digital maps<br />
to visualize and analyze data in Oracle<br />
applications? Dr. Christopher Guider,<br />
international sales and marketing consultant<br />
at <strong>GfK</strong> <strong>GeoMarketing</strong>, discusses<br />
the advantages of carrying out these<br />
types of regional analyses in two white<br />
papers. Download<br />
> gfk-geomarketing.com/wp-oracle_en<br />
White White<br />
White Paper Paper Paper:<br />
White Paper Paper Paper:<br />
Koppelstandorte<br />
Koppelstandorte<br />
“Advantages “Advantages of using of using<br />
postcode Koppelstandorte postcode Koppelstandorte regions regions im to im to<br />
aggregate deutschen aggregate deutschen LebensmittelLebensmittel- and analyze and analyze<br />
handel:handel: Ein anhaltender Ein anhaltender<br />
data data<br />
Trend in Oracle Trend in Oracle<br />
mit Gegentrend mit Gegentrend<br />
applications” applications”<br />
This white paper This details white paper the benefits details of the using benefits postcode of using maps postcode and regions maps and regions<br />
as the primary as means the primary for organizing, means for analyzing organizing, and analyzing visualizing and data visualizing in data in<br />
Oracle’s spatially Oracle’s enhanced spatially environment. enhanced The environment. paper outlines The paper the reasons outlines the reasons<br />
why aggregating why data aggregating at the level data of at postcode the level regions of postcode offers distinct regions offers distinct<br />
advantages over advantages the use of over a point-based the use of a approach. point-based approach.<br />
Nürnberg, September Nürnberg, 2010 September 2010<br />
January 2011 – January by <strong>GfK</strong> 2011 <strong>GeoMarketing</strong> – by <strong>GfK</strong> <strong>GeoMarketing</strong><br />
Knowledge by e-mail:<br />
<strong>GfK</strong> <strong>GeoMarketing</strong> e-News<br />
<strong>GfK</strong> <strong>GeoMarketing</strong>’s e-News keeps<br />
you in touch with the latest geomarketing<br />
developments. Subscribe online<br />
and receive monthly editions with upto-date<br />
information on RegioGraph,<br />
digital maps, market data and location<br />
research. Mailing list subscribers also<br />
get a free download each month. Sign<br />
up today!<br />
> gfk-geomarketing.com/enews_en<br />
<strong>GfK</strong> <strong>GeoMarketing</strong> <strong>Magazine</strong> <strong>04|2011</strong><br />
New English-language platform<br />
for RegioGraph<br />
In concert with the release of the<br />
English-language version of the geomarketing<br />
solution RegioGraph, a new<br />
online platform has been created where<br />
current and prospective customers can<br />
access details on applications, user<br />
reports and downloads for the Englishlanguage<br />
version of the software.<br />
> gfk-regiograph.com<br />
New free Europe map samples<br />
Our free map samples of Europe have<br />
been updated to reflect the latest<br />
boundary changes. Our company<br />
website offers access to comprehensive<br />
digital map samples in all standard<br />
formats, including *.shp (ESRI),<br />
*.tab (MapInfo), Oracle Spatial and<br />
RegioGraph. Convince yourself of the<br />
high-quality and worldwide coverage<br />
offered by our maps. For Germany,<br />
we also offer branch-specific maps<br />
e.g., maps for the pharmaceutical and<br />
energy supply branches.<br />
> gfk-geomarketing.com<br />
/map_samples<br />
Impressum<br />
<strong>GfK</strong> <strong>GeoMarketing</strong> GmbH<br />
Werner-von-Siemens-Str. 9<br />
Building 6508<br />
76646 Bruchsal<br />
Germany<br />
Tel: +49 (0)7251 9295100<br />
Fax: +49 (0)7251 9295290<br />
www.gfk-geomarketing.com<br />
info@gfk-geomarketing.com<br />
Responsible for publication:<br />
<strong>GfK</strong> <strong>GeoMarketing</strong> GmbH<br />
Management Board:<br />
Wolfram Scholz,<br />
Dr. Eberhard Stegner<br />
Chief editor:<br />
Cornelia Lichtner<br />
(V.i.S.d.P. by German law)<br />
Editors:<br />
Tatjana Günter,<br />
Gerrit Schreiber<br />
Graphics & layout:<br />
Nathalie Adlung<br />
Translation:<br />
Christopher Guider<br />
Celebrating 20 years of RegioGraph:<br />
The most creative congratulatory card!<br />
In the previous edition of the magazine, we<br />
asked our readers to come up a creative congratulatory<br />
card to mark the 20th anniversary<br />
of RegioGraph. We want to thank everyone for<br />
their submissions!<br />
We were most impressed by the congratulatory<br />
card submitted by Uwe Schenke, head of<br />
information systems at WEPA Apothekenbedarf<br />
GmbH & Co KG.<br />
Congratulations to Uwe Schenke and much<br />
success and fun working with the full version<br />
of RegioGraph Planning!<br />
Shared geomarketing knowledge is<br />
doubled geomarketing knowledge!<br />
Is your colleague always taking your <strong>GfK</strong> <strong>GeoMarketing</strong> <strong>Magazine</strong>?<br />
Arrange for him or her to receive a copy from us! Complete the online form at<br />
> www.gfk-geomarketing.com/form or photocopy this page and fax the<br />
completed form to:<br />
Company<br />
+49 (0)7251 9295290<br />
My address has changed. From now on, please send the <strong>GfK</strong> <strong>GeoMarketing</strong> <strong>Magazine</strong> to the<br />
address listed below.<br />
Please send an additional copy of <strong>GfK</strong> <strong>GeoMarketing</strong> <strong>Magazine</strong> to the address listed below.<br />
Please stop sending <strong>GfK</strong> <strong>GeoMarketing</strong> <strong>Magazine</strong> to the address listed below.<br />
Surname Name Department<br />
Street / No. Postcode / place Country<br />
Telephone Fax E-mail<br />
<strong>Magazine</strong><br />
<strong>Magazine</strong><br />
04 | 2011<br />
04 | 2011<br />
Free poster<br />
<strong>GfK</strong> Purchasing Power Density<br />
Europe 2011/2012 and<br />
<strong>GfK</strong> Purchasing Power 2011<br />
for coffee and tea in Germany<br />
Digital maps<br />
Ideal basis for geographic<br />
analyses and planning<br />
Digital maps<br />
Ideal basis for geographic<br />
analyses and planning<br />
Free poster<br />
<strong>GfK</strong> Purchasing Power Density<br />
Europe 2011/2012 and<br />
<strong>GfK</strong> Purchasing Power 2011<br />
for coffee and tea in Germany
Worldwide<br />
digital maps<br />
Partner of<br />
World‘s largest collection of postcode and administrative maps<br />
Postcode and administrative maps for more than 240 countries<br />
NEW:<br />
High-resolution maps without gaps or overlaps, digitized by our cartographers<br />
Available in all standard formats (ESRI, MapInfo, RegioGraph and Oracle)<br />
<strong>GfK</strong> Europe Map Edition &<br />
<strong>GfK</strong> World Map Edition 2011<br />
More information at www.gfk-geomarketing.com/maps