GfK GeoMarketing Magazine 04|2011
GfK GeoMarketing Magazine 04|2011
GfK GeoMarketing Magazine 04|2011

Create successful ePaper yourself
Turn your PDF publications into a flip-book with our unique Google optimized e-Paper software.
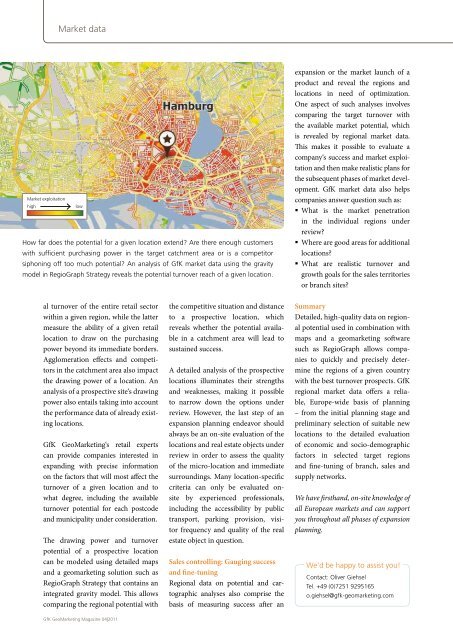
Market data<br />
Market exploitation<br />
high low<br />
How far does the potential for a given location extend? Are there enough customers<br />
with sufficient purchasing power in the target catchment area or is a competitor<br />
siphoning off too much potential? An analysis of <strong>GfK</strong> market data using the gravity<br />
model in RegioGraph Strategy reveals the potential turnover reach of a given location.<br />
al turnover of the entire retail sector<br />
within a given region, while the latter<br />
measure the ability of a given retail<br />
location to draw on the purchasing<br />
power beyond its immediate borders.<br />
Agglomeration effects and competitors<br />
in the catchment area also impact<br />
the drawing power of a location. An<br />
analysis of a prospective site‘s drawing<br />
power also entails taking into account<br />
the performance data of already existing<br />
locations.<br />
<strong>GfK</strong> <strong>GeoMarketing</strong>‘s retail experts<br />
can provide companies interested in<br />
expanding with precise information<br />
on the factors that will most affect the<br />
turnover of a given location and to<br />
what degree, including the available<br />
turnover potential for each postcode<br />
and municipality under consideration.<br />
The drawing power and turnover<br />
potential of a prospective location<br />
can be modeled using detailed maps<br />
and a geomarketing solution such as<br />
RegioGraph Strategy that contains an<br />
integrated gravity model. This allows<br />
comparing the regional potential with<br />
<strong>GfK</strong> <strong>GeoMarketing</strong> <strong>Magazine</strong> <strong>04|2011</strong><br />
the competitive situation and distance<br />
to a prospective location, which<br />
reveals whether the potential available<br />
in a catchment area will lead to<br />
sustained success.<br />
A detailed analysis of the prospective<br />
locations illuminates their strengths<br />
and weaknesses, making it possible<br />
to narrow down the options under<br />
review. However, the last step of an<br />
expansion planning endeavor should<br />
always be an on-site evaluation of the<br />
locations and real estate objects under<br />
review in order to assess the quality<br />
of the micro-location and immediate<br />
surroundings. Many location-specific<br />
criteria can only be evaluated onsite<br />
by experienced professionals,<br />
including the accessibility by public<br />
transport, parking provision, visitor<br />
frequency and quality of the real<br />
estate object in question.<br />
Sales controlling: Gauging success<br />
and fine-tuning<br />
Regional data on potential and cartographic<br />
analyses also comprise the<br />
basis of measuring success after an<br />
expansion or the market launch of a<br />
product and reveal the regions and<br />
locations in need of optimization.<br />
One aspect of such analyses involves<br />
comparing the target turnover with<br />
the available market potential, which<br />
is revealed by regional market data.<br />
This makes it possible to evaluate a<br />
company‘s success and market exploitation<br />
and then make realistic plans for<br />
the subsequent phases of market development.<br />
<strong>GfK</strong> market data also helps<br />
companies answer question such as:<br />
What is the market penetration<br />
in the individual regions under<br />
review?<br />
Where are good areas for additional<br />
locations?<br />
What are realistic turnover and<br />
growth goals for the sales territories<br />
or branch sites?<br />
Summary<br />
Detailed, high-quality data on regional<br />
potential used in combination with<br />
maps and a geomarketing software<br />
such as RegioGraph allows companies<br />
to quickly and precisely determine<br />
the regions of a given country<br />
with the best turnover prospects. <strong>GfK</strong><br />
regional market data offers a reliable,<br />
Europe-wide basis of planning<br />
– from the initial planning stage and<br />
preliminary selection of suitable new<br />
locations to the detailed evaluation<br />
of economic and socio-demographic<br />
factors in selected target regions<br />
and fine-tuning of branch, sales and<br />
supply networks.<br />
We have firsthand, on-site knowledge of<br />
all European markets and can support<br />
you throughout all phases of expansion<br />
planning.<br />
We‘d be happy to assist you!<br />
Contact: Oliver Giehsel<br />
Tel. +49 (0)7251 9295165<br />
o.giehsel@gfk-geomarketing.com<br />
1<br />
2<br />
3<br />
Tutorial<br />
Automatically updating the cartographic<br />
basis in RegioGraph<br />
The previously time-consuming process of updating the cartographic basis can now be<br />
completed at the click of a button in RegioGraph 2011. It‘s therefore quick and easy to<br />
automatically update the boundary status of existing project files while preserving all<br />
settings and completed analyses. This new feature saves time and enhances productivity.<br />
Preparation<br />
After acquiring a new map update for RegioGraph, the<br />
associated layer should be imported into the map library.<br />
Next, open the project data whose maps you want to update.<br />
Execution<br />
Click the QuickStart button in the bottom left-hand corner<br />
of the project sidebar to open the Quick Start Menu. Next,<br />
select Tasks > Update Maps.<br />
3<br />
2<br />
The subsequent dialog and pull-down menus allow you<br />
to specify the layers to be updated. Go ahead and select<br />
the first layer.<br />
RegioGraph then checks whether there are maps in the<br />
map library with a more up-to-date status. Click the<br />
desired layer.<br />
Prior to beginning the update, you can specify that a<br />
backup copy be made. Start the update by clicking OK.<br />
1<br />
Results<br />
After a layer has been updated, you‘ll receive a summary that<br />
lists the changes made. Specify how you wish to proceed:<br />
You can choose to update additional layers or end the update<br />
procedure. After ending the update process, all maps contained<br />
in the project file remain unchanged, but they now<br />
contain the new postcode or municipal boundaries.<br />
Map Contents<br />
(before/after):<br />
Only the "regions"<br />
layer has been<br />
affected. All settings<br />
have been preserved.<br />
11