Acute effects of night-time noise exposure on blood pressure in ...
Acute effects of night-time noise exposure on blood pressure in ...
Acute effects of night-time noise exposure on blood pressure in ...

Create successful ePaper yourself
Turn your PDF publications into a flip-book with our unique Google optimized e-Paper software.
660<br />
recorder, and ABPM device) and the participants’ alarm clock were<br />
synchr<strong>on</strong>ized at 1 m<strong>in</strong> precisi<strong>on</strong>.<br />
Specially tra<strong>in</strong>ed nurses <strong>in</strong>stalled the <str<strong>on</strong>g>noise</str<strong>on</strong>g> equipment, placed the<br />
ABPM device <strong>on</strong> the participants and gave them written <strong>in</strong>structi<strong>on</strong>s,<br />
dur<strong>in</strong>g a home visit at least 3 h before normal sleep<strong>in</strong>g <str<strong>on</strong>g>time</str<strong>on</strong>g>. Each participant<br />
was <strong>in</strong>structed not to engage <strong>in</strong> unusually heavy activity dur<strong>in</strong>g<br />
the measurements’ period and filled <strong>in</strong> a sleep log <strong>in</strong>dicat<strong>in</strong>g actual<br />
sleep<strong>in</strong>g <str<strong>on</strong>g>time</str<strong>on</strong>g>s.<br />
Statistical analysis<br />
L<strong>in</strong>ear mixed models which <strong>in</strong>cluded random <strong>in</strong>tercept and random<br />
coefficients for the various <str<strong>on</strong>g>noise</str<strong>on</strong>g> <strong>in</strong>dicators were applied for each<br />
centre separately <strong>in</strong> order to assess acute <str<strong>on</strong>g>effects</str<strong>on</strong>g> <str<strong>on</strong>g>of</str<strong>on</strong>g> <str<strong>on</strong>g>noise</str<strong>on</strong>g> <strong>on</strong> BP and<br />
HR dur<strong>in</strong>g <str<strong>on</strong>g>night</str<strong>on</strong>g>-<str<strong>on</strong>g>time</str<strong>on</strong>g> sleep. The number <str<strong>on</strong>g>of</str<strong>on</strong>g> repeated measurements<br />
per subject corresp<strong>on</strong>ds to the number <str<strong>on</strong>g>of</str<strong>on</strong>g> systolic and diastolic BP<br />
measurements (mmHg), as well as HR measurements (beats per<br />
m<strong>in</strong>ute—b.p.m.) dur<strong>in</strong>g the self-reported sleep<strong>in</strong>g period. The<br />
A-weighted <strong>in</strong>door <str<strong>on</strong>g>noise</str<strong>on</strong>g> level equivalents <str<strong>on</strong>g>of</str<strong>on</strong>g> 1 m<strong>in</strong> (LAeq1m<strong>in</strong>) and<br />
<str<strong>on</strong>g>of</str<strong>on</strong>g> 15 m<strong>in</strong> (LAeq15m<strong>in</strong>) before BP measurements were used as shortterm<br />
<str<strong>on</strong>g>noise</str<strong>on</strong>g> <str<strong>on</strong>g>exposure</str<strong>on</strong>g> variables. In this type <str<strong>on</strong>g>of</str<strong>on</strong>g> model, where an <strong>in</strong>dividual<br />
serves as his own ‘c<strong>on</strong>trol’, there is no need to adjust for <strong>in</strong>dividual<br />
c<strong>on</strong>found<strong>in</strong>g factors. In order to account for the possible c<strong>on</strong>found<strong>in</strong>g<br />
effect <str<strong>on</strong>g>of</str<strong>on</strong>g> misreport<strong>in</strong>g <str<strong>on</strong>g>of</str<strong>on</strong>g> sleep<strong>in</strong>g and wak<strong>in</strong>g <str<strong>on</strong>g>time</str<strong>on</strong>g>s (potentially associated<br />
with both BP and <str<strong>on</strong>g>noise</str<strong>on</strong>g> levels), the above <str<strong>on</strong>g>noise</str<strong>on</strong>g> <str<strong>on</strong>g>exposure</str<strong>on</strong>g> variables<br />
were also adjusted for the sequence <str<strong>on</strong>g>of</str<strong>on</strong>g> BP measurements,<br />
us<strong>in</strong>g 2 l<strong>in</strong>ear terms. The first l<strong>in</strong>ear term denoted the sequence<br />
<str<strong>on</strong>g>of</str<strong>on</strong>g> the BP measurements (1,2, ...,k) from the start to the middle <str<strong>on</strong>g>of</str<strong>on</strong>g><br />
each pers<strong>on</strong>s sleep period and the sec<strong>on</strong>d denoted the sequence<br />
<str<strong>on</strong>g>of</str<strong>on</strong>g> the BP measurements (1,2, ...,k) from the middle to the end <str<strong>on</strong>g>of</str<strong>on</strong>g><br />
each pers<strong>on</strong>s sleep period. Other <str<strong>on</strong>g>noise</str<strong>on</strong>g> <str<strong>on</strong>g>exposure</str<strong>on</strong>g> variables were the<br />
presence or absence <str<strong>on</strong>g>of</str<strong>on</strong>g> a source-specific <str<strong>on</strong>g>noise</str<strong>on</strong>g> event dur<strong>in</strong>g the<br />
15 m<strong>in</strong> periods and each source-specific event’s LAmax. If more than<br />
<strong>on</strong>e event were present <strong>in</strong> the 15 m<strong>in</strong> <strong>in</strong>terval, the higher LAmax<br />
was used. S<strong>in</strong>ce a <str<strong>on</strong>g>noise</str<strong>on</strong>g> stimulus may not have the same effect <strong>in</strong> the<br />
presence <str<strong>on</strong>g>of</str<strong>on</strong>g> other <str<strong>on</strong>g>noise</str<strong>on</strong>g>, <strong>in</strong> all models assess<strong>in</strong>g the source-specific<br />
<str<strong>on</strong>g>noise</str<strong>on</strong>g>, we adjusted for the 10th percentile <str<strong>on</strong>g>of</str<strong>on</strong>g> the <str<strong>on</strong>g>noise</str<strong>on</strong>g> level equivalent<br />
(L90) <strong>in</strong> all the 15 m<strong>in</strong> <strong>in</strong>tervals. After obta<strong>in</strong><strong>in</strong>g the four centre-specific<br />
<str<strong>on</strong>g>effects</str<strong>on</strong>g> us<strong>in</strong>g random effect models, we then comb<strong>in</strong>ed the centrespecific<br />
results us<strong>in</strong>g either fixed or random <str<strong>on</strong>g>effects</str<strong>on</strong>g> meta-analysis<br />
depend<strong>in</strong>g <strong>on</strong> the absence or presence <str<strong>on</strong>g>of</str<strong>on</strong>g> heterogeneity. All reported<br />
P-values are based <strong>on</strong> two-sided hypotheses and the significance level<br />
used was 5%.<br />
Results<br />
Table 1 shows the descriptive characteristics <str<strong>on</strong>g>of</str<strong>on</strong>g> the samples. The<br />
mean number <str<strong>on</strong>g>of</str<strong>on</strong>g> repeated BP measurements per <str<strong>on</strong>g>night</str<strong>on</strong>g> was<br />
similar <strong>in</strong> all centres (range 29–32). BP and HR displayed a<br />
normal distributi<strong>on</strong> (data not shown). The number <str<strong>on</strong>g>of</str<strong>on</strong>g> aircraft<br />
events dur<strong>in</strong>g the <str<strong>on</strong>g>night</str<strong>on</strong>g>-<str<strong>on</strong>g>time</str<strong>on</strong>g> sleep was higher <strong>in</strong> Athens compared<br />
with the other centres. The presence <str<strong>on</strong>g>of</str<strong>on</strong>g> subjects with no or few<br />
<str<strong>on</strong>g>night</str<strong>on</strong>g> aircraft events was expla<strong>in</strong>ed by the sampl<strong>in</strong>g procedure<br />
through which a number <str<strong>on</strong>g>of</str<strong>on</strong>g> subjects were selected from the<br />
ma<strong>in</strong> sub-sample <str<strong>on</strong>g>of</str<strong>on</strong>g> low <str<strong>on</strong>g>exposure</str<strong>on</strong>g> to aircraft <str<strong>on</strong>g>noise</str<strong>on</strong>g>. In Milan and<br />
Stockholm, the number <str<strong>on</strong>g>of</str<strong>on</strong>g> <strong>in</strong>door events was much larger than aircraft<br />
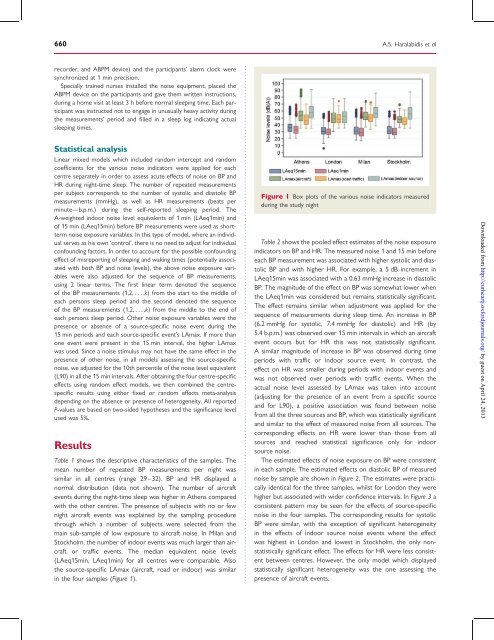
or traffic events. The median equivalent <str<strong>on</strong>g>noise</str<strong>on</strong>g> levels<br />
(LAeq15m<strong>in</strong>, LAeq1m<strong>in</strong>) for all centres were comparable. Also<br />
the source-specific LAmax (aircraft, road or <strong>in</strong>door) was similar<br />
<strong>in</strong> the four samples (Figure 1).<br />
A.S. Haralabidis et al<br />
Figure 1 Box plots <str<strong>on</strong>g>of</str<strong>on</strong>g> the various <str<strong>on</strong>g>noise</str<strong>on</strong>g> <strong>in</strong>dicators measured<br />
dur<strong>in</strong>g the study <str<strong>on</strong>g>night</str<strong>on</strong>g><br />
Table 2 shows the pooled effect estimates <str<strong>on</strong>g>of</str<strong>on</strong>g> the <str<strong>on</strong>g>noise</str<strong>on</strong>g> <str<strong>on</strong>g>exposure</str<strong>on</strong>g><br />
<strong>in</strong>dicators <strong>on</strong> BP and HR. The measured <str<strong>on</strong>g>noise</str<strong>on</strong>g> 1 and 15 m<strong>in</strong> before<br />
each BP measurement was associated with higher systolic and diastolic<br />
BP and with higher HR. For example, a 5 dB <strong>in</strong>crement <strong>in</strong><br />
LAeq15m<strong>in</strong> was associated with a 0.63 mmHg <strong>in</strong>crease <strong>in</strong> diastolic<br />
BP. The magnitude <str<strong>on</strong>g>of</str<strong>on</strong>g> the effect <strong>on</strong> BP was somewhat lower when<br />
the LAeq1m<strong>in</strong> was c<strong>on</strong>sidered but rema<strong>in</strong>s statistically significant.<br />
The effect rema<strong>in</strong>s similar when adjustment was applied for the<br />
sequence <str<strong>on</strong>g>of</str<strong>on</strong>g> measurements dur<strong>in</strong>g sleep <str<strong>on</strong>g>time</str<strong>on</strong>g>. An <strong>in</strong>crease <strong>in</strong> BP<br />
(6.2 mmHg for systolic, 7.4 mmHg for diastolic) and HR (by<br />
5.4 b.p.m.) was observed over 15 m<strong>in</strong> <strong>in</strong>tervals <strong>in</strong> which an aircraft<br />
event occurs but for HR this was not statistically significant.<br />
A similar magnitude <str<strong>on</strong>g>of</str<strong>on</strong>g> <strong>in</strong>crease <strong>in</strong> BP was observed dur<strong>in</strong>g <str<strong>on</strong>g>time</str<strong>on</strong>g><br />
periods with traffic or <strong>in</strong>door source event. In c<strong>on</strong>trast, the<br />
effect <strong>on</strong> HR was smaller dur<strong>in</strong>g periods with <strong>in</strong>door events and<br />
was not observed over periods with traffic events. When the<br />
actual <str<strong>on</strong>g>noise</str<strong>on</strong>g> level assessed by LAmax was taken <strong>in</strong>to account<br />
(adjust<strong>in</strong>g for the presence <str<strong>on</strong>g>of</str<strong>on</strong>g> an event from a specific source<br />
and for L90), a positive associati<strong>on</strong> was found between <str<strong>on</strong>g>noise</str<strong>on</strong>g><br />
from all the three sources and BP, which was statistically significant<br />
and similar to the effect <str<strong>on</strong>g>of</str<strong>on</strong>g> measured <str<strong>on</strong>g>noise</str<strong>on</strong>g> from all sources. The<br />
corresp<strong>on</strong>d<strong>in</strong>g <str<strong>on</strong>g>effects</str<strong>on</strong>g> <strong>on</strong> HR were lower than those from all<br />
sources and reached statistical significance <strong>on</strong>ly for <strong>in</strong>door<br />
source <str<strong>on</strong>g>noise</str<strong>on</strong>g>.<br />
The estimated <str<strong>on</strong>g>effects</str<strong>on</strong>g> <str<strong>on</strong>g>of</str<strong>on</strong>g> <str<strong>on</strong>g>noise</str<strong>on</strong>g> <str<strong>on</strong>g>exposure</str<strong>on</strong>g> <strong>on</strong> BP were c<strong>on</strong>sistent<br />
<strong>in</strong> each sample. The estimated <str<strong>on</strong>g>effects</str<strong>on</strong>g> <strong>on</strong> diastolic BP <str<strong>on</strong>g>of</str<strong>on</strong>g> measured<br />
<str<strong>on</strong>g>noise</str<strong>on</strong>g> by sample are shown <strong>in</strong> Figure 2. The estimates were practically<br />
identical for the three samples, whilst for L<strong>on</strong>d<strong>on</strong> they were<br />
higher but associated with wider c<strong>on</strong>fidence <strong>in</strong>tervals. In Figure 3 a<br />
c<strong>on</strong>sistent pattern may be seen for the <str<strong>on</strong>g>effects</str<strong>on</strong>g> <str<strong>on</strong>g>of</str<strong>on</strong>g> source-specific<br />
<str<strong>on</strong>g>noise</str<strong>on</strong>g> <strong>in</strong> the four samples. The corresp<strong>on</strong>d<strong>in</strong>g results for systolic<br />
BP were similar, with the excepti<strong>on</strong> <str<strong>on</strong>g>of</str<strong>on</strong>g> significant heterogeneity<br />
<strong>in</strong> the <str<strong>on</strong>g>effects</str<strong>on</strong>g> <str<strong>on</strong>g>of</str<strong>on</strong>g> <strong>in</strong>door source <str<strong>on</strong>g>noise</str<strong>on</strong>g> events where the effect<br />
was highest <strong>in</strong> L<strong>on</strong>d<strong>on</strong> and lowest <strong>in</strong> Stockholm, the <strong>on</strong>ly n<strong>on</strong>statistically<br />
significant effect. The <str<strong>on</strong>g>effects</str<strong>on</strong>g> for HR were less c<strong>on</strong>sistent<br />
between centres. However, the <strong>on</strong>ly model which displayed<br />
statistically significant heterogeneity was the <strong>on</strong>e assess<strong>in</strong>g the<br />
presence <str<strong>on</strong>g>of</str<strong>on</strong>g> aircraft events.<br />
Downloaded from<br />
http://eurheartj.oxfordjournals.org/ by guest <strong>on</strong> April 24, 2013